Transcription
ePlace SolutionsBUSINESS PLANMr. John JonesPhone: 1-800-555-1212www.sampleplans1.com
Table of ContentsExecutive Summary . 4Loan Analysis. 5Financial Highlights. 5Startup Summary. 6Industry at a Glance. 8Projected Industry Growth. 9Key External Drivers.10Objectives.10SWOT Analysis.11Marketing.11Management Summary.12FInancial Indicators.13Revenue Forecast.14Break-Even Analysis.15Profit and Loss Statement.16Projected Cash Flow.17Projected Balance Sheet.18Year 1 Personnel Forecast.19Year 1 Revenue Forecast.19Year 1 Profit & Loss.20Year 1 Balance Sheet.21
Executive SummaryEPlace Solutions will be an innovative online e-commerce portal offering a variety of products to consumers throughout the globe.Founded by Mr. John Jones, a seasoned business visionary with an eye towards profit and achievement, the organization is set toenter the market during 2012. The timing of market entry is nothing less than exceptional as consumers throughout the globe havebegun releasing pent-up spending that was held as a result of the global recession. Online shopping is at an all-time high with newconsumer mindsets calling for them to shop for the types of deals and bargains that will be so much a part of the EPlace Solutionsbusiness model. While the market has a great deal of potential and is filled with incredible opportunities, in order to capitalize onthem, a strong infusion of working capital must be acquired. Working capital will be used in a variety of areas including marketing,logistics, insurance, management as well as the financing of the day to day operations of a business of this type. The founder projectsneeding a working capital sum of 100K for his venture with repayment of this sum coming from profits made through the website.Marketing for EPlace Solutions will be done primarily through the Internet. The founder will develop a strong online presence that isuser-friendly, easy to navigate and encourages consumers to engage in longer stays that increase the probability of a purchase. Inaddition to the home website, plans also call for the organization to develop a strong social media presence using Facebook.com andTwitter.com; the world’s premier social networks with over 1 billion persons in their combined communities. The social media pageswill be updated on a daily basis with information that will drive the marketing message and allow it to resonate with the members ofthe core audience. Long-term plans call for the founder to possibly explore mass media marketing including print, radio and televisionbut at this time, those mediums simply will not yield an optimal return on investment. For this reason, the founder has decided toforego them but does reserve the right to revisit them as the needs and resources of the business allow.Financials for EPlace Solutions are strong and show patterns of consistent growth over the course of the next five years. Overheadcosts are extremely low and do not in any way threaten the projected profit position of the organization in any of the five years that areoutlined in the financials. There are no large salaries involved in the financial mix as the founder does not project to immediately needto hire a staff of any type as the majority of the functions can be handled alone. All of these factors bode extremely well for EPlaceSolutions as the organization looks to become one of the online commerce’s signature brands and a true market leader.4
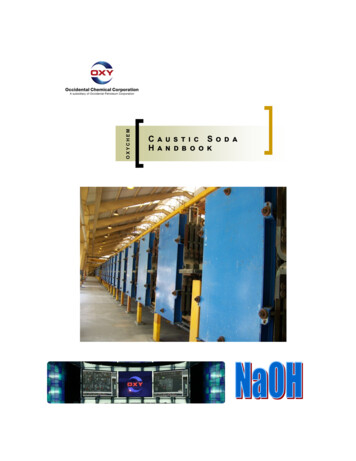
Loan AnalysisLoan AnalysisInterest Rate:Years of Loan:Loan Amount:8.50%15 100,000.00Monthly Payment:Total Payment:Total Interest: 984.74 177,253.12 77,253.12The projected loan analysis for EPlace Solutions is shown in thetable above. The organization projects to have a monthly loanpayment of 984.74 with a total loan payment of 177,253.12over the 15 year life of the loan.Financial Highlights 2,500,000.00 2,000,000.00 1,500,000.00 1,000,000.00 500,000.00 0.00Year 1Year 2RevenueDirect CostsYear 3Year 4Operating ExpensesYear 5Net ProfitThe financial highlights for EPlace Solutions are shown in the chart above. The organization projects to have strong growth trends overthe course of the next five years.5
Startup SummaryStart-up ExpensesPayrollRent DepositsPermits 10,000 5,000 6,500LicenseWeb Development 3,500 25,000Total Start-up Expenses 50,000Start-up Assets 50,000Working CapitalInventory 10,000 12,500MaterialsMiscellaneous 1,000 1,500Total Start-up Assets 27,100Total Requirements 50,000 25,000 0Total RequirementsTotal Start-up ExpensesTotal Start-up AssetsStartup Figures 50,000 50,000ExpensesAssetsInvestmentCurrent Loans 100,000Start-up Investments6IInvestmentOwner 25,000InvestorTotal Planned Investment 0 25,0005
Mission StatementThe mission of EPlace Solutions is to provide a reliable online marketplace for consumers that offer quality products at a reasonableprice that drives profits for the parent company while adding value to our brand constituents.Company OwnershipJohn Jones is the sole owner of EPlace Solutions. There are no other parties with the ability to claim an ownership stake in thisventure. It should however be noted that Mr. Jones is currently soliciting offers from investors or investment groups that share in hislong-term vision for profit and success.Business LocationEPlace Solutions will be located in San Diego, California with the ability to serve clients throughout the globe. Long-term plans arefor this to remain the base of operations due to the familiarity of the founder with the area and the reach that the Internet provides.Products and ServicesEPlace Solutions will offer a security online marketplace for consumers looking to transact purchases for reduced cost items. Theorganization will have a drop shipping approach which will greatly enhance the appeal and lower the overall overhead costs that areincurred.About the FounderMr. John Jones is the founder of EPlace Solutions. Mr. Jones is a seasoned business professional with the ability to develop strategiesthat yield optimal financial results. His background in architecture will be invaluable as he looks to meticulously create a businessmodel and approach that allow EPlace Solutions to become recognized as a true market leader.7
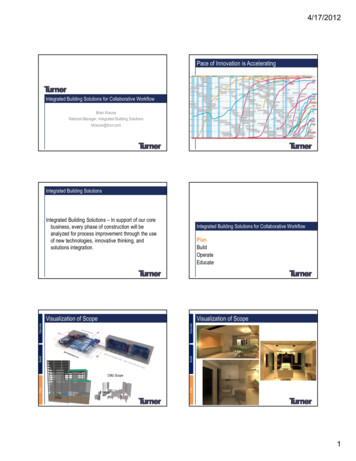
Industry at a GlanceKey StatisticsSnapshotRevenue 186.4bnAnnual Growth 06-11Annual Growth 11-16Profit 12.7bnWages 7.8bnBusinessProducts and servicessegmentation (2011)5.5%6.5%Office equipmentand supplies8.4%9.4%50,9734.5%Food, beveragesand pet foodMedication andcosmetics24.3%Computers and TVs7.2%Furniture andhome appliances13.8%Sporting goods, toys,hobby items and games23.2%Other merchandise15%Clothing, footware,accessories and jewelrySOURCE: WWW.IBISWORLD.COMEvery year, more than 100 million Americans purchase goods fromthe online retail marketplace, one of the fastest-growing industriesin the United States. Since the start of the decade, revenue forthe E-Commerce and Online Auctions industry has grown at anexceptional rate, outperforming most retail industries in thecountry.CDs, DVDs, books, clothing, footwear and groceries. Hard-to-findniche products or products that are no longer being producedhave also found homes online. As product ranges have grown, sohas the number of industry operators. The number of enterpriseshas grown at an average annual rate of 2.4% in the five years to2011 to 50,973.Despite the brief recession-induced slump in 2008 and 2009,industry revenue is expected to increase at an average annual rateof 8.4% in the five years to 2011, including a 10.0% jump in 2011 tobring revenue to 186.4 billion. Because of steady growth, industrymargins have also improved, increasing from about 5.0% in 2006to an estimated 6.8% in 2011.In the coming years, continued economic recovery will contributeto the industry’s strong growth. Increases in per capita incomeand employment will improve consumer sentiment, increasingconsumers’ likelihood to buy. Also, broadband internet adoptionwill grow in the next five years, boosting online retailers’accessibility. IBISWorld forecasts that these factors will causeindustry revenue to grow at an average annual rate of 9.4% overthe five years to 2016 to total 291.9 billion.As online shopping becomes more popular, retailers are expandingthe products they carry to include common household goods like8
Projected Industry GrowthIn the 10 years to 2016, industry value added, which measures the E-Commerce and Online Auctions industry’s contribution to the US economy,is expected to increase by an average annual rate of 11.0%, while US GDP is forecast to rise by an average annual rate of 2.0% over this sameperiod. This indicates that the industry is in growth phase of its life cycle, as its growth rate outpaces GDP over a 10-year period. Rising industryparticipation and new forms of businesses also indicate a growing industry.Over the five years to 2011, the number of online retailers and auction sites has increased at an average annual rate of 2.4% to 50,973businesses. This growth in industry participation can be attributed to an increase in e-commerce demand, mainly driven by the risingprevalence of broadband connections and other high-speed internet services. Such services have allowed more consumers to surf the netand buy products without experiencing any lag time; consequently, more consumers have been able to make purchases online with addedconvenience. Furthermore, the industry’s low barriers to entry and skill requirements has allowed for companies to enter the industry withoutmuch difficulties, leading to higher participation. In the five years to 2016, the number of operators is expected to further rise with higherdemand for e-commerce websites. Total number of players is forecast to increase by 2.4% annually to total 57,428 businesses.In recent years, a relatively new form of e-commerce known as social commerce has emerged within the industry. Unlike traditional e-tailers,social commerce involves using social media, online media that encourages online interaction and user contribution, to assist in the onlinebuying and selling of goods. This subset of e-commerce retailers has gained wide acceptance to consumers in the five years to 2011, byproviding engaging content and discounted (or wholesale) prices through user interaction (i.e. sharing information and purchasing as groups).IBISWorld expects more form of social media or new e-commerce businesses to arise in the next five years to 2016, further contributing to thegrowth stage designation of the industry.9
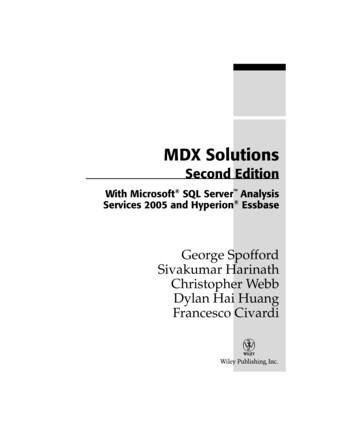
Key External DriversPer capita disposable incomeDisposable income is a deciding factor in determining the quantityand quality of online purchases. Changes in income can occur becauseof movements in wages, government benefits, unemployment andtax rates and returns on assets. This driver is expected to increaseover 2011, making it a potential opportunity for industry growth.The E-Commerce and Online Auctions industry is sensitive to the4% Change321penetration rate of PCs. If the rate of computer ownership increases,then a larger proportion of the population has access to e-tailers.Additionally, increased computer and internet use will likely raiseconfidence, leading to greater computer activity and sales. Thisdriver is expected to increase over 2011.0-1Year05070911131517Percentage of households with atleast one computer858075%706560Year 0305070911131517During periods of low economic growth, consumer sentimentdeclines; as a result, consumers limit their expenditure. This factorsubsequently affects demand for products online. This driver isexpected to rise over 2011, but because of high unemployment, itremains a threat to industry growth. When more households haveaccess to broadband internet as opposed to dial-up, they are morelikely to make online purchases because of the speed gains derivedfrom a broadband connection. This driver is expected to increaseover 2011.ObjectivesWhat follows is a listing of the core objectives for EPlace Solutions.1. Develop a strong customer base. Developing a strong customer base will be the first priority. To achieve this end the founder willcreate an effective customer service model that adequately addresses all of the unique needs of the online consumer.2. Create a broad marketplace. Having a broad marketplace with a variety of goods will be another of the core objectives. Fromfurniture to electronics to kitchen and fashion, the founder is intent on creating a marketplace that is as broad as the consumers taste.3. Online security. As the online shopping industry has continued to grow, so too has the need for online security. With that being saidthe founder will look to develop a secure environment that protects the consumer on all levels.4. Drive profits. Driving profits will be the final objective for EPlace Solutions as the founder will look to grow the revenue and profitstreams exponentially over the course of the coming years.10
SWOT AnalysisWhat follows is an analysis of the core strengths and weaknesses of the EPlace Solutions business model as well as the opportunities andthreats that currently exist within the marketplace.Strengths1. Knowledge of the founder. EPlace Solutions founder Mr.John Jones is a seasoned business professional who is wellattuned to the e-commerce and Internet driven marketplace. Hisbroad skill set will be invaluable during all phases of businessgrowth and evolution.Opportunities1. Increase in online activity among minorities. Minorities2. Low overhead costs. EPlace Solutions will have extremelyare beginning to turn to the Internet for their shopping needs inlarge quantities. Research conducted via IBISworld.com showsthat appealing to this segment of the market will be one of thekeys to success for companies like EPlace Solutions that arelooking for long-term sustainability.low overhead costs due to the fact that the business will not carryinventory or need office space to operate effectively.Threats3. Growth of the industry. The growth of the industry is1. Larger competitors. Larger competitors such as Ebay.another of the core strengths of the EPlace Solutions businessmodel. With more and more shopping traffic going online, thelong-term prospects for EPlace Solutions are nothing less thanpromising.com and Amazon.com pose a threat as they are already firmlyentrenched in the marketplace and have acquired a large share ofthe online shopping market.Weaknesses1. Lack of funding. Lack of funding is the primary weakness forEPlace Solutions as all of the other components of the businessmodel and approach are extremely sound.MarketingEPlace Solutions will rely primarily on the Internet to drive the marketing efforts. Planned marketing efforts include the creation of a userfriendly website developed using all of the latest in design and online technologies. The website will also feature SEO (Search EngineOptimization) which will allow it to rank higher with popular search engines including Yahoo.com and Google.com among others. Socialnetworking using Facebook.com and Twitter.com will round out the EPlace Solutions marketing model and approach with each being usedextensively throughout the course of each calendar year.119
Management SummaryPersonnel ForecastYear 1Year 2Year 3Year 4Year 5Personnel CountFounderOperationsTotal Personnel123123123123123Personnel WageFounderOperations 60,000 78,000 63,000 81,900 66,150 85,995 69,458 90,295 72,930 94,809Personnel CostsFounderOperationsTotal Payroll 60,000 156,000 216,000 63,000 163,800 226,800 66,150 171,990 238,140 69,458 180,590 250,047 72,930 189,619 262,549The projected management and personnel summary for EPlace Solutions is shown in the table above.1211
Financial ginBrandonNet ProfiBuenot MarginVickieEBITDABueno-Serroneto RevenueTotal PersonnelLeverage Ratios:PersonnelDebt to WageEquityJosephDebt Serroneto Assets RatioBrandonInterestBuenoCoverage RatioVickie Bueno-SerroneLiquidity Ratios:PersonnelCurrent CostsRatioJosephCurrentSerroneDebt to Total Assets RatioBrandon BuenoVickie ollto Equity RatioYear 1Year 2Year 3Year 4Year 5%147.41%130.24 11,19617.88% 11,1963.59 11,1960.29 11,75621.63%4.65 11,756 11,7560.30 12,34422.37%5.75 12,344 12,3440.29 12,96121.82%6.90 12,961 12,9610.27 13,60920.71%8.09 13,609 13,60920.91 11,1964.58% 11,196 11,196 33,5882.4131.743.07% 11,756 11,756 11,7561.89 35,26745.942.14% 12,344 12,344 12,3441.51 37,03164.121.54% 12,961 12,961 12,9611.23 38,88286.931.14% 13,609 13,609 13,6091.02 40,826Financial %12Gross Margin3Net Profit Margin45EBITDA to RevenueThe financial indicators for EPlace Solutions are shown in the table above and graph. The organization projects to have a favorablegrowth in profit margin in each of the first five years of operations.13
Revenue nnelCountProductsJoseph SerroneBrandonTotalUnitsBuenoVickie nel WageRevenueJoseph SerroneBrandon BuenoProductsVickieRevenueTotalBueno-SerroneDirect UnitCostsPersonnelCostProductsJoseph SerroneBrandon BuenoVickie CostDirectBueno-Serroneof RevenueTotal PayrollProductsSubtotal Cost of RevenueYear 1Year 2Year 3Year 4Year 516,87616,87613 175.0017,90817,90813 175.0019,09419,09413 175.0010,458110,458113 175.0012,027112,027113 175.00 11,196 11,196 1,203,335 11,196 1,203,335 11,756 1,383,835 11,756 1,383,835 11,756 12,344 1,591,410 12,344 1,591,410 12,344 12,961 1,830,122 12,961 1,830,122 12,961 13,609 2,104,640 13,609 2,104,640 13,609 85.00 11,196 11,196 11,196 33,588 584,477 584,477 85.00 11,756 11,756 11,756 35,267 672,148 672,148 85.00 12,344 12,344 12,344 37,031 772,971 772,971 12,961 85.00 12,961 12,961 38,882 888,916 888,916 13,609 85.00 13,609 13,609 40,826 1,022,254 1,022,254Total Revenue 2,500,000 2,000,000 1,500,000 1,000,000 500,000 0Year 1Year 2Year 3Year 4Year 5Total RevenueThe projected revenue forecast for EPlace Solutions is shown in the chart and graph above. The organization projects to have strongrevenue growth that is commensurate with research conducted via IBISworld.com.14
Break-Even AnalysisIncome Chart 1,400,000 1,200,000Sales Revenue 100.0% 1,000,000Cost of Sales 48.6% 800,000Gross Profit 51.4% 600,000Fixed Expenses 2.4% 400,000Income Before Tax 35.0% 200,000 0Break-evenRevenue 1,400,000 1,200,000REVENUE 1,000,000FIXED COSTS 800,000 600,000 400,000 200,000 0012345678910 1112MonthsThe projected break-even analysis for EPlace Solutions is shown in the table above. The organization projects to have first year averagemonthly revenues of 100,278 with costs of 77,373.15
Profit and Loss StatementPersonnelProFormaForecastProfit and LossRevenue CountPersonnelTotalJosephCostSerroneof RevenueBrandon BuenoVickie MarginGrossBueno-SerroneTotal PersonnelGrossMargin/RevenueYear 1 1,203,3351 584,47711 618,858351.43%Year 2 1,383,835 672,148111 711,68751.43%3Year 3 1,591,410 772,971111 818,44051.43%3Year 4 1,830,122 888,916111 941,20551.43%3Year 5 2,104,640 1,022,25411 1,082,386151.43%3Expenses WagePersonnelSuppliesJoseph SerroneBrandon BuenoRentVickie Bueno-SerroneMarketingInsurancePersonnel nsesTotal PayrollProfit Before Interest and TaxesEBITDAInterest ExpenseTaxes Incurred 18,000 11,196 11,196 36,000 11,196 26,400 2,400 4,800 11,196 32,400 11,196 216,000 11,196 336,000 33,588 282,858 282,858 8,000 83,401 18,900 11,756 37,800 11,756 11,756 27,720 2,520 5,040 34,020 11,756 11,756 226,800 352,800 11,756 35,267 358,887 358,887 8,000 122,810 19,845 12,344 39,690 12,344 12,344 29,106 2,646 5,292 35,721 12,344 12,344 238,140 370,440 12,344 37,031 448,000 448,000 8,000 154,000 20,837 12,961 41,675 12,961 12,961 30,561 2,778 5,557 37,507 12,961 12,961 250,047 388,962 12,961 38,882 552,243 552,243 8,000 190,485 21,879 13,609 13,609 43,758 13,609 32,089 2,917 5,834 39,382 13,609 13,609 262,549 408,410 13,609 40,826 673,976 673,976 8,000 233,092Net ProfitNet Profit/Revenue 191,45715.91% 228,07616.48% 286,00017.97% 353,75819.33% 432,88520.57%Year 117%30%Year 2Total Cost of Revenue53%Total Op. Expenses18%28%Year 354%Net ProfitTotal Op. Expenses22%Total Cost of Revenue54%Total Op. ExpensesNet Profit1626%Total Cost of Revenue54%Net ProfitYear 424%20%Total Cost of RevenueNet ProfitYear 523%22%Total Op. ExpensesTotal Cost of Revenue55%Total Op. ExpensesNet Profit
Projected Cash FlowPersonnelProFormaForecastCash FlowYear 1Year 2Year 3Year 4Year 5Cash ReceivedPersonnelCountRevenueJoseph Other Current AssetsSale of Long-term AssetsPersonnelNewInvestmentWage ReceivedTotalJosephCashSerroneReceivedBrandon BuenoVickie Bueno-SerroneExpendituresOperating Expenses & Direct CostsPersonnelCurrentBorrowingCosts Repay.L-TJosephLiabilitiesSerronePrincipal Repay.Brandon BuenoPurchaseOther Current AssetsVickie Bueno-SerronePurchaseLong-term AssetsTotal PayrollDividendsTotal Expenditures1 1,203,3351 01 03 0 0 0 11,196 1,203,335 11,196 11,196 1,011,878 0 11,196 11,817 11,196 11,196 33,588 1,023,695 1,383,83511 01 03 0 0 0 1,383,835 11,756 11,756 11,756 1,155,759 0 11,756 11,817 11,756 0 11,756 0 35,267 0 1,167,576 1,591,41011 01 03 0 0 0 1,591,410 12,344 12,344 12,344 1,305,411 0 12,344 11,817 12,344 0 12,344 0 37,031 0 1,317,228 1,830,12211 01 03 0 0 0 1,830,122 12,961 12,961 12,961 1,476,364 0 12,961 11,817 12,961 0 12,961 0 38,882 0 1,488,181 2,104,64011 01 03 0 0 0 2,104,640 13,609 13,609 13,609 1,671,755 0 13,609 11,817 13,609 0 13,609 0 40,826 0 1,683,572Net Cash FlowCash Balance 179,640 204,640 216,259 420,899 274,183 695,082 341,941 1,037,023 421,068 1,458,091Pro Forma Cash Flow 2,500,000 2,000,000 1,500,000 1,000,000 500,000 0Year 1Year 2Total Cash ReceivedYear 3Total ExpendituresYear 4Year 5Cash Balance17
Projected Balance SheetPersonnelProFormaForecastBalance SheetYear 1Year 2Year 3Year 4Year 511 204,6401 03 204,6401 420,89911 0 420,89931 695,08211 0 695,08231 1,037,02311 0 1,037,02331 1,458,09111 0 1,458,0913 0 11,196 11,196 0 11,196 0 204,640 0 11,756 11,756 0 11,756 0 420,899 0 12,344 12,344 0 12,344 0 695,082 12,961 0 12,961 0 12,961 0 1,037,023 13,609 0 13,609 0 13,609 0 1,458,091 11,196 11,196 11,196 100,000 33,588 0 100,000 11,756 11,756 100,000 11,756 35,267 0 100,000 12,344 12,344 100,000 12,344 37,031 0 100,000 12,961 12,961 100,000 12,961 38,882 0 100,000 13,609 13,609 100,000 13,609 40,826 0 100,000Long-term LiabilitiesTotal Liabilities( 11,817) 88,183( 23,634) 76,366( 35,451) 64,549( 47,268) 52,732( 59,085) 40,915Paid-in CapitalRetained EarningsEarningsTotal CapitalTotal Liabilities and Capital 25,000( 50,000) 191,457 166,457 254,640 25,000 141,457 228,076 394,533 470,899 25,000 369,533 286,000 680,533 745,082 25,000 655,533 353,758 1,034,291 1,087,023 25,000 1,009,291 432,885 1,467,176 1,508,091Net Worth 116,457 344,533 630,533 984,291 1,417,176Assets CountPersonnelCurrentJoseph AssetsSerroneBrandon BuenoCashVickie CurrentOtherBueno-SerroneAssetsTotal PersonnelCurrent AssetsLong-termWagePersonnelAssetsLong-termJoseph SerroneAssetsBrandon eno-SerroneAssetsTotal AssetsPersonnel CostsLiabilitiesJoseph Serroneand CapitalBrandonLiabilitiesCurrentBuenoVickie Bueno-SerroneCurrentBorrowingTotal PayrollOtherCurrent LiabilitiesSubtotal Current LiabilitiesPro Forma Balance Sheet 1,400,000 1,200,000 1,000,000 800,000 600,000 400,000 200,000 0Year 1Year 2Total Assets18Year 3Total LiabilitiesYear 4Net WorthYear 5
APPENDIX: YEAR ONE FINANCIALSYEAR 1 REVENUE FORECASTMonth 1Month 2Month 3Month 4Month 5Month 6Month 7Month 8Month 9Month 10Month 11Month 12Jet Ski Rental1231481481721721973703703702461480Boat Jet Boat Tours 00Bathing Suits15181822222546464631180Water Tight Box15181822222546464631180Beach 73743434992929262370Sun Screen23282832323769696946280Other products39464654546211611611677460PriceJet Ski Rental 99.00 99.00 99.00 99.00 99.00 99.00 99.00 99.00 99.00 99.00 99.00 99.00Boat Rental 499.00 499.00 499.00 499.00 499.00 499.00 499.00 499.00 499.00 499.00 499.00 499.000 0.00 0.00 0.00 0.00 0.00 0.00 0.00 0.00 0.00 0.00 0.00 0.00Jet Boat Tours (New) 75.00 75.00 75.00 75.00 75.00 75.00 75.00 75.00 75.00 75.00 75.00 75.000 0.00 0.00 0.00 0.00 0.00 0.00 0.00 0.00 0.00 0.00 0.00 0.00Bathing Suits 29.99 29.99 29.99 29.99 29.99 29.99 29.99 29.99 29.99 29.99 29.99 29.99Water Tight Box 20.00 20.00 20.00 20.00 20.00 20.00 20.00 20.00 20.00 20.00 20.00 20.00Beach Towel/Shoes 19.99 19.99 19.99 19.99 19.99 19.99 19.99 19.99 19.99 19.99 19.99 19.99Hats/T-Shirts 11.49 11.49 11.49 11.49 11.49 11.49 11.49 11.49 11.49 11.49 11.49 11.49Sun Screen 9.99 9.99 9.99 9.99 9.99 9.99 9.99 9.99 9.99 9.99 9.99 9.99Other products 4.00 4.00 4.00 4.00 4.00 4.00 4.00 4.00 4.00 4.00 4.00 4.00Jet Ski Rental 12,197 14,636 14,636 17,076 17,076 19,515 36,590 36,590 36,590 24,394 14,636 0Boat Rental 23,054 27,665 27,665 32,275 32,275 36,886 69,161 69,161 69,161 46,108 27,665 0 0 0 0 0 0 0 0 0 0 0 0 0 9,240 11,088 11,088 12,936 12,936 14,784 27,720 27,720 27,720 18,480 11,088 0 0 0 0 0 0 0 0 0 0 0 0 0Bathing Suits 462 554 554 647 647 739 1,386 1,386 1,386 924 554 0Water Tight Box 308 370 370 431 431 493 924 924 924 616 370 0Beach Towel/Shoes 616 739 739 862 862 985 1,847 1,847 1,847 1,231 739 0Hats/T-Shirts 354 425 425 495 495 566 1,062 1,062 1,062 708 425 0Sun Screen 231 277 277 323 323 369 692 692 692 462 277 0Other products 154 185 185 216 216 246 462 462 462 308 185 0Total Revenue 46,615 55,938 55,938 65,261 65,261 74,584 139,844 139,844 139,844 93,230 55,938 0Jet Ski Rental 19.80 19.80 19.80 19.80 19.80 19.80 19.80 19.80 19.80 19.80 19.80 19.80Boat Rental 99.80 99.80 99.80 99.80 99.80 99.80 99.80 99.80 99.80 99.80 99.80 99.800 0.00 0.00 0.00 0.00 0.00 0.00 0.00 0.00 0.00 0.00 0.00 0.00Jet Boat Tours (New) 7.50 7.50 7.50 7.50 7.50 7.50 7.50 7.50 7.50 7.50 7.50 7.500 0.00 0.00 0.00 0.00 0.00 0.00 0.00 0.00 0.00 0.00 0.00 0.00Bathing Suits 7.50 7.50 7.50 7.50 7.50 7.50 7.50 7.50 7.50 7.50 7.50 7.50Water Tight Box 5.00 5.00 5.00 5.00 5.00 5.00 5.00 5.00 5.00 5.00 5.00 5.00Revenue0Jet Boat Tours (New)0Direct Cost19
YEAR 1 PERSONNEL FORECASTMonth 1Month 2Month 3Month 4Month 5Month 6Month 7Month 8Month 9Month 10Month 11Month 12CEO111111111111Boat Captain111111111111Sales & r Service111111111111Deck/Launch Support111111111111Total Personnel666666666666CEO 6,250 6,250 6,250 6,250 6,250 6,250 6,250 6,250 6,250 6,250 6,250 6,250Boat Captain 5,000 5,000 5,000 5,000 5,000 5,000 5,000 5,000 5,000 5,000 5,000 5,000Sales & Marketing 3,750 3,750 3,750 3,750 3,750 3,750 3,750 3,750 3,750 3,750 3,750 3,750 0 0 0 0 0 0 0 0 0 0 0 0Customer Service 2,917 2,917 2,917 2,917 2,917 2,917 2,917 2,917 2,917 2,917 2,917 2,917Deck/Launch Support 2,500 2,500 2,500 2,500 2,500 2,500 2,500 2,500 2,500 2,500 2,500 2,500CEO 6,250 6,250 6,250 6,250 6,250 6,250 6,250 6,250 6,250 6,250 6,250 6,250Boat Captain 5,000 5,000 5,000 5,000 5,000 5,000 5,000 5,000 5,000 5,000 5,000 5,000Sales & Marketing 7,500 7,500 7,500 7,500 7,500 7,500 7,500 7,500 7,500 7,500 7,500 7,500 0 0 0 0 0 0 0 0 0 0 0 0Customer Service 2,917 2,917 2,917 2,917 2,917 2,917 2,917 2,917 2,917 2,917 2,917 2,917Deck/Launch Support 2,500 2,500 2,500 2,500 2,500 2,500 2,500 2,500 2,500 2,500 2,500 2,500Total Payroll 24,167 24,167 24,167 24,167 24,167 24,167 24,167 24,167 24,167 24,167 24,167 24,167Management StaffManagement SalariesBookkeeperManagement StaffBookkeeper20
YEAR 1 INCOME STATEMENTMonth 1Month 2Month 3Month 4Month 5Month 6Month 7Month 8Month 9Month 10Month 11Month 12Revenue 46,615 55,938 55,938 65,261 65,261 74,584 139,844 139,844 139,844 93,230 55,938 0Subtot
logistics, insurance, management as well as the financing of the day to day operations of a business of this type. The founder projects needing a working capital sum of 100K for his venture with repayment of this sum coming from profits made through the website. Marketing for EPlace Solutions will