Transcription
11Survival Rates Following TransplantationSurvival Rates FollowingTransplantation- 104 -
This chapter shows graft survival rates over time for kidney, pancreas, and corneal transplants, andpatient survival estimates for kidney, pancreas, cardiothoracic, liver, and intestinal transplants,performed in the UK. Separate estimates are presented for adult and paediatric patients (usingorgan specific age definitions) and for transplants from donors after brain death and donors aftercirculatory death.In all cases, the Kaplan-Meier estimate of the survivor function was used to provide the survival rateand groups (years) were compared using the log-rank test. The analyses do not take account of riskfactors which may change over time. Graft survival is defined as time from transplant to graft failure,censoring for death with a functioning graft and grafts still functioning at time of analysis. Patientsurvival is defined as time from transplant to patient death, censoring for patients still alive at time ofanalysis. Both analyses consider only first transplants.- 105 -
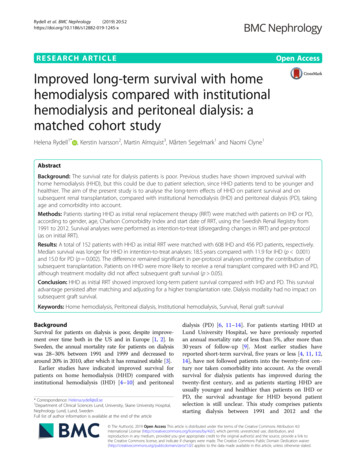
11.111.1.1Kidney graft and patient survivalAdult kidney recipients - donor after brain death (DBD)Figure 11.1 shows long-term graft survival in adult ( 18 years) recipients for first kidney only transplant from donors after brain death. Table 11.1shows the graft survival estimates and confidence intervals for one, two, five and ten years post-transplant. There have been significantimprovements in one and two years survival over the time periods shown, (p 0.01 and p 0.03, respectively). Table 11.2 shows the patient survivalestimates and confidence intervals for one, two, five and ten years post-transplant. There were no statistically significant changes in patient survivalover time (p 0.2).% Graft survivalFigure 11.1 Long-term graft survival after first adult kidneyonly transplant from donors after brain death,1 January 2006 – 31 December 2018Year of transplantTable 11.1Graft survival after first adult kidney only transplant from a DBDYear oftransplantNo. at riskon day 973% Graft survival (95% confidence interval)One yearTwo yearFive yearTen e 11.2Patient survival after first adult kidney only transplant from a DBDYear oftransplantNo. at riskon day 974(72-76)% Patient survival (95% confidence interval)One yearTwo yearFive yearTen year(Number at risk on day 0)Years since transplant- 106 (94-95)(93-95)899088(88-91)(88-91)(87-90)78(76-80)
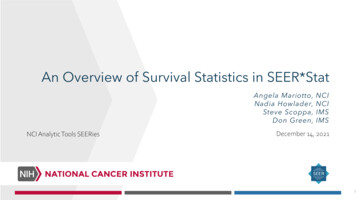
11.1.2 Adult kidney recipients - donor after circulatory death (DCD)Long-term graft survival in adult recipients for kidney transplants from donors after circulatory death is shown in Figure 11.2. Table 11.3 shows thegraft survival estimates and confidence intervals for one, two, five and ten years post-transplant. There has been significant variation in one yearsurvival over the time periods shown, p 0.005. Table 11.4 shows the patient survival estimates and confidence intervals for each time periodanalysed. There was a statistically significant increase in patient survival over time at one year post-transplant (p 0.005).% Graft survivalFigure 11.2 Long-term graft survival after first adult kidneyonly transplant from donors after circulatorydeath, 1 January 2006 – 31 December 2018Table 11.3Graft survival after first adult kidney only transplant from a DCDYear oftransplantNo. at riskon day 99% Graft survival (95% confidence interval)One yearTwo yearFive yearTen e 11.4Patient survival after first adult kidney only transplant from a DCDYear oftransplantNo. at riskon day 01(73-79)% Patient survival (95% confidence interval)One yearTwo yearFive yearTen yearYear of transplant(Number at risk on day 0)Years since transplant- 107 (92-94)(93-95)888686(86-90)(84-87)(84-88)76(73-79)
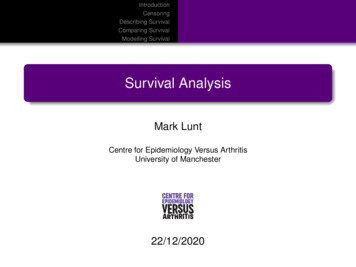
11.1.3 Adult kidney recipients - living donorLong-term graft survival in adult recipients for living donor kidney transplants in the UK is shown in Figure 11.3. Table 11.5 shows graft survivalestimates and confidence intervals for each time period analysed. There has been a significant improvement in one year survival over the timeperiods shown, p 0.0001. Table 11.6 shows the patient survival estimates and confidence intervals for one, two, five and ten years post-transplant.There were no statistically significant changes in patient survival over time (p 0.3).% Graft survivalFigure 11.3 Long-term graft survival after first adult living donorkidney only transplant in the UK,1 January 2006 – 31 December 2018Table 11.5Graft survival after first adult living donor kidney transplantYear oftransplantNo. at riskon day 522% Graft survival (95% confidence interval)One yearTwo yearFive yearTen 96)(95-96)(95-97)919292(90-92)(91-93)(90-93)Table 11.6Patient survival after first adult living donor kidney transplantYear oftransplantNo. at riskon day 52482(80-84)% Patient survival (95% confidence interval)One yearTwo yearFive yearTen yearYear of transplant(Number at risk on day 0)Years since transplant- 108 )
11.1.4 Paediatric kidney recipients - donor after brain death (DBD)Figure 11.4 shows long-term graft survival in paediatric ( 18 years) recipients for first kidney only transplants from donors after brain death. Graftsurvival estimates and confidence intervals are shown for each time period analysed in Table 11.7. There were no statistically significant changesin graft survival over time (p 0.4). Table 11.8 shows the patient survival estimates and confidence intervals for one, two, five and ten years posttransplant. There were no statistically significant changes in patient survival over time (p 0.4). There were insufficient paediatric recipients of firstkidney only transplants from donors after circulatory death to permit reliable analysis.% Graft survivalFigure 11.4 Long-term graft survival after first paediatric kidneyonly transplant from donors after brain death,1 January 2006 – 31 December 2018Table 11.7Graft survival after first paediatric kidney only transplant from a DBDYear oftransplantNo. at riskon day 02006-20082009-20112012-20142015-2018187181137182% Graft survival (95% confidence interval)One yearTwo yearFive yearTen 77)Table 11.8Patient survival after first paediatric kidney only transplant from a DBDYear oftransplantNo. at riskon day 02006-20082009-20112012-20142015-2018188181137182% Patient survival (95% confidence interval)One yearTwo yearFive yearTen yearYear of transplant(Number at risk on day 0)Years since transplant- 109 -99)
11.1.5 Paediatric kidney recipients - living donorLong-term graft survival in paediatric recipients for living donor kidney transplants in the UK is shown in Figure 11.5. Table 11.9 shows graftsurvival estimates and confidence intervals for each time period analysed. There has been a significant change in five year survival over the timeperiods shown, p 0.004. Table 11.10 shows the patient survival estimates and confidence intervals for one, two, five and ten years post-transplant.There were no statistically significant changes in patient survival over time (p 0.6).% Graft survivalFigure 11.5 Long-term graft survival after first paediatric livingdonor kidney only transplant in the UK,1 January 2006 – 31 December 2018Year of transplant(Number at risk on day 0)Table 11.9Graft survival after first paediatric living donor kidney transplantYear oftransplantNo. at riskon day 02006-20082009-20112012-20142015-2018157184198256% Graft survival (95% confidence interval)One yearTwo yearFive yearTen le 11.10Patient survival after first paediatric living donor kidney transplantYear oftransplantNo. at riskon day ears since transplant- 110 -(76-88)% Patient survival (95% confidence interval)One yearTwo yearFive yearTen 00)97(93-99)
11.2Pancreas graft and patient survival11.2.1 Simultaneous kidney/pancreas transplants - donor after brain death (DBD)Figure 11.6 shows long-term graft survival in recipients receiving their first simultaneous kidney/pancreas (SPK) transplant performed from donorsafter brain death. Graft and patient survival estimates and confidence intervals are shown at one, two, five and ten years post-transplant in Table11.11 and Table 11.12 respectively. Results relate to adults only as there are no paediatric pancreas transplant recipients. There has been aborderline significant change in two year survival over the time periods shown, p 0.09. Differences in patient survival are not significant over time(p 0.2).Long-term graft survival after first SPK transplantfrom donors after brain death,1 January 2006 – 31 December 2018% Graft survivalFigure 11.6Table 11.11Graft survival after first SPK transplant from a DBDYear oftransplantNo. at riskon day 02006-20082009-20112012-20142015-2018432371389460% Graft survival (95% confidence interval)One yearTwo yearFive yearTen 88)(76-84)(82-89)787783(74-82)(72-81)(79-86)Table 11.12Patient survival after first SPK transplant from a DBDYear oftransplantNo. at riskon day 0(65-74)% Patient survival (95% confidence interval)One yearTwo yearFive yearTen yearYear of transplant(Number at risk on day 0)Years since transplant- 111 (90-95)(93-97)908788(87-93)(83-90)(84-91)75(70-79)
11.2.2 Simultaneous kidney/pancreas transplants - donor after circulatory death (DCD)The majority of simultaneous kidney/pancreas (SPK) transplants from a DCD have been performed since 1 January 2007, so there are insufficientdata available to analyse long-term survival. Figure 11.7 shows pancreas graft survival in recipients receiving their first SPK transplant performedfrom donors after circulatory death. Graft and patient survival estimates and confidence intervals are shown at one, two and three years in Table11.13 and Table 11.14 respectively. Results are for adult patients only.Pancreas graft survival after first SPK transplantfrom donors after circulatory death,1 January 2012 – 31 December 2018% Graft survivalFigure 11.7Table 11.13Graft survival after first SPK transplant from a DCDYear oftransplantNo. at riskon day 02012-20142015-2018117178% Graft survival (95% confidence interval)One yearTwo yearThree year8590(77-90)(85-94)81(73-87)Table 11.14Patient survival after first SPK transplant from a DCDYear oftransplantNo. at riskon day 02012-20142015-2018117178Year of transplant(Number at risk on day 0)Years since transplant- 112 -79(70-85)% Patient survival (95% confidence interval)One yearTwo yearThree year9999(94-100)(95-100)98(93-100)96(90-99)
11.2.3 Pancreas only transplants - donor after brain death (DBD)Figure 11.8 shows long-term graft survival in recipients receiving their first pancreas only transplant performed from donors after brain death. Graftand patient survival estimates and confidence intervals are shown at one, two, five and ten years in Table 11.15 and Table 11.16 respectively.Results are for adult patients only. There have been no significant changes in graft survival over time (p 0.6). There were no statistically significantchanges in patient survival over time (p 0.3).Long-term graft survival after pancreas onlytransplant from donors after brain death,1 January 2006 – 31 December 2018% Graft survivalFigure 11.8Table 11.15Graft survival after first pancreas only transplant from a DBDYear oftransplantNo. at riskon day 02006-20082009-20112012-20142015-201874625536% Graft survival (95% confidence interval)One yearTwo yearFive yearTen e 11.16Patient survival after first pancreas only transplant from a DBDYear oftransplantNo. at riskon day 6)% Patient survival (95% confidence interval)One yearTwo yearFive yearTen yearYear of transplant(Number at risk on day 0)Years since transplant- 113 80)
11.2.4 Pancreas only transplants - donor after circulatory death (DCD)Figure 11.9 shows pancreas graft survival in recipients receiving their first pancreas only transplant performed from donors after circulatory death.Graft and patient survival estimates and confidence intervals are shown at one, two and three years in Table 11.17 and Table 11.18 respectively.Results are for adult patients only.Pancreas graft survival after pancreas only transplantfrom donors after circulatory death,1 January 2012 – 31 December 2018% Graft survivalFigure 11.9Table 11.17Graft survival after first pancreas only transplant from a DCDYear oftransplantNo. at riskon day 02012-20142015-2018159% Graft survival (95% confidence interval)One yearTwo yearThree year8789(56-96)(43-98)63(32-83)55Table 11.18Patient survival after first pancreas only transplant from a DCDYear oftransplantNo. at riskon day 02012-20142015-2018159Year of transplant(Number at risk on day 0)Years since transplant- 114 -(26-77)% Patient survival (95% confidence interval)One yearTwo yearThree year93100(61-99)(-)93(61-99)78(46-92)
11.3Cardiothoracic patient survival11.3.1 Adult heart recipients – donors after brain death (DBD)Long-term patient survival for adult ( 16 years) recipients after first heart only transplant performed from donors after brain death is shown in Figure11.10. Super-urgent, urgent, and non-urgent patients are included. Table 11.19 shows the patient survival estimates and confidence intervals forone, two, five and ten years post-transplant for each transplant era. There were no statistically significant differences in patient survival over time(p 0.1).% Patient survivalFigure 11.10 Long-term patient survival after first adult heart onlytransplant from donors after brain death,1 January 2006 – 31 December 2018Table 11.19Patient survival after first adult heart only transplant from a DBDYear oftransplantNo. at riskon day ear of transplant(Number at risk on day 0)Years since transplant- 115 -% Patient survival (95% confidence interval)One yearTwo yearFive yearTen 72)
11.3.2 Adult heart-lung block recipients – donors after brain death (DBD)Patient survival for adult recipients after first heart-lung block transplant from donors after brain death is shown in Figure 11.11. Patient survivalestimates and confidence intervals for each time period analysed are shown in Table 11.20. There is some variation between survival rates acrosstransplant eras, however these statistics are based on small numbers and are not statistically significantly different (p 0.2).Long-term patient survival after first adult heart-lungblock transplant from donors after brain death,1 January 2006 – 31 December 2018Table 11.20Patient survival after first adult heart-lung block transplant from a DBDYear oftransplantNo. at riskon day 02006-20112012-20182532% Patient survivalFigure 11.11Year of transplant(Number at risk on day 0)Years since transplant- 116 -% Patient survival (95% confidence interval)One yearTwo yearFive yearTen )(36-72)60(38-76)
11.3.3 Adult lung recipients - donors after brain death (DBD)Patient survival for adult recipients after first lung only transplant from donors after brain death is shown in Figure 11.12, with survival estimates andconfidence intervals shown in Table 11.21. Super-urgent, urgent, and non-urgent patients are included. There were no statistically significantdifferences in patient survival over time (p 0.5).% Patient survivalFigure 11.12 Long-term patient survival after first adult lung onlytransplant from donors after brain death,1 January 2006 – 31 December 2018Table 11.21Patient survival after first adult lung only transplant from a DBDYear oftransplantNo. at riskon day ear of transplant(Number at risk on day 0)Years since transplant- 117 -% Patient survival (95% confidence interval)One yearTwo yearFive yearTen 44)
11.3.4 Adult lung recipients - donors after circulatory death (DCD)The majority of lung transplants from a DCD have been performed since 1 January 2007, so there are insufficient data available to analyse longterm patient survival. Patient survival for adult recipients after first lung only transplant from donors after circulatory death is shown in Figure 11.13,with survival estimates and confidence intervals shown in Table 11.22. Super-urgent, urgent, and non-urgent patients are included.Figure 11.13 Patient survival after first adult lung only transplantfrom donors after circulatory death,1 January 2012 – 31 December 2018Patient survival after first adult lung only transplant from a DCDYear oftransplantNo. at riskon day 02012-20142015-201899139% Patient survivalTable 11.22Year of transplant(Number at risk on day 0)Years since transplant- 118 -% Patient survival (95% confidence interval)One yearTwo yearThree year7183(61-79)(76-89)62(51-70)56(45-65)
11.3.5 Paediatric heart recipients – donors after brain death (DBD)Long-term patient survival for paediatric recipients after first heart only transplant from donors after brain death is shown in Figure 11.14. Bothurgent and non-urgent patients are included. Table 11.23 shows the patient survival estimates and confidence intervals for one, two, five, and tenyears post-transplant. There have been statistically significant variations in one, two, and five year survival over the time period (p 0.03, p 0.02,and p 0.05 respectively). The number of heart-lung transplant recipients was too small for analysis.% Patient survivalFigure 11.14 Long-term patient survival after first paediatric heartonly transplant from donors after brain death,1 January 2006 – 31 December 2018Table 11.23Patient survival after first paediatric heart only transplant from a DBDYear oftransplantNo. at riskon day r of transplant(Number at risk on day 0)Years since transplant- 119 -% Patient survival (95% confidence interval)One yearTwo yearFive yearTen -91)
11.3.6 Paediatric lung recipients - donors after brain death (DBD)Long-term patient survival for paediatric recipients after first lung only transplant from donors after brain death is shown in Figure 11.15. Urgentand non-urgent patients are included. Table 11.24 shows the patient survival estimates and confidence intervals for one, two, five, and ten yearspost-transplant. There were no statistically significant differences in patient survival over time (p 0.2).% Patient survivalFigure 11.15 Long-term patient survival after first paediatric lungonly transplant from donors after brain death,1 January 2006 – 31 December 2018Table 11.24Patient survival after first paediatric lung only transplant from a DBDYear oftransplantNo. at riskon day 02006-20082009-20112012-20142015-201818161323Year of transplant(Number at risk on day 0)Years since transplant- 120 -% Patient survival (95% confidence interval)One yearTwo yearFive yearTen )(59-97)(-)728190(46-87)(52-94)(47-99)44(22-65)
11.4Liver patient survival11.4.1 Adult liver recipients - donor after brain death (DBD)Long-term patient survival for adult ( 17 years) recipients after first elective NHS Group 1 liver only transplants from donors after brain death isshown in Figure 11.16. Table 11.25 shows patient survival estimates at one, two, five, and ten years post-transplant. There have been significantimprovements in one, two and five year patient survival, p 0.05 in each case, over the time periods analysed. Whole liver transplants are includedas well as reduced and split liver transplants.% Patient survivalFigure 11.16 Long-term patient survival after first elective adultliver only transplant from donors after brain death,1 January 2006 – 31 December 2018Table 11.25Patient survival after first elective adult NHS Group 1 liver only transplantfrom donors after brain death, 1 January 2006 to 31 December 2018Year oftransplantNo. at riskon day 012Year of transplant(Number at risk on day 0)Years since transplant- 121 -% Patient survival (95% confidence interval)One yearTwo yearFive yearTen 69)
11.4.2 Adult liver recipients - donor after circulatory death (DCD)Patient survival for adult ( 17 years) recipients after first elective NHS Group 1 liver only transplants from donors after circulatory death is shown inFigure 11.17. Due to small numbers prior to 2006 it is not possible to estimate long term patient survival. Table 11.26 shows patient survivalestimates at one, two and five years post-transplant.Figure 11.17 Long-term patient survival after first elective adultliver only transplant from donors after circulatorydeath, 1 January 2009 – 31 December 2018% Patient survivalTable 11.26Patient survival after first elective adult NHS Group 1 liver only transplantfrom donors after circulatory death, 1 January 2006 to 31 December 2018Year oftransplantNo. at riskon day 02009-20112012-20142015-2018291442755Year of transplant(Number at risk on day 0)Years since transplant- 122 -% Patient survival (95% confidence interval)One yearTwo yearFive 484(68-78)(80-87)
11.4.3 Paediatric liver recipients - donor after brain death (DBD)Figure 11.18 and Table 11.27 show long-term patient survival estimates for first elective liver only transplants from donors after brain death inpaediatric ( 17 years) recipients. There have been no statistically significant changes in one, two or five year patient survival over the time periodanalysed (p 0.2). The number of paediatric transplants from donors after circulatory death was too small to estimate meaningful patient survival.% Patient survivalFigure 11.18 Long-term patient survival after first electivepaediatric liver only transplant from donors afterbrain death, 1 January 2006 – 31 December 2018Table 11.27Patient survival after first elective paediatric liver only transplantfrom donors after brain death, 1 January 2006 to 31 December 2018Year oftransplantNo. at riskon day ear of transplant(Number at risk on day 0)Years since transplant- 123 -% Patient survival (95% confidence interval)One yearTwo yearFive yearTen 89)
11.5Intestinal patient survivalFigure 11.19 and Table 11.28 show patient survival estimates for recipients receiving their first intestinal transplant, by recipient age group (adultsaged 18 years) and transplant era.Figure 11.19 Patient survival after first intestinal graft in the UK,1 January 2011 – 31 December 2018Table 11.28Patient survival after first intestinal transplant in the UK,1 January 2011 - 31 December 2018Recipientage groupNo. at riskon day 0% Patient 2015-2018Recipient age group(Number at risk on day 0)Years since transplant- 124 -% Patient survival (95% confidence interval)One yearTwo yearThree 75(69-98)(46-90)74(51-87)65(42-81)
11.6Corneal graft survival11.6.1 Cornea grafts for keratoconusFigure 11.20 shows graft survival estimates for first corneal transplant for keratoconus (KC) for grafts in 2006-2008, 2009-2011, 2012-2014 and2015-2018. Graft survival estimates and confidence intervals are shown by transplant year at one, two and five years in Table 11.29.Table 11.29Graft survival after first corneal graft for KC in the UKYear oftransplantNo. at riskon day 510- 125 -% Graft survival (95% confidence interval)One yearTwo yearFive 95)(94-96)(95-97)909291(88-92)(90-94)(89-93)
11.6.2 Cornea grafts for Fuchs endothelial dystrophyFigure 11.21 shows graft survival estimates for first corneal transplant for Fuchs endothelial dystrophy (FED) for grafts in 2006-2008, 2009-2011,2012-2014 and 2015-2018. Graft survival estimates and confidence intervals are shown by transplant year at one, two and five years in Table11.30.Table 11.30Graft survival after first corneal graft for FED in the UKYear oftransplantNo. at riskon day 55- 126 -% Graft survival (95% confidence interval)One yearTwo yearFive 89)(84-88)(86-89)777879(74-80)(75-80)(76-81)
11.6.3 Cornea grafts for pseudophakic bullous keratopathyFigure 11.22 shows graft survival estimates for first corneal transplant for pseudophakic bullous keratopathy (PBK) for grafts in 2006-2008, 20092011, 2012-2014 and 2015-2018. Graft survival estimates and confidence intervals are shown by transplant year at one, two and five years in Table11.31.Table 11.31 Graft survival after first corneal graft for PBK in the UKYear oftransplantNo. at riskon day 72- 127 -% Graft survival (95% confidence interval)One yearTwo yearFive 80)(76-81)(79-83)545759(49-58)(53-61)(55-63)
Long-term graft survival in adult recipients for kidney transplants from donors after circulatory death is shown in Figure 11.2. Table 11.3 shows the graft survival estimates and confidence intervals for one, two, five and ten years post-transplant. There has been significant variation in one year survival over the time periods shown, p 0.005.
![[ST] Survival Analysis - Stata](/img/33/st.jpg)