Transcription
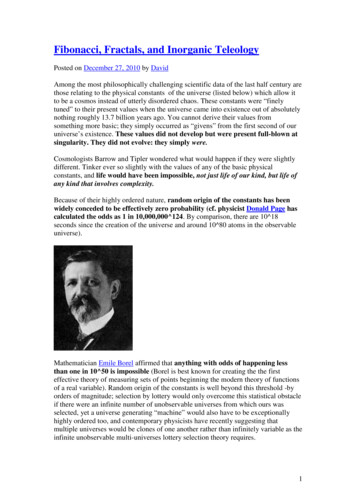
Getting Started with Fibonacci RetracementsByRobert C. JoinerThis is a quick guide to using Fibonacci Retracements for day trading gap stocks. Athorough treatment of the subject would require an entire book. So, my intent is not tocover every scenario and the dozens of uses I find for this tool. Rather, it is meant to getyou started.Leonardo Pisano Fibonacci was an Italian mathematician who lived in the 12th century.The number sequence that bears his name was actually used by Indian mathematicians asearly as the 6th century. But, Fibonacci was the one who imported the idea to the Westand used it in his writings to explain various occurrences in the natural world. FibonacciRetracements are chart tools based upon this sequential order. They are usually found asa drawing tool on most chart software programs.In this “Getting Started” guide”, I will cover (1) how to draw Fibonacci Retracements, (2)when to redraw the lines, and (3) how to use them in your trading. You will find that Iuse Fibonacci extensively in my trading. It is not the only indicator I look at. So, let meoffer a word of warning. Some traders are looking for one tool that will make tradingeasy. In their search for the “Holy Grail” of trading, they want to find something that iseasy and works in every situation. But that is not the nature of trading. Fibonacci linesare not a simple tool by which you draw a line on a chart and state “every time it crossesthis line then I’ll buy the stock”. It doesn’t work that way. As with most technicalindicators, they are most powerful when used in conjunction with other indicators thatmeasure different things. What makes Fibonacci useful is the fact that it measures thingsnot measured by other indicators. It has nothing to do with RSI and Stochastics. Yet, itis very powerful when used in conjunction with these other indicators.In one sense, Fibonacci Retracement lines are just lines on a chart, representing possiblelevels of support and resistance. Yet, it is uncanny how often stocks move in concertwith these lines.By nature, the gap stocks are some of the most profitable and volatile stocks that you willtrade each day. The Fibonacci lines are a means of lessening that risk. By using theFibonacci tool, we are not trying to capture the highest or lowest point of the day as our
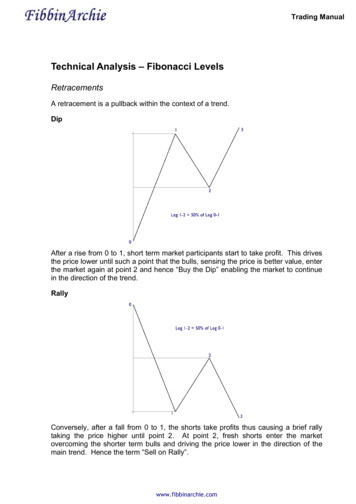
entry. That is risky and has a low probability of success. However, using the Fibonaccitool as outlined in this document, you will discover a more conservative entry point andtherefore a trade that has a higher probability of success.After reading this guide, you should be able to use the Fibonacci Retracement tool inyour own trading. You can begin by reviewing your trades each day in the light ofFibonacci. Draw the Fibonacci lines on your charts and see if it adds clarity to yourtrading. Drawing the lines is the simple part. Knowing how to interpret the movement ofprice, as it meets these lines, takes experience. You have to look at a lot of charts. Butthis guide will help you get started.(1) How to draw Fibonacci Retracements.If a stock gaps down, then you pull the Fibonacci tool from the previous day’s closingprice to the current day’s LOD (low of day).Let’s look at a chart.Chart 1In Chart 1, since CNX gapped down on the morning of June 4, 2010, we started with theprevious day’s closing price (blue arrow) and pulled the Fibonacci tool down to thecurrent day’s LOD. This sets up a series of lines on your chart. Some draw programsshow the 23.6% Fibonacci line and some do not. But this is the most critical line for me.For the charts in this document, I have drawn a long line to show the 23.6% line.
If a stock gaps up, then you pull the Fibonacci tool from the previous day’s closing priceto the current day’s HOD (high of day).Let’s look at a chart.Chart 2In Chart 2, since RTP gapped up on the morning of June 3, 2010, we pull from theprevious day’s close (blue arrow) to the current day’s HOD (green arrow). (Note: theFibonacci %’s vary depending on the direction of your drawing. If you started thedrawing at the HOD and pulled to the previous day’s closing price, then the lines wouldbe the same, but they would be classified differently 23.6% would become 76.4%.)(2) When to redraw the lines.
If either extreme of the drawing is violated, then a new drawing must be made. Oneexample of this is when a gap down stock goes to a new intraday low. The opposite isalso true. If a gap up stock goes to a new intraday high, then the Fibonacci lines have tobe redrawn.Let’s look at an example of a gap down stock that had to be redrawn.Chart 3In Chart 3, each of the first three 10-minute candles falls lower than the previous candle(purple box). It isn’t until after 10:00 that we get the LOD for this stock. So, if you haddrawn Fibonacci lines based on any of the first three candle lows, then you would have toredraw those lines. This brings up an important point. How do you know when you’vereached the LOD? Answer: you’ll know it when price moves above the 23.6% line andis accompanied by the appropriate RSI levels. If price is struggling at your previouslydrawn 23% line, then you wouldn’t be entering the trade anyway. So, you wait, redrawthe lines if necessary, and enter the trade when the perfect combination of RSI andFibonacci exits.
The other instance in which the Fibonacci lines must be redrawn: when the price of astock moves past its previous day’s closing price. So, for example, if a gap down stockretraces 100% of its gap and “fills the gap”, and then subsequently goes higher so that itscurrent day’s price is higher than the previous day’s closing price, then the lines must beredrawn.Let’s look at an example of a gap down stock that did this.Chart 4In Chart 4, AIG “filled the gap” when it hit the previous day’s closing price of 35.41. Ifyou played the gap down reversal as a long trade, then this is a time to be cautious sincemany gap fills will stall or reverse at this point. But AIG continued to go higher andviolated the previous Fibonacci drawing that was based on the previous day’s closingprice. (The purple box shows where the previous day’s closing price was violated.) So,the Fibonacci had to redrawn. Chart 4 shows the revised Fibonacci drawing. For a gapdown stock such as the one in Chart 4, I pull from the intraday low to the intraday high.
That gives me a new 23.6% line at 35.53. You can see how price bounced off the top lineof the Bollinger Band, RSI weakened, and you have a perfect new short set-up based onthat 23.6% Fibonacci line.When a gap up stock fills the gap, then the Fibonacci must be redrawn by pulling fromthe HOD and ending at the new LOD.(3) How to use them in your trading.As I often say, the Fibonacci lines are just lines. The line is not important. What isimportant is how price moves in relation to that line. There are three things that can helpyou understand how price will be affected once it touches a Fibonacci line. They are:( a ) the context of the larger market (is the market going up or down?), ( b ) the size,color, and movement of the candles as they touch the Fibonacci line, and ( c ) the strength(angle and measurement) of RSI and Stochastics on the 5 and 10-minute charts.As I said earlier, it is not a simple matter of just drawing a line on a chart. You have tolearn how to interpret the movement of price as it touches these lines. You learn how todo this by looking at a lot of charts. But let’s look at three charts as examples.In our first example, we look at the gap up of DCTH.Chart 5Chart 5 shows the standard 23.6% Fibonacci Retracement reversal. It is most often seenwith gap downs, but you will also see it in the gap ups, as shown here with DCTH. Youcan see how price fails to get back to the 23.6% line. As RSI and Stochastics weaken,
price continues to drop until it finds support at the 76.4% Fibonacci line of 14.67 (notdrawn on this chart).So, a gap up that weakens beneath the 23.6% Fibonacci line becomes a good shortcandidate. A gap down that strengthens above the 23.6% Fibonacci line becomes a goodlong candidate.In our second example, we look at the gap down of BP.Chart 6In Chart 6, we look at a stock that struggled at the 23.6% Fibonacci line. You can seehow price pushed through just a little bit, but look at the other indicators. RSI barely getsto the 50 line while Stochastics are maxed out. While this may be a risky short set-up, itis definitely a warning sign against going long at the Fibonacci line.In our third example, we look at the gap down of TCK.
Chart 7In Chart 7, we see how price met double-lined resistance. We see price resisting the midline of the Bollinger Band and then falling below the 61.8% Fibonacci line. This 61.8%Fib line is often a line of resistance for stocks that have recovered from their gap down especially if the market is showing weakness at the same time.I hope this Quick Guide will help you get started using Fibonacci Retracements in yourown trading. It takes time and study to become comfortable using this tool. So, asalways, invest in plenty of study time before you try to use this tool with live trades.This document 2010 by Robert C. Joiner. Distribution of this document to persons notmembers of MHT is forbidden. Thank you for respecting this request.
Getting Started with Fibonacci Retracements By Robert C. Joiner This is a quick guide to using Fibonacci Retracements for day trading gap stocks. A thorough treatment of the subject would require an entire book. So, my intent is not to cover every scenario and the dozens of uses I fi


