Transcription
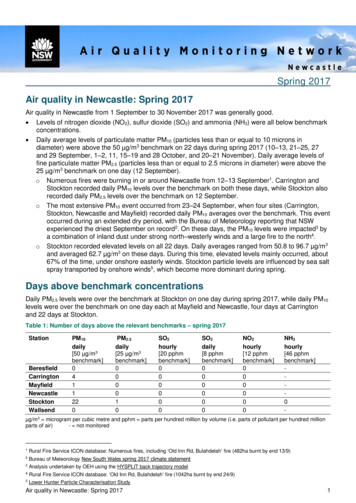
Spring 2017Air quality in Newcastle: Spring 2017Air quality in Newcastle from 1 September to 30 November 2017 was generally good. Levels of nitrogen dioxide (NO2), sulfur dioxide (SO2) and ammonia (NH3) were all below benchmarkconcentrations. Daily average levels of particulate matter PM10 (particles less than or equal to 10 microns indiameter) were above the 50 µg/m3 benchmark on 22 days during spring 2017 (10–13, 21–25, 27and 29 September, 1–2, 11, 15–19 and 28 October, and 20–21 November). Daily average levels offine particulate matter PM2.5 (particles less than or equal to 2.5 microns in diameter) were above the25 µg/m3 benchmark on one day (12 September).o Numerous fires were burning in or around Newcastle from 12–13 September1. Carrington andStockton recorded daily PM10 levels over the benchmark on both these days, while Stockton alsorecorded daily PM2.5 levels over the benchmark on 12 September.o The most extensive PM10 event occurred from 23–24 September, when four sites (Carrington,Stockton, Newcastle and Mayfield) recorded daily PM10 averages over the benchmark. This eventoccurred during an extended dry period, with the Bureau of Meteorology reporting that NSWexperienced the driest September on record2. On these days, the PM10 levels were impacted3 bya combination of inland dust under strong north–westerly winds and a large fire to the north4.o Stockton recorded elevated levels on all 22 days. Daily averages ranged from 50.8 to 96.7 µg/m3and averaged 62.7 µg/m3 on these days. During this time, elevated levels mainly occurred, about67% of the time, under onshore easterly winds. Stockton particle levels are influenced by sea saltspray transported by onshore winds5, which become more dominant during spring.Days above benchmark concentrationsDaily PM2.5 levels were over the benchmark at Stockton on one day during spring 2017, while daily PM10levels were over the benchmark on one day each at Mayfield and Newcastle, four days at Carringtonand 22 days at Stockton.Table 1: Number of days above the relevant benchmarks – spring ocktonWallsendPM10daily[50 µg/m3benchmark]0411220PM2.5daily[25 µg/m3benchmark]000010SO2hourly[20 pphmbenchmark]000000SO2daily[8 pphmbenchmark]000000NO2hourly[12 pphmbenchmark]000000NH3hourly[46 pphmbenchmark]0-µg/m3 microgram per cubic metre and pphm parts per hundred million by volume (i.e. parts of pollutant per hundred millionparts of air)- not monitored1Rural Fire Service ICON database: Numerous fires, including ‘Old Inn Rd, Bulahdelah’ fire (482ha burnt by end 13/9)2Bureau of Meteorology New South Wales spring 2017 climate statementAnalysis undertaken by OEH using the HYSPLIT back trajectory model34Rural Fire Service ICON database: ‘Old Inn Rd, Bulahdelah’ fire (1042ha burnt by end 24/9)5Lower Hunter Particle Characterisation StudyAir quality in Newcastle: Spring 20171
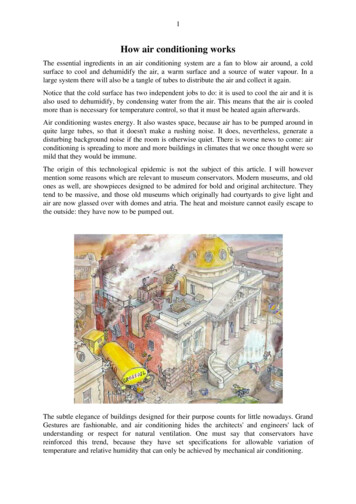
Daily time series plotsOne-hour concentrations of NO2, SO2 and NH3 remained below the benchmarks during spring 2017.Daily average PM2.5 concentrations were above the benchmark on one day during spring 2017 atStockton, due to fires. Daily average PM10 concentrations were above the benchmark on 22 days duringspring 2017, predominantly at Stockton which is influenced by sea salt spray under onshore winds. Highparticle levels occurred during September due to fires and regional dust, during a very dry period.Figure 1: Daily average PM10 during spring 2017Figure 2: Daily average PM 2.5 during spring 2017Figure 3: Daily maximum 1-hr NO2 during spring 2017Figure 4: Daily maximum 1-hr SO2 during spring 2017Figure 5: Daily maximum 1-hr NH3 during spring 2017Air quality in Newcastle: Spring 20172
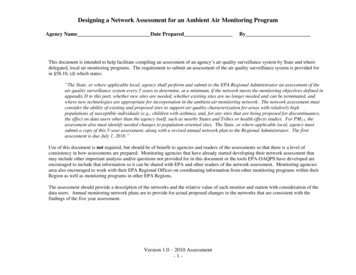
Pollution rosesThe seasonal pollution rose maps6 show that hourly7 PM10 and PM2.5 levels generally remained low duringspring 2017.Figure 6: Hourly PM10 pollution roses for the Newcastle region for spring 2017Figure 7: Hourly PM2.5 pollution roses for the Newcastle region for spring 20176Pollution roses show the wind direction and particle levels at a location. The length of each bar around the circle shows thepercentage of time that the wind blows from a particular direction. The colours along the bars indicate categories of particle levels.7Note: There are no standards for hourly PM10/PM2.5 in the National Environment Protection (Ambient Air Quality) Measure (Air NEPM)Air quality in Newcastle: Spring 20173
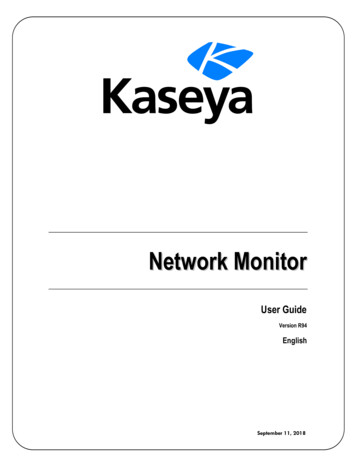
Annual air quality trends in the Newcastle regionA comparison of annual average PM10 and PM2.5 levels shows the trends in particle levels. The nationalbenchmarks for annual average particle levels are 25 µg/m3 for PM10 and 8 µg/m3 for PM2.5, based on acalendar year.Figure 8 shows the PM10 and PM2.5 rolling annual averages, based on the 12-month periods, to the endof spring for 2014 to 2017. This shows that at most sites PM10 particle levels to the end of spring 2017have slightly increased compared to earlier years, due largely to the very dry winter to spring period.Rolling annual averages are not intended to be compared to the annual benchmarks. The rolling annualaverages provide a guide to long-term trends, using the most up to date monitoring data.Figure 8: PM10 and PM2.5 rolling annual averages to the end of spring 2017Seasonal comparisonsThis section compares air quality levels in spring 2017 with previous spring seasons, where data wereavailable. Monitoring at Stockton commenced in October 20128 and at Mayfield and Carrington in August2014. Monitoring of PM2.5 at Newcastle commenced in December 2013.All days were below benchmark concentrations for NO2 and SO2 in spring during the past five years atBeresfield, Newcastle, Stockton and Wallsend and since monitoring began at Carrington and Mayfield.There were also no days above the NH3 assessment criterion at Stockton for the past five spring seasons.Mayfield and Newcastle recorded one day above the PM10 benchmark in spring 2017, Carringtonrecorded four days and Stockton recorded 22 days. Although there is variability across sites, this issimilar overall to spring 2015 but higher than other spring seasons.For PM2.5, Stockton recorded one day over the benchmark, while all other sites remained below thebenchmark. Overall, this is similar to previous years for the spring season, except for spring 2013 wheneight days were recorded over the benchmark in the region.Figure 9: Number of days above the PM10 and PM2.5 benchmarks: spring 2017, 2016, 2015, 2014 and 20138Orica originally undertook Stockton air quality monitoring; from October 2014 it was undertaken by the Office of Environment andHeritage as part of the Newcastle Local Air Quality Monitoring Network.Air quality in Newcastle: Spring 20174
Particle air quality trends in the Newcastle regionFigure 10 and Figure 11 show daily average PM10 during spring 2017, compared to the daily maximumand minimum (i.e. shaded range) of PM10 levels for the spring periods from 2013 to 2016, at Stocktonand Newcastle. These show that daily PM10 levels in the first half of the season were higher on somedays compared to earlier years. These levels coincide with a very dry period with well below averagerainfall in September and to mid-October. This variability may also be partly due to the low number ofyears of historic data available for comparison. PM10 levels in the remainder of the season were in thelower end of the range, when rainfall was above average in late October and average in November.Figure 10: Stockton daily average PM 10 during spring 2017 plotted against the daily maximum andminimum PM10 levels recorded from spring 2013 to 2016Figure 11: Newcastle daily average PM 10 during spring 2017 plotted against the daily maximum andminimum PM10 levels recorded from spring 2013 to 2016Figure 12 and Figure 13 show daily average PM2.5 during spring 2017, compared to the daily maximumand minimum levels (shaded range) from spring 2014 to 2016, at Stockton and Newcastle. These showthat daily PM2.5 levels were higher during the dry first half of the season and lower during the wetter latterpart. This variability may also be partly due to the low number of years of historic data available.Figure 12: Stockton daily average PM 2.5 during spring 2017 plotted against the daily maximum andminimum PM2.5 levels recorded from spring 2014 to 2016Figure 13: Newcastle daily average PM 2.5 during spring 2017 plotted against the daily maximum andminimum PM2.5 levels recorded from spring 2014 to 2016Air quality in Newcastle: Spring 20175
Meteorological summaryRainfall and temperature9The Newcastle region experienced average rainfall overall during spring 2017 compared to long-termrecords. However, there was variability through the season with very much below average rainfall inSeptember, above average in October due to rain periods later in the month and average in November. NSWrecorded its driest September period on record. Spring 2017 recorded up to 50 millimetres more rain thanspring 2016, while drier compared to spring 2015 with up to 100 millimetres less rain.Maximum temperatures in Newcastle were very much above average and minimum temperatures wereabove average during the season.Figure 14: NSW rainfall deciles – spring 2017WindThe winds were variable in the region during spring 2017, which is typical for this transitional season, wherepredominant winds change from north–westerly in winter to south-easterly in summer. Figure 15 shows thespring wind roses for individual sites. At Stockton, for example, north–westerly winds prevailed 17% of thetime and were fresh to strong (above eight metres per second) 2% of the time.Figure 15: Wind rose map10 for the Newcastle region for spring 2017Rainfall and temperature information are from the Bureau of Meteorology New South Wales spring 2017 climate statement andclimate maps (accessed February 2018).10Wind roses show the wind direction and speed at a location. The length of each bar around the circle in these wind roses show thepercentage of time that the wind blows from a particular direction. The colours along the bars indicate the wind speed categories.9Air quality in Newcastle: Spring 20176
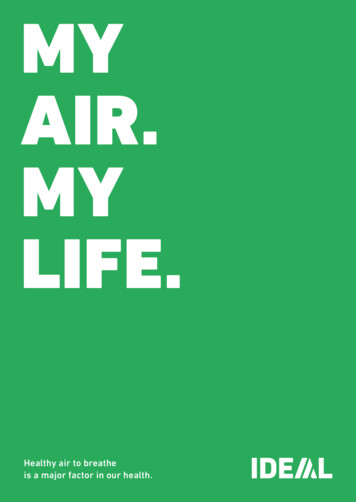
StocktonThe Stockton monitoring site continued to record a higher number of days over the PM10 benchmarkcompared to other sites in the region.In spring 2017, elevated hourly PM10 levels ( 75 µg/m3) occurred 8.6% of the time. The majority of these,approximately 67% of the time, occurred under onshore easterly winds (Figure 12). This indicates thepotential contribution of sea salt, with the Lower Hunter Particle Characterisation Study finding sea saltto be a major contributor of particles at the site.Elevated hourly PM10 levels were from the northwest sector 2.3% of time during the season. Theselevels predominantly occurred 11–13 and 23–25 September, when impacted by regional fires and dust.Figure 16: Stockton spring 2017 pollution rose - proportion of hourly averaged PM 10 levels 75 µg/m3 bywind directionNetwork performanceThe target network performance is at least 95% available data for all parameters. For NO2, SO2 and NH3,due to daily calibrations, the maximum online time that can be attained is 96%.Table 2: Online performance (%) during spring rologyWindhourly92100999910098- not monitoredThe reduced online times were mainly due to:o Carrington PM2.5 – scheduled calibrations (two days) and instrument problems causingintermittent negative data and associated instrument checks (10 days)o Beresfield wind – extensive bird damage (seven days). 2018 State of NSW and Office of Environment and HeritageThe State of NSW and the Office of Environment and Heritage are pleased to allow this material to be reproduced in whole or inpart for educational and non-commercial use, provided the meaning is unchanged and its source, publisher and authorship areacknowledged.Office of Environment and Heritage has compiled this report in good faith, exercising all due care and attention. Norepresentation is made about the accuracy, completeness or suitability of the information in this publication for any particularpurpose. OEH shall not be liable for any damage which may occur to any person or organisation taking action or not on thebasis of this publication. Readers should seek appropriate advice when applying the information to their specific needs.Published by: Office of Environment and Heritage, 59–61 Goulburn Street, Sydney South 1232.Ph: 131 555 Email: info@environment.nsw.gov.au; Web: www.environment.nsw.gov.auISSN 2206-0421 OEH 2018/0157 March 2018Air quality in Newcastle: Spring 20177
Air quality in Newcastle: Spring 2017 2 Daily time series plots One-hour concentrations of NO 2, SO 2 and NH 3 remained below the benchmarks during spring 2017. Daily average PM 2.5 concentrations were above the benchmark on one day during spring 2017 at Stockton, due to fires. Daily averag