Transcription
istrators of NursingandPersonal Care Homes:Education and TrainingUnited States - June - August 1969Statisticscareon thehomenumberadministratorsof nursingandby educationalpersonallevelsattained,degrees and nurses’licensesheld,andformaland informaltrainingin nursinghomeBased on DHEWU.S.DEPARTMENTHealthPublicationOF HEALTH,Public rMd.for(HS1’vT) inistrationStatistics1973WELFARE18
Vital and Health Statistics-SeriesFor sale by the Superintendentof Documents,Price 95 cents domestic12-No. 18U.S. Government Printing Ofhce, Washington,postpaid or 70 cents GPO BookstoreD.C. 20402
NATIONALCENTERTHEODOREFOR HEALTHD. WOOLSEY,STATISTICSDirectorEDWARD B. PERRIN, Ph. D., Deputy DirectorPHILIP S. LAWRENCE, SC.D., Associate DirectorOSWALD K. SAGEN, Ph.D., Assistant Director for Health Statistics DevelopmentWALT R. SIMMONS, LILA., Assistant Director for Research and Scientific DevelopmentJOHN J, HANLON, M.D., Medical AdvisorJAMES E. KELLY, D.D.S., Dental AdvisorEDWARD E. MINTY, ExecutiveOfficerALICE HAYWOOD, ESSTATISTICSA. HOERMANN, DirectorPETER L. HURLEY, Deputy DirectorGRACE K. WHITE, Chief Hospital Discharge Survey BranchG. GLORIA HOLLIS, ChiejHealth Facilities Statistics BrunchHENRY S. MOUNT, Chiej Health Manpower Statistics BranchWILLIAM F. STEWART, ChieJ Family Pkznning Statistics BranchCOOPERATIONOF THE BUREAUOF THE CENSUSUnder the legislation establishing the National Health Survey, the Public Health Service is authorized to use, insofar aspossible, the services or facilities of other Federal, State, orprivate agencies.In accordance with specifications established by the National Center for Health Statistics, the Bureau of the Census,under a contractual arrangement, participated in planning thesurvey and collecting the data.Vitaland HealthDHEWStatistics-SeriesPublicationNo. (HSM)12-No.1873-1703Library of Congress Catalog Card Number72-600215
CONTENTSPage-“” ------ --------Introduction . ”------ . ------ ”---------Highlights -------------------- ---------------------Problem -------General Survey Information ---------.-11------12of AdministratorsEducation and TrainingasRelated to ------------------------------Employment Status ngth of Total Employment as an Admitismator ---------------------Services Performed 81315-----Education and Training of Administratorsas Related to Characteristicsof------- ---------------------the Homes in Which They Work --Bed Size of HomeGeographicRegion ----- ---” --------------Type of Service Provided by Home -------Type of Owership eferences------------------List of Detailed Tables ppendix I. Technical Notes on Methods ---------------------Survey Design -------General Qualifications 55557Appendix II. Definitions of Certain Terms Used in this Report -----------Terms Relating to Administrators ----------------------------------Terms Relating to Homes or Residents assificationofHomes by Type of Service --------59595959Appendix III. Resident Places Survey-3: Forms and Questionnaires -------.------------ ----------------------Introductory Letter ---------------------------------Facility Questionnaire -----------------AdministratorQuestionnaire ---------------------------------------Staff Information and Control Record --------------.---Staff Questionnaire -------List of Selected JobCategories --------------------------------------Current Patient Questionnaire 76970.Ill
SYMBOLSData not available ---------------------------Category not applicable -------------------.Quantity zero ---------------------------Quantity more than Obutless-than 0.05-----Figure doesnot meet standards ofreliabilityorprecision ------------------NOTE: Numbers and percentsadd to totals due to rounding.0.0*in tables may notIv.
ADMINISTRATORS OF NURSING AND PERSONALCARE HOMES: EDUCATION AND TRAININGBernice Gibson Brown, Division of Health ResourcesINTRODUCTIONIn today’s nursing home, the nursing homeadministratorsets the tone, establishes a prohgt-am of quality care, and bears final responsibility for operation of the facility. It is veryimportant,therefore,that his orientation andtraining prepare him to direct and administer aprogram which provides both the “nursing” andthe “home” aspects of patient care.1HighlightsThe median number of years of education forthe estimated 18,390 nursing and personal carehome administratorsin the conterminous UnitedStates, June-August 1969, was 13.1 years. Nearly80 percent of the administratorshad completedat least 12th grade. For 51 percent the highestattained educational level was 1 year or more ofjunior college, nursing school, or college.Slightly more than 71 percent of nursing andpersonal care home administrators held no undergraduate or graduate degree. The associate’s andbachelor’s degrees were the most commonly helddegrees; 28 percent of the administratorsheldone or both of these degrees. The master’sand/or doctor’s degree was held by 4 percent ofthe administrators.A course in nursing home administration hadbeen taken by 35 percent of nursing and personalcare home administrators.The modal number ofcourses taken was one. About 88 percent of thosewho took a course in nursing home administrationStatisticshad completed at least 12th grade. Furthermore,47 percent of those who had attended a course innursing home administrationhad some collegebackground.Other than formal training, some administrators (39 percent) had received on-the-job training and 23 percent had received other trainingor education in nursing home administration.Agood proportion of those who had received onthe- job training or other training or educationin nursing home administrationhad a collegebackground.ProblemThe 1967 amendments to title XIX (Medicaid)of the Social Security Act required all States andother jurisdictions(participating in Medicaid) toestablish programs to license by waiver or fullylicense all nursing home administrators by July 1,1970.Federal guidelines proposed, among otherthings, that by July 1, 1970, each applicant forfull licensure possess a high school diploma orthe equivalent. (Applicants for licensure on orafter January 1, 1975, must have successfullycompleted 2 years of college-levelstudy in anaccredited institution; on or after January 1, 1980,they must hold a bachelor’s degree; and on orafter January 1, 1985, they must hold a master’sdegree.)In addition, applicants for full licensure on orafter July 1, 1970, who had not completed, in anaccredited institution of higher learning, adequate1
academic preparation for nursing home administration must submit evidence of participation inan approved course of study in nursing home administration.In future years a candidate for examination for licensure can submit evidence of 4years of practical experience in nursing homeadministrationor in a related ‘health administration area for each year of required post-highschool education. 2Table A presents the distribution of nursingand personal care home administratorsby combinations of the following levels of knowledge andskill: 12th grade education and above, course innursing home administration,and 4 years or moreof experience as an administrator.It must berecognized that positive responses to the surveyquestions upon which this table is based do notnecessarilymean that an administrator met theeducation, training, or experience requirement asdefined in the proposed legislation. Neverthelessthe available measurements of knowledge and skillmost comparable to those proposed in the legislation have been used to provide information onhow administratorsfared, knowledge and skillwise, prior to enactment of the legislation. Onlyhad fulabout 31 percent of the administratorsfilled the two proposed requirements(i.e., 12thTable A. Percentposed criteriaeach proposedgrade education or the equivalent and completionof a course in nursing home administration)necessary’ for full licensure on or after July 1,1970. Detailed tables 1 and 2 present additionaldata on administratorsby proposed criteria forlicensure.GeneralSurveyInformationDuring June-August 1969, the Division ofHealth Resources Statistics conducted ResidentPlaces Survey-3 (RPS-3) to update the statisticsfrom the 1964 Resident Places Survey-2 ‘II andto show changes which had occurred in the 5year period since 1964 and since the beginningof Medicare. ResidentPlaces Survey-3 was asample survey of nursing and personal care homesin the conterminous United States. Collected inthis survey were data about the sample establishment itself, about the health of a sample of thepatients or residents, about the administratorofthe establishment, and about a sample of the employees. (For further discussion of RPS-3, seeappendix I.)This report, the first of a series basedon thefindings of RPS-3, describes the education andtraining of nursing and personal care home ad-distributionof nursimz and personalcare home administratorsby profor licensureas an administrator,accordingtowhetheror not he eetscriterion:United States,June-August1969[Excludes .41askri and FhtwaiflProposedcriteriaforlicensureas an administratorPercent12th gradeeducationand a hoveYes‘“Yesin nursinghomeadministrationYesNoyears or oreof experienceasan 8.53.717.113.4;YYesYesNo2-Course
ministratorson the basis of information obtainedby questionnaire from the person who was designated as administrator by the owner or operatorof an establishment. The survey was designed sothat one and only one administratorwas designated for each establishment. Assistant administrators were requested to complete a differentquestionnaire and are not included in this report.Since the estimates for RPS-3 are based on asample of administratorsin nursing and personalcare homes rather than all such administrators,they are subject to sampling variability. Tablesof approximate sampling errors are given in appendix I. Definitions of certain terms used in thisreport may be found in appendix II. Also a reviewof the questionnaires and related materials shownin appendix III should be helpful in understandingthe data.“In this report administratorsof nursing andpersonal care homes are described in terms oftheir highest grade completed, undergraduate andgraduate degrees held, Iicensure status as registered nurses and practical or vocational nurses,courses completed in nursing home administration, on-the- job training in nursing home administration, and other education or training receivedin nursing home administration. These data provide a general picture of the levels of knowledgeand skill attained by administrators.The- data on education and training arearrayedby characteristicsof administrators(age, employment status, length of employmentas an administrator,and services performed bythe administrator).The interplay between thesecharacteristicsand education and training is discussed. In addition, the relationshipbetweencharacteristicsof nursing and personal carehomes and the training and education of theiradministratorsis analyzed. More detailed information about administratorsis given in tables1-20, which follow the text of this report.Establishment infomzation.-Toplace the statistics on administratorsin perspective,table Bpresents selected characteristicsof nursing andpersonal care homes. Nursing care homes constituted the majority of the three types of homesand on the average maintained 61 beds as opposedto 40 beds for personal-care-with-nursinghomesand 14 beds for personal care homes. The estimated average size for all types of homes wasabout 49 beds. Approximately 88 percent of nursing and personal care homes had less than 100beds, and the remaining 12 percent had 100 bedsor more.About seven of every nine homes were operated under proprietaryauspices. However, bothnonprofit and government homes were on theaverage larger in size than proprietary homes.The largest proportion of homes were located inthe North Central Region (34 percent) followed bythe South Region (26 percent), Northeast Region(21 percent),and West Region (20 percent).Education and tvakkg.The level ‘of education attained by nursing home administrators isslightly above that of the general population. Basedon 1970 Bureau of the Census data: the mediannumber of school years completed by all persons21 years and older in the United States was 12.2years?2 Based on RPS-3, the median number ofschool years completed by nursing and personalcare home administratorswas 13.1 years.Table C summarizes the data collected onhighest attained educational level for the estimated 18,390 administratorsin the United States,June-August 1969. Slightly more than 20 percenthad less than a 12th grade education, and 29 percent had only a 12th grade education. The highestattained educational level for the remaining 51percent was 1 year or more of nursing school,junior college, or college.Of the 2,380 administratorswho attendednursing school, 1,590 attended for 3 years. However, some administratorsattended junior college or college or by other means prepared themselves for licensure as registered nurses (RN’s),which brought the total number of administratorswho were licensed RN’s to 2,020. Licensed registered nurses represented 49 percent of the 4,140administratorswho were licensed nurses. Theother 51 percent were licensed practical nurses(LPN’s) or licensed vocational nurses (LVN’S).The majorityof administrators(72 percent) did not hold an undergraduate or a graduate degree. However, of the 5,200 administratorswho held a degree, the associate’s degree was thehighest degree held by 50 percent, the bachelor’swas the highest degree held by 36 percent, andthe master’s or doctor’s was the highest degreeheld by 15 percent.3
Table B. Number of nursingsnd. personalcare homes and ean beds, by type ofbed-size,service,ty e of o nership,United States,and geograp- --{ ic region:June-August1969 xcludes Alaska and Hawai HomesCharacteristicAll homes -------Meanbeds18,3904911,580613,7703,0404014Type of serviceNursingPersonalnursingPersonalcare ---------care with-----------care ---------Type of ownershipProprietary----------Nonproff.t ------------Government ------------14,1602,8501,380;;60of these administratorsheld abachelor’s,master’s, ordoctor’sdegree. About llOadministratorsheldtheM.D. or D.O. degree.Although administratorswere requested toindicate their major fields of study in pursuitof undergraduate and graduate degrees, most didnot. However; for those administratorswho indicated amajor field ofst.udyon theundergraduate level, awide cross-sectionofdisciplineswasrepresented,dominated to some extent by thesocial sciences, accounting, business administration, and nursing. On the graduate level amaster’s degree ‘in hospital administrationwastiequently indicated. For doctorates, the majorfields of study frequently included, but were notIimited to,theology, law,andmedicine.distributionTable C. Number and percentof nursingand personalcare home administratorsbyhighestgrade completed:United States,June-August1969, @xeIudes Alaska and Hawai Bed sizeLess than 30 beds ----30-99 beds -----------100-299 beds ---------300 beds or stratorsNumberPercentregionNortheast ------------ or ; Central --------. ---------------West ------------------3,8306,1604,7503,65052Allgrades -------18,390100.0Below 12th grade ------8th grade and below-9th to llth grades---3,8401,7802,06020.912th5,24028.5Nursing school --------1 year --------------2 years -------------3 years-” -------------2,3805502401,59012.93.0Junior college --------1 year --------------2 years asthehighestdegreeheld byagood proportion ofthose administratorswho were licensed nurses (RN’s, LPN’s, orLVN’S). In fact the associate’s degree was thehighest degree held by46percentofthe4,140 administratorswho were licensed nurses, and thebachelor’s degree was the highest degree for5percent of this group. About 48 percent of theadministratorswho were licensed nurses heldno degree. Only a relatively few administratorsin this group held the master’s ordoctor’sdegree.Approximately 3,000 administratorshad attended college4 years or more, and 89 percent4Highest gradecompletedgrade -------------College ---------------1 year --------------2 years -------------3 years -------------4 years -------------5 years or more ------6,2501,0401,4807201,4701,5401?: ;::;:;34.05.68.1i?::8.4
Attained educationalstatus is related tocompletion of a course in nursing home administration and acquisition of on-the-job training orother training or education in nursing home administration. As shown in table D, administratorswho had received formal or informal trainingin nursing home administration were more likelyto have completed at least 12th grade than wereadministratorswho had not received this training. The median number of months for on-thejob training for all administratorswas 12.0months. The duration of this training may haveincluded time spent in a probationary or careerconditional period.Administratorsindicated that other trainingor education in nursing home administration included, but was not limited to, seminars, institutes, workshops, reading, conventions, andhome-study courses.If an administrator-helda degree, the chanceswere greater that he had received training innursing home administrationthan if he did nothold a degree (table E).The relationshipbetween licensureas anFUN,LPN, or LVN and training in nursing homeadministrationis not as marked as the relationship between degree status and training. However,administratorswho received on-the-job trainingTable D. Number and Percentdistributionof administratorsaccordingto type- of trainingor educationin nursingStates,June-August1969@wl.desAlaska and Ekw.iflby highestgradehome administration:Highest gradecompletedAdministratorsType of trainingor educationnursinghome administrationinNumberAllcompleted,Unitedtypes 90100.020.979.1100. O25.974.2CourseNo --------------------------------------11,950Yes 688.411,310100.025.374.77,080100.013.886.2100. O22.377.7100.016.084.0On-the- jobtrainingYes No -----------------Yes . . . . . . .-or education. . . . . . . . . . . ---------. . . . . . . . . . . . . . . . . -----------14,2604,130
TableE.Number and percentof administratorsthn,by degree or li.censurestatus:[ExcludesAlaskaby trainingin nursing home administraUnited States,June-August1969and HawaiflTrainingin nursingadmf.nistrationlDegreeor ntAllstatuses----------------------DegreeDid not holdLicensureNot 21.0status2a degree -------------------Held a degree --------------------------status3as a nurse -----------------as a nurse ---------------------1 administratormay have receivedone ‘o or three typesdegree or cer i.ficate,bachelorfs,z e or more among associatesdegree.SAS an RN, LVN, or LPN.innursing home administration were more likelyto have taken acourse innursing home administration than those who hadnotreceivedthistraining (table F). Detailed tables 3 and 4 presentadditional data on the relationship between attained educational level and training in nursinghome administration.Information onthe Medicare participation bythe sample facilities was obtained in RPS-3.Table G summarizes the educational status of theadministratorsof Medicare-certifiedand noncertified homes, June-August1969. This tableshows that the median years of education were14.8 years for administratorsin Medicare-certifiedhomes and 12.8 years for administratorsinnoncertifiedhomes. In fact, 91 percent of theadministratorsin Medicare-certifiedfacilities6of administratorsof trainin.master Fs,ordoctor had completed at least 12th grade compared with75 percent in noncertified facilities.Futhermore,’46 percent of the administratorsin Medicarecertified homes held a degree, 46 percent hadtaken a course in nursing home administration,50 percent had received on-the-job training innursing home administration,and 30 percenthad receivedother trainingor education innursing home administration.The comparablepercentagesfor training or education of administratorsin noncertified homes are less.Table 5 presents further information on administratorsin Medicare-certifiedand noncertified homes. Also table 1 presents the distribution of these two groups by the proposed criteria for licensing administrators.
Table F. Number and percent distribution of nursing home administratorsby completionof a course in nursing home administration,according to type of training in nursinghome administration:United States, June-August 1969[&cl.desAlaekaandHawaiiAdministratorsType of training in nursingTook a coursehome administrationPercentNumberAll b trainin&No -------------------------------.------------Yes 14,260100.069.330.7--4,130100.049.850.2Other training or educationNo -------Yes --------------------Number and percent of nursing and personal care home administrators,by education or training of administrators and Medicare status of sample homes: UnitedStates. June-Auwst 1969Table tratorsEducation or trainingof edhomesNumberAll administrators--------”-------------- 4Median years of 2012.8PercentPercent completed below 12th grade-----------Percent completed 12th grade and above-------pl rcentheld a degreel------------------------Percent RN, LPN, or LEN----------------------Percent took a course aining25.374.721.920.99!::46.1---- -- -.--Percent received other training or education2-I10neormore among associate’s degreeor certificate,bachelor’s, aster’s,or doctor’sdeg ee.-In nursing home administration.7
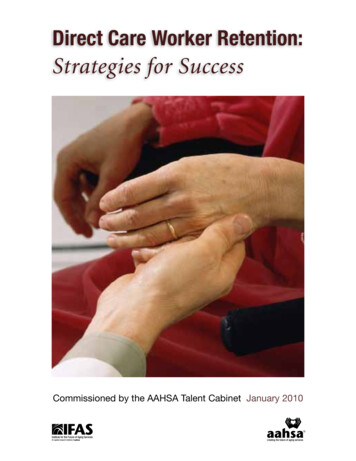
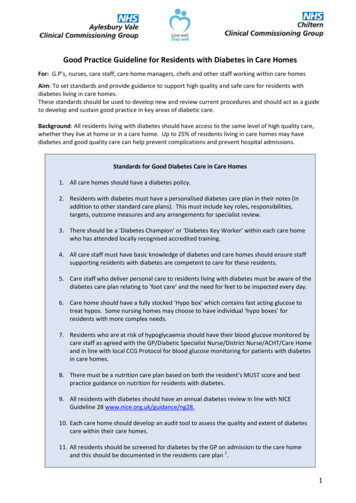
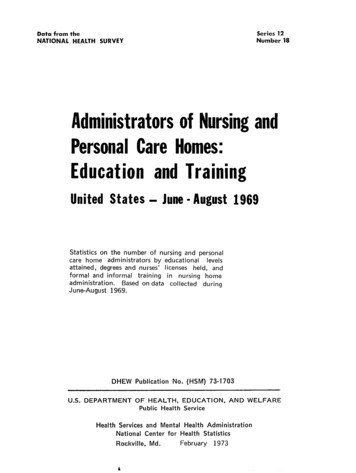
EDUCATIONRELATEDANDTRAININGTO OFAgeThe majority of nursing and personal carehome administratorswere between the ages of45 and 65 (figure 1). Generally, administratorsunder 45 years of age had attained a slightlyhigher educational level than administrators45years and over; table H shows that the medianyears of education for these groups were 14.1and 12.9 years, respectively.Table H also shows that 91 percent of theadministratorsunder 45 years of age had completed at least 12th grade, 11 percent had attended nursing school, and 53 percent had attended college. At the other, extreme, only 75percent of the administrators45 years and overhad completed at least 12th grade, about 14 percent had attended nursing school, and 33 percenthad attended college. Table 5 provides additionaldata to examine the relationship between age andeducation.“The completion of 2 or 3 years of nursingschool occurred often among administrators45years and over. In addition, 24 percent of theadministrators45 years and over were licensedas an RN, LPN, or LVN compared with 20 percent under 45 years of age (table J). Furtherexamination of the data reveals t at 4 years ormore of college were completed more often byadministratorsunder 45 years of age and alsothat undergraduateand graduate degrees weremore common for administratorsof this agegroup.Administratorsunder 45 years of age werelikely to have attended a course in nursing homeadministrationand to have pursued two or moresuch courses.Furthermore,administratorsinthis age group were about equally divided as toon-the-job training experience; about 51 percenthad received dn-the-job training in nursing homeadministration,while 49 percent had not. Administrators45 years of age and over ra&edhigher in median months of this training. However, positive responsesto “other training oreducation in nursing home administration” wereAGE‘ d over11.4Iz!iFiaure 1. Percent distribution of nursina and oersonal care home administrators hy a e.“given as often by administratorsof age (table K).Employmentunder 45 yearsStatusEducational level varies markedly with employment status. Namely, employed nursing andpersonal care home administratorsworking forother employers generally showed a higher educational level than the self -employed adminis trators.For example, 86 percent of employedadministratorshad completed at least 12th gradecompared with 70 percent of the self-employedadministrators.Only 26 percent of the self-employed administratorshad attended college, andonly 9 percent had completed 4 years or more.In comparison, 45 percent of the employed administratorshad attended college and 22 percenthad completed 4 years or more. On the otherhand, about the same percent of self-employedadministrator had attended nursing school ashad their salaried counterparts (table L).This relationship between employment statusand education is not altered when an additionalvariable, age, is introduced. Table 6 shows mat
Table H. Number and percent distribution of nursing and personal care home administrators by highest grade completed and median yearsof education,accordtigto age:UnitedStates, June-August 1969&xoludesAlaskaand HwaiflHighest grade completedAdministratorsBelow 12thgradeCollegeMediany:ysAgeNumber PercentAllages- 18,39Q 100.0Under 45years--4,680 100.0Under 35years------1,550 100.035-44 years-3,130 100.012th8thgradeLess9th2 orgrade1thanllth3andyear4years years?below 12.912.9*4 n arsover--- 13,710 100.045-54 years-5,500 100.04.56.734.33.913.422.614.713.555-64 years-6,110 100.017.717.124.7*8.517.612.912.665 years andover-------2,100 r college.,9
Table J. Number and percent distributions ofnursing and personal care home administrators by degrees and licenses held , according to age: United States, June-August t degree heldIw‘1 All ages------- 18,390 100.0Licenses held kIIII71.714.110.14.277.5 11.011,64,680 100.061.913.118.8.6.2 80.5 10,19.51,550 100.035-44 years---------- 3,130/ 100.059.263.213.013.220.318.17.6 83.4 6.55.5 79.1 11.910.19.2Under 45 years---Under 35 years-------H-45 years andover------------ 13,710 100.045-54 years---------- 5,500 100.055-64 years---------- 6,110 100.065 years and over---- 2,100 *I;.;-&.;I3.5 , 76.5 11.312.313.515.110.310.7“* 77:0 1:::Number and percent distributions of nursing and personal care home administrators by trainingin nursing home administrations accordingto age: United States,June-August1969Table K.@xcl.desAlaskaandHmvaijTraining in nursing home administrationAdministratorsCourse in nursinghome cationAgeYeaIhmber Yescoursesor more,8,390 100.065.012.922.2 61.5 38.5years------- 4,680 100.0-58.716.524.8 49.1 50.963.456.419.115.217.5 48.2 51.828.4 49.5 50.574.91::; 73.067.111.621.3 65,8 34.214.2 78 921 171:09:819:2 71:4 28:618:0 78;521:;76.96.316.8 77.1 22,911.9 ‘ B5.114.9All agea-12.0Under 45Under 35 years- 1,550 100.035-44 years---- 3,130 100.045 years andover-------100.0 45-54 years---- w55-64 years---- 6,110.65 years andover------ 2,100 100.0109.6 73.61 26.425.127.0T.
TableL. Number and percentdistributionof nursingand Personalby highestgrade completed and median years–ofeducation,ment status:United States,Uune-August 1969care home administraaccordingto employ-tors(&ludrxAlaskaand HawijHighestAdministratorsEmploymentstatusgra e9thllthbelowgradescompletedIBelow 12thgrade8thgradeI12thgrade1yearT2 or3years“’atuses--l k Selfemployed---Employed---Both ----------8,090100.08,640100.0I 4yearsormoreMedianyearsofeduca 530.924.014.5*sometimes the employed administratorshadgenerally attained a higher educational level thanhad self-employed administrators within the sameage group. (Other variables—i.e.,bedsize,etc.—which affect the relationship betweenemploymentstatus and educational level are discussed insubsequent sections of this report.)As expected, employed administratorshadobtained ahigher educational level snd thereforeheld more formal degrees. This is especiallytrue of the bachelor’s degree, for this degreewas the highest degree heldby 14percent of theemployed administratorscomparedwith5percentof the self-employed administrators(table M).It was of interest
training prepare him to direct and administer a program which provides both the “nursing” and the “home” aspects of patient care.1 Highlights The median number of years of education for the estimated 18,390 nursing and personal care home administrators in the conterminou