Transcription
International Journal of Industrial Engineering and Management (IJIEM), Vol. 6 No 2, 2015, pp. 85-92Available online at www.iim.ftn.uns.ac.rs/ijiem journal.phpISSN 2217-2661UDK: 658.58Integrating Reliability-Centered Maintenance with CostOptimization & Application in Plant of Hard Chrome PlatingTadpon KullawongDepartment of Production Engineering, Faculty of Engineering, King Mongkut’s University of Technology,North Bangkok, Thailand, tadponk@yahoo.comSuthep ButdeeDepartment of Production Engineering, Faculty of Engineering, King Mongkut’s University of Technology,North Bangkok, Thailand, tkullaw@yahoo.comReceived (14.02.2015.); Revised (14.06. 2015.); Accepted (29.06. 2015.)AbstractThis paper describes the application of reliability-centered maintenance (RCM) methodology and costoptimization to the development of maintenance & cost management for the plant of Hard ChromePlating. The main objective of reliability-centered maintenance and cost optimization is the effectivemaintenance & cost management of the plant components inherent reliability value. Consequently,this research aims to manage the costs necessary to extend the service life of a plant through the useof probabilistic methods and simulation techniques in order to better identify the importance of everycomponents in a plant with respect to maintenance costs. As a result of this research, our costingmodel allows to develop a methodology to determine maintenance costs which must be applied tosome subsets of the elements of a plant, grouped according to their criticality and to identify the gap ofcosts between the true solution and the optimal maintenance interval.Key words: RCM, Maintenance Planning, FMEA, Cost Optimization1. INTRODUCTIONCost minimization has been always the traditionalobjective in maintenance planning; over the years,maintenance has been very often undervalued becauseof the strong business-oriented vision of firmsmanagers who payed attention on production ratherthan on maintenance. Afterwards, the real advantagesoffered by the application of maintenance techniqueshave been understood giving them the right collocationinside the firm management. The present paper showsa costing model to manage maintenance costs andimproves it introducing simulation techniques todiversify the importance of the components of a plant byclassifying their criticality with respect to maintenancecosts.Reliability Centered Maintenance (RCM) is a corporatelevel maintenance strategy that is implemented tooptimize the maintenance program of a company orfacility. The final results of an RCM program are themaintenance strategies that should be implemented oneach of the assets of the facility. The maintenancestrategies are optimized so that the functionality of theplant is maintained using cost-effective maintenancetechniques.Equipment reliability and availability, achieved byminimizing the probability of system failure is the focusof Reliability Centered Maintenance (RCM). With thismaintenance strategy, the function of the equipment isconsidered and possible failure modes and theirconsequences are identified. Maintenance techniquesthat are cost-effective in minimizing the possibility offailure are then determined. The most effectivetechniques are then adopted to improve the reliability ofthe facility as a whole.2. LITERATURE REVIEWSCost minimization has been the traditional objective inmaintenance planning. Deterministic models [16] onpreventive maintenance optimization have establishedminima in costs based on operating cost parameters(repair, maintenance and acquisition). The use ofdeterministic methods, however, does not provideinformation about potential risk that results innonoptimal maintenance planning for process plants[19]. Probabilistic models, on the other hand, useprobability distributions to describe and representnatural variability and uncertainty in parameter, modeland scenario [20]. Probabilistic models of schedulingpreventive maintenance also minimize objectivefunctions that reflect repair, replacement and preventivemaintenance costs [22]. The preventive maintenanceinterval is optimized when the increasing rate ofcorrective maintenance costs (with respect to time)IJIEM
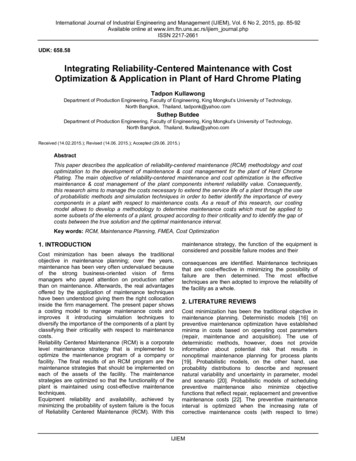
86Kullawong et al.equals the decreasing rate of preventive maintenancecosts.In conducting this type of analysis, some importantmaintenance parameters must be considered: ingeneral terms, it is possible to state that the main goalof a maintenance plan is to improve the availability of aproduction line. By defining up-time as the functioningtime of the line and down-time as the off-duty time ofthe line due to a failure, the availability can be definedas the ratio between the up time and the sum of up-timeand down-time. To improve this performance, one ofthe possible chance is to reduce the Mean TimeWaiting for Spares (MTWS), i.e. the time necessary towait for a spare when a substitution operation occurs.The classical model dealing with the maintenance costsdefines the management procedure by which the i-thcomponent is substituted when it reaches a critical age;this time is defined, in the case of electromechanicalcomponents, by the number of utilization hours withrespect to the service life, or life expectancy of itsdesign. The substitution period, defined as tc, isconsidered with respect to the last intervention ofpreventive or corrective maintenance independently. Bydefining ETTC(tc) the average expected life for acomponent in the period tc as the equation (1).decrease the spare parts consumption systemcomponents. RCM is a systematic approach todetermine the maintenance requirements of plant andequipment in its operating [1]. It is used to optimizepreventive maintenance (PM) strategies.The developed PM programs minimize equipmentfailures and provide industrial plants with effectiveequipment [2]. RCM is one of the best known and mostused devices to preserve the operational efficiency ofthe steam system. RCM operates by balancing the highcorrective maintenance costs with the cost ofprogrammed (preventive or predictive) polices, takinginto account the potential shortening of “useful life” ofthe item considered. But it is difficult to select suitablemaintenance strategy for each piece of equipment andeach failure mode, for the great quantity of equipmentand uncertain factors of maintenance strategy nance, predictive maintenance (PdM), real-timemonitoring (RTM), run-to-failure (RTF) and proactivemaintenance techniques is an integrated manner toincrease the probability that a machine or componentwill function in the required manner over its design lifecycle with a minimum of maintenance [5,6].3. METHODOLOGY(1)3.1 Our Case StudyWhere R(x) is the reliability function of the component.The total cost between two maintenance interventionscan be so evaluated as the sum of the cost related to aplanned and to an unplanned intervention because of afailure of the component; each of those is weighted withits probability represented by the reliability andunreliability functions respectively. So, the totalprovisioning cost per time unit is the equation (2).With more than 30 years of expertise, Rojekolakarn &Machinery Co.,Ltd. has been providing the plant of HardChrome Plating, Surface Hardening, Grinding, and alsoTurning to a broad range of customers’ needs includingmold and die makers, hydraulic systems rebuilders,plastic injection machine owners, and all types ofmachinery manufacturers in Figure 1 and 2. All processis performed in-house which offers the ultimate incontrol. The services of the plant give them acompetitive advantage in their business.(2)where:E(Ci) is the total expected cost of planned maintenanceper time unit related to the i-th component;E(Cpi) is the expected cost of a planned and preventiveintervention for the i-th component;E(Cui) is the expected cost of an unplanned interventiondue to a failure for the i-th component;Ri(t) is the cumulative distribution function of thereliability of the i-th component.By deriving the cost function with respect to tc time andsetting to zero its first derivative, it is possible toevaluate the minimum of this equation (3) obtaining theoptimal maintenance time which minimize the totalcosts:(3)This work aims to generate a maintenance program thatbased on the RCM technique for the process-steamplant components. This technique should be able tominimize the downtime (DT) and improve the availabilityof the plant components. Also, it should benefits toIJIEMFigure 1. Sample products in the plantFigure 2. Hard Chrome Plating Machine
Kullawong et al.3.2 RCM Steps3.4 Failure Mode Effects Analysis (FMEA)The RCM steps are presented. The steps describe thesystematic approach used to implement the preservesthe system function, identifies failure mode, prioritiesfailure used to implement the preserves the systemfunction, identifies failure mode, priorities failure modesand performs PM tasks. The RCM steps are as follows[8]:Step1: system selection and data collectionFailure modes and effects analysis (FMEA) is a stepby-step approach for identifying all possible failures in adesign, a manufacturing or assembly process, or aproduct or service.This is the severity rating, or S. Severity is usually ratedon a scale from 1 to 10, where 1 is insignificant and 10is catastrophic. If a failure mode has more than oneeffect, write on the FMEA table only the highest severityrating for that failure mode.For each cause, determine the occurrence rating, or O.This rating estimates the probability of failure occurringfor that reason during the lifetime of your scope.Occurrence is usually rated on a scale from 1 to 10,where 1 is extremely unlikely and 10 is inevitable. Onthe FMEA table, list the occurrence rating for eachcause.For each control, determine the detection rating, or D.This rating estimates how well the controls can detecteither the cause or its failure mode after they havehappened but before the customer is affected.Detection is usually rated on a scale from 1 to 10,where 1 means the control is absolutely certain todetect the problem and 10 means the control is certainnot to detect the problem (or no control exists). On theFMEA table, list the detection rating for each cause.The risk priority number, or RPN was then calculated inthe equation (5).Step2: system boundary definitionStep3: system description and functional blockStep4: system function functional failuresStep5 : failure mode effect analysisStep6: logic tree diagramStep7: task selection.3.3 Criticality AnalysisCriticality analysis is a tool used to evaluate howequipment failures impact organizational performancein order to systematically rank plant assets for thepurpose of work prioritization, material classification,PM/PdM development and reliability improvementinitiatives [9]. In general, failure modes, effects andcriticality analysis (FMEA/FMECA) required theidentification of the following basic information in Table1. Criticality of each machine (MC) was calculatedbased on the following four criteria:1. Effect of the machine downtime on the productionprocess (EM)2. Utilization rate of the machine (Bottleneck or not) (UR)3. Safety and environmental incidence of machinefailure (SEI)4. Technical complexity of the machine and need ofexternal maintenance resources (MTC).Each of the criteria was given a weight showing itsimportance relative to the criticality indices. The weightof each criterion ranges from zero (no effect) to three(very important effect). Machine criticality was thencalculated in the equation (4) and criticality codes such asA (most critical machine): 20 to 27, B: 12 to 19, C: 0 to 11.MC 3*EM 2*UR 3*SEI I*MTCRPN (S) (O) (D)(5)Risk Evaluation such as Small Risk: RPN 60, MediumRisk: RPN 80 and High Risk: RPN 100 and CrisisRisk: RPN 100, then we should consider the RPN ofcomponents with the highest value first.3.5 Maintenance Assessment of ReliabilityEngineeringWe applied Maintenance Assessment of ReliabilityEngineering to calculate the probability on theparameters of reliability. First, we collected the data ofTime To Fail: TTF to support calculating parameters inTable 2.Table 2. Sample of the data of Time To Fail: TTF (unit: week)(4)Table 1. Sample of some values of machine criticalityAfter that, we adopted Reliability Engineering for thecalculation by using graph probability (ProbabilityIJIEM
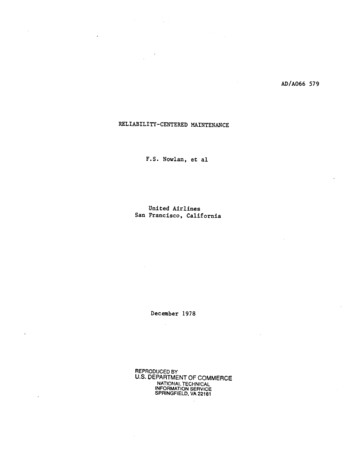
88Kullawong et al.Plotting) with Statistical Software in Figure 3 to estimatethe parameters.Table 3. Sample of the summarized results on Goodness of FitProbability Plot for Carrier BodyWeibull - 95% CIComplete Data - LSXY Estimates99Table of 111010010003.6 Maintenance Period AnalysisCarrier Body3.6.1Figure 3. Sample of Probability Plotting with StatisticalSoftware (Source: Minitab Inc., Minitab 17 trial version[Online], accessed 26 August 2014. Available fromhttp://www.minitab.com)In addition, we tested conditions about Goodness of FitTest to confirm that a hypothesized distribution fits adata set by Kolmogorov-Smirnov Test for the smallpopulation using the equation (6)-(9). Then we createdExcel Simulation to calculate the equation (6)-(9) inFigure 4 and the results on Goodness of Fit aresummarized in Table 3.Statistical Hypothesis:H0: TTF Data is Weibull distribution with β (Sharpe) andη (Scale)H1: TTF Data isn’t Weibull distribution with β (Sharpe)and η (Scale)If β 1 : Constant Failure Mode regarded asExponential Distribution.We applied the technique of Failure Finding bycalculating the inspection interval in the equation (10)[13]. Also, we created Excel Simulation to calculate theequation (10) in Figure 5.(10)AFFIM Availability of the protective device The inspection interval (ti) MTTFTest Statistics by Kolmogorov-Smirnov Test :(6)(7)Opportunity of Breakdowndα Critical Values of Komogorov-Smirnov Tests(8)Figure 5. Excel Simulation to calculate the equation (10)(9)Decision criteria on Significance level ( ): Acceptd H0if d dα3.6.2 If β 1 considered Increase Failure Mode.We applied the technique of Determination of OptimalPreventive Replacement Interval to determine theoptimal replacement interval (tp) between preventivereplacements to minimize total downtime per unit timeby calculating in the equation (11) and (12) [13]. So, wecreated Excel Simulation to calculate the equation (11)and (12) in Figure 6.(11)Figure 4. Excel Simulation to calculate the equation (6)-(9)(12)IJIEM
Kullawong et al.component. Its meaning is in fact the substitution periodprovided by the analysis of the data sheets of thecomponent i.e. without considering the real use in theplant or for example without considering repairswhereas possible. So, the classical model does not takeinto account an historical study of all of the pastconditions of the component to be analyzed,determining a loss of precision in the determination ofthe total maintenance costs and so providing a result interm of optimal maintenance interval which may bequite far from the true one.As said, the proposed method tries to overcome theselimits by a re-elaboration of the classical model; itintroduces two important features represented by thepossibility to apply the model to the whole machine andby the combination of the maintenance statistics of thefirm and the probabilistic analysis about thecomponents.It is possible to manipulate the classical equation ofmaintenance costs to define a new model. As said, theclassical equation (13) is as follows: The total Downtime per unit time The number of failures in interval (0,tp ) The mean downtime required to make afailure replacement The mean downtime required to make apreventive replacement Preventive replacement at timeFigure 6. Excel Simulation to calculate the equation (11) and (12)and the results on Assessment Guidelines for themaintenance of Reliability Engineering are summarizedin Table 4.(13)The first step is to split this equation since it will beapplied to a group of components rather than to a singleone. Then, we need to define the equation (14) to (16 ).Table 4. Sample of Assessment Guidelines in Maintenance &Reliability Engineering(14)(15)(16)3.7 Our Model for Cost OptimizationThe aim of the work is to develop a new equationrepresenting the model to determine and optimize themaintenance costs which could be applied not only tothe single component but to a set of componentsgrouped in a particular way, i.e. to their criticality. At thesame time, this new model allows to overcome somelimits in the application of the classical one, whendealing with big dimensions plants. One of the problemis in fact due to the application of the classical model toa complex plant; the model forces to divided the plantby a very detailed tree-structure which is a very difficulttask dealing with machines rich in components. Anotherproblem is represented by the meaning of the integral inthe denominator of the equation; it represents anestimate of the service life of a component over a fixedtime interval which must be the same for everyWhere:i is the single component belonging to a particularcriticality class;NA, NB and NC are respectively the sum of all thecomponents belonging to A,B and C criticality classes.At the same way, Total E(C) must be redefined as theequation (17).(17)It is now possible to rewrite the equation as theequation (18).(18)So it is necessary to find some reliability function R(t)which represents the average of the Ri(t) functions ofevery components on the equation (19) to (21).IJIEM
90Kullawong et al.(19)(20)Figure 7. Converting coordinates from x to(21)Moreover, by substituting and putting in evidence, weare able to state EA(CA), EB(CB), and EC(CC) on theequation (22) to (24).(22)(23)1. Converting coordinates from x tobefore theintegration by using Gauss Legendre formulas in Figure 7.2. The Gaussian quadratures provide the flexibility ofchoosing not only the weighting coefficients (weightfactors) but also the locations (abscissas) where thefunctions are evaluated. When the function is knownand smooth, the Gaussian quadratures usually havedecisive advantages in efficiency.3. All Gaussian quadratures share the following theeqution (26).(26)(24)3.8 Solving Techniques on Our MathematicalProblemsWe tried to solve mathematical problems of style in theeqution (25).Where:, associated with zeros of orthogonal polynomials,are the integration points.is the weighting function related to the orthogonalpolynomials.4. Gauss-Legendre Formula: The Gauss-Legendreintegration formula is the most commonly used form ofGaussian quadratures in the eqution (27).After that, we applied Numerical Methods for solving.Let and(27)Where:Accordingly, we used Gauss Integration (Gaussianquadratures) for solvingfollowing steps.in theIJIEM,
Kullawong et al.4. CASE STUDY RESULT 5. Thus, we applied MATLAB & Excel about GaussIntegration for solving this model (E(C) in Figure 8 andThe total expected cost of planned maintenance pertime:Total E(C) in Figure 9.The model has been applied to the previous case studyby the use of MATLAB & Excel software to generatesimulation results. The analysis has been focused onthe determination of the maintenance costs over a timeperiod of 36 months. After the data history analysis ofthe treated components of the plant, it is possible toshow that Total E(C) consisted of 75% of EA(CA), 20%of EB(CB), and 5% of EC(CC) in the trend of the reliabilityfunction for each criticality class. It can be said that, inspite of their main criticality, the elements belonging toA class have higher mantenance costs; therefore, theelements belonging to C class have low mantenancecosts on analyzing costs which together contribute togenerate the total maintenance costs from planned andunplanned maintenance costs.Figure 8. E(C) on Machine Code (A): Carrier BodyFigure 9. Sample of Excel simulation to calculate Total E(C)5. CONCLUSIONS5.1 We can make a comprehensive analysis ofmaintenance strategy and reliability requirementsthroughout the lifecycle of maintenance. The model hasbeen applied to the previous case study by the use ofintegrated Reliability Theory on Hazard Rate for optimalcost of maintenance with the number of components ina semi automatic machine of coating to generatesuitable results. The analysis has been focused on thedetermination of the costs throughout the lifecycle ofmaintenance.5.2 The present work focused on the definition of amodel to manage the costs necessary to extend theservice life of a plant through the use of probabilisticmethods and Reliability Theory on Hazard Rate in orderto better identify the importance of every components ina plant with respect to maintenance costs.5.3 The new model is able to develop a methodology todetermine maintenance costs which must be applied tosome subsets of the elements of a plant, groupedaccording to their criticality.5.4 The model allows also to overcome some limits ofthe classical model, providing a more precisedetermination of the costs. In fact, the previous datahistory of the components and the previousmaintenance plans together with a probabilistic studyare considered in the model to enhance the model to bemore accurate.IJIEM
92Kullawong et al.6. REFERENCES[1]M. Dixey. (1993), “Putting Reliability at the Center of Maintenance,”Professional Engineering, Vol. 6, No. 6, pp. 23-25.[2] S. A. Abdulrohim, O. D. Salih and A. Raouf. (2000), “RCMConcepts and Application: A Case Study,” International Journalof Industrial Engineering, Vol. 7, No. 2, pp. 123-132.[3] J. Wang and J. Chu. (2007), “Selection of Optimum MaintenanceStrategies Based on a Fuzzy Analytic Hierarchy Process,”International Journal of Production Economics, Vol. 107, No. 1,pp. 151-163.[4] R. K. Sharma, D. Kumar and P. Kumar. (2005), “FLM to SelectSuitable Maintenance Strategy in Process Industries UsingMISO Model,” Journal of Quality in Maintenance Engineering,Vol. 11, No. 4, pp. 359-374.[5] The National Aeronautics and Space Administration. (2000),“Reliability-Centered Maintenance Guide for Facilities andCollateral Equipment,” NASA, Washington D.C.[6] A. M. Smith. (1993), “Reliability-Centered Maintenance,”McGraw-Hill, New York.[7] J. Shayeri. (2007), “Development of Computer-AidedMaintenance Resources Planning (CAMRP): A Case of MultipleCNC Machining Centers,” Robotics and Computer-IntegratedManufacturing, Vol. 23, No. 6, pp. 614-623.[8] M. Rausand. (1998), “Reliability-Centered Maintenance,”Reliability Engineering and System Safety, Vol. 60, No. 2, pp.121-132.[9] A. H. Gomaa. (2003), “Maintenance Planning and Management,”A Literature Study, American University in Cairo, Cairo.[10] M.M. Savino, A. Brun, C. Riccio. (2011), “Integrated system formaintenance and safety management through FMECA principlesand fuzzy inference engine”, European Journal of IndustrialEngineering 5 (2), pp. 132-169.[11] K. B. Öner, G. P. Kiesmüller, and G. J. Houtum. (2010),“Optimization of component reliability in the design phase ofcapital goods,” European Journal of Operational Research, vol.205, no. 3, pp. 615-624.[12] L. Z. Wand, Y. G. Xu, and J. D. Zhang. (2010), “Preventivemaintenance economic optimization model based on vailability and reliability,” Chinese Journal of MechanicalEngineering, vol. 46, no. 4, pp. 163-168.Albert H. C. Tsang & Andrew K. S. Jardaine. (2013),“Maintenance Replacement and Reliability Theory andApplication,” Taylor & Francis Group.D.Dubois, H. Prade. (2010), “Gradualness, uncertainty andbipolarity: Making sense of fuzzy sets”, Science direct.M.M. Savino, A. Brun, C. Riccio. (2011), “Integrated system formaintenance and safety management through FMECA principlesand fuzzy inference engine”, European Journal of IndustrialEngineering 5 (2) , pp. 132-169.K. B. Öner, G. P. Kiesmüller, and G. J. Houtum. (2010),“Optimization of component reliability in the design phase ofcapital goods,” European Journal of Operational Research, vol.205, no. 3, pp. 615-624.T. D. Jin and P. Wang. (2012), “Planning performance basedcontracts considering reliability and uncertain system usage,”Journal of the Operational Research Society, vol. 63, no. 10, pp.1467-1478.K. Lu, Y. Zhang, and M. G. Suo. (2011), “Study on themaintenance strategy of power equipment based on optimalLCC,” In Proceedings of Asia-Pacific Power and EnergyEngineering Conference, pp. 1-5.L. Y. Waghmode and A. D. Sahasrabudhe. (2012), “Modellingmaintenance and repair cost using stochastic point processes forlife cycle costing of repairable systems,” International Journal ofComputer Integrated Manufacturing, vol. 25, no. 4-5, pp. 353367.L. Z. Wand, Y. G. Xu, and J. D. Zhang. (2010), “Preventivemaintenance economic optimization model based on equipmentavailability and reliability,” Chinese Journal of MechanicalEngineering, vol. 46, no. 4, pp. 163-168.C. E. Ebeling. (2005), An Introduction to Reliability andMaintainability Engineering. Illinois: Waveland Press.H. Z. Huang, Z. J. Liu, and D. N. P. Murthy. (2007), “Optimalreliability, warranty and price for new products,” IIE Transactions,vol. 39, no. 8, pp. 819-827.Integrisanje održavanja baziranog na pouzdanosti sa optimizacijomtroškova i primenom u postrojenju za hromirane pločeTadpon Kullawong, Suthep ButdeePrimljen (14.02.2015.); Recenziran (14.06. 2015.); Prihvaćen (29.06. 2015.)ApstraktOvaj rad opisuje primenu metodologije održavanja baziranog na pouzdanosti (RCM) i optimizacijetroškova za razvijanje menadžmenta održavanja i troškova za postrojenje za hromirane ploče.Osnovni cilj optimizacije održavanja baziranog na pouzdanosti i optimizacije troškova je efikasanmenadžment održavanja i troškova sopstvenih vrednosti pouzdanosti komponenti postrojenja. Kaoposledica toga, ovo istraživanje teži da upravlja troškovima koji su neophodni za produženje životnogveka postrojenja putem upotrebe metoda verovatnoće i tehnika simulacije kako bi se boljeidentifikovao značaj svake komponente u postrojenju, vodeći računa o troškovima održavanja. Kaorezultat ovog istraživanja, naš model troškova omogućava razvoj metodologije za određivanjetroškova održavanja koji moraju da se primene na neke podskupove elemenata u postrojenju,grupisanih prema njihovoj kritičnosti, kao i da se identifikuje jaz troškova između pravog rešenja ioptimalnog intervala održavanja.Ključne reči: RCM, planiranje održavanja, FMEA, optimizacija troškovaIJIEM
The main objective of reliability-centered maintenance and cost optimization is the effective maintenance & cost management of the plant components inherent reliability value. Consequently, this research aims to manage the costs necess