Transcription
Downloaded from orbit.dtu.dk on: Apr 25, 2022Removal of pharmaceuticals in WWTP effluents by ozone and hydrogen peroxideHey, G.; Vega, S. R.; Fick, J.; Ledin, A.; la Cour Jansen, J.; Andersen, Henrik RasmusPublished in:Water S A (Online Edition)Link to article, DOI:10.4314%2Fwsa.v40i1.20Publication date:2014Document VersionPublisher's PDF, also known as Version of recordLink back to DTU OrbitCitation (APA):Hey, G., Vega, S. R., Fick, J., Ledin, A., la Cour Jansen, J., & Andersen, H. R. (2014). Removal ofpharmaceuticals in WWTP effluents by ozone and hydrogen peroxide. Water S A (Online Edition), 40(1), 165173. https://doi.org/10.4314%2Fwsa.v40i1.20General rightsCopyright and moral rights for the publications made accessible in the public portal are retained by the authors and/or other copyrightowners and it is a condition of accessing publications that users recognise and abide by the legal requirements associated with these rights. Users may download and print one copy of any publication from the public portal for the purpose of private study or research. You may not further distribute the material or use it for any profit-making activity or commercial gain You may freely distribute the URL identifying the publication in the public portalIf you believe that this document breaches copyright please contact us providing details, and we will remove access to the work immediatelyand investigate your claim.
Removal of pharmaceuticals in WWTP effluents by ozoneand hydrogen peroxideG Hey1, SR Vega2, J Fick3, M Tysklind3, A Ledin1, J la Cour Jansen1* and HR Andersen4Water and Environmental Engineering, Department of Chemical Engineering, Lund University, PO Box 124, 221 00 Lund, Sweden2Departamento de Ingenieria Química, Facultad de Ciencias Químicas, Complutense University, Madrid, 28040, Spain3Department of Chemistry, Umeå University, 901 87 Umeå, Sweden4Department of Environmental Engineering, Technical University of Denmark, Miljøvej, Building 113, 2800 Kongens Lyngby, Denmark1ABSTRACTOzonation to achieve removal of pharmaceuticals from wastewater effluents, with pH values in the upper and lower regionsof the typical range for Swedish wastewater, was investigated. The main aim was to study the effects of varying pH values(6.0 and 8.0), and if small additions of H2O2 prior to ozone treatment could improve the removal and lower the reactiontime. The effluents studied differed in their chemical characteristics, particularly in terms of alkalinity (65.3–427 mg ℓ 1HCO3-), COD (18.2–41.8 mg ℓ 1), DOC (6.9–12.5 mg ℓ 1), ammonium content (0.02–3.6 mg ℓ 1) and specific UV absorbance(1.78–2.76 ℓ mg 1 m 1). As expected, lower ozone decomposition rates were observed in the effluents at pH 6.0 comparedto pH 8.0. When pH 8.0 effluents were ozonated, a higher degree of pharmaceutical removal occurred in the effluent withlow specific UV absorbance. For pH 6.0 effluents, the removal of pharmaceuticals was most efficient in the effluent with thelowest organic content. The addition of H2O2 had no significant effect on the quantitative removal of pharmaceuticals butenhanced the ozone decomposition rate. Thus, H2O2 addition increased the reaction rate. In practice, this will mean that thereactor volume needed for the ozonation of wastewater effluents can be reduced.Keywords: ozone; pharmaceuticals; hydrogen peroxide; wastewater effluentsINTRODUCTIONA number of pharmaceuticals of differing therapeutic class,along with their metabolites, have been detected in aquaticenvironments (Ternes, 1998; Kolpin et al., 2002; Fent et al.,2006; Batt et al., 2006; Snyder, 2008; Verlicchi et al., 2012). Themajor source of these pharmaceuticals is considered to be thedischarge of effluents by wastewater treatment plants (WWTPs)that are not designed for removing trace organic pollutants, inview of the recalcitrance of such pollutants to biodegradationand their limited biological activity, especially in cold climates.Accordingly, additional treatment following biological treatment is called for.Ozonation is one of the most promising technologies forthe removal of organic micropollutants contained in waste water. The efficiency of ozone in removing pharmaceuticals andpersonal care products, both from water generally and fromwastewater, has been tested in both laboratory- and pilot-scaleexperiments (Ternes et al., 2003; Huber et al., 2005; Buffle et al.,2006a,b; Bahr et al., 2007; Benner and Ternes, 2009; Hollenderet al., 2009; Hansen et al., 2010; Zimmermann et al., 2011).Ozone-based oxidation can be more energy-efficient thanUV-based oxidation, especially when used for treatment ofwaters high in UV absorbance (Rosenfeldt et al., 2006; Hansenand Andersen, 2012).One of the benefits of using ozonation in aqueous solutions is that the hydroxyl (OH) radicals that are produced will* To whom all correspondence should be addressed. 46 46 2228999; Fax: 46 462224526;e-mail: jes.la cour jansen@chemeng.lth.seReceived 12 February 2013; accepted in revised form 17 December le on website http://www.wrc.org.zaISSN 0378-4738 (Print) Water SA Vol. 40 No. 1 January 2014ISSN 1816-7950 (On-line) Water SA Vol. 40 No. 1 January 2014react non-selectively with pharmaceuticals, which couldbe an advantage for those pharmaceuticals that are difficult to degrade by direct reaction with ozone (Lee and VonGunten, 2010). The OH radicals are generated through theself-decomposition of ozone in water at pH levels above 7,where the hydroxide ions are acting as initiators (Hoigne andBader, 1983). Laboratory experiments have shown that theaddition of hydrogen peroxide (H 2O2) enhances the decomposition of ozone, promoting the production of OH radicals(Von Gunten, 2003). Furthermore, non-selective oxidation byhighly reactive radicals usually enhances the reaction ratesof ozone-resistant compounds, which will reduce the treatment time required (Zwiener and Frimmel, 2000; Huber et al.,2003). Balcioglu and Ötker (2003) reported that adding H 2O2enhances both the UV absorbance (at 254 nm) removal andthe decrease of COD in wastewater. The rapid reaction of OHradicals is preferable in practice since it reduces the reactorsize needed for such treatment. The efficiency of ozone treatment for the removal of pharmaceuticals can also dependupon the reactivity of the wastewater matrix in general(Nöthe et al., 2009).The present study aimed at investigating the impact ofvarying pH levels, within the natural interval in Sweden (pH6–8), on the removal of pharmaceuticals from wastewater effluents by the addition of ozone. It also determined if the reactivity of ozone can be promoted by addition of small amountsof H2O2 at low pH levels. Since the addition of H2O2 can beexpected to enhance the decomposition of ozone to OH radicals, it is of interest to investigate the effect this has in the caseof effluents with a pH below 7, where the reaction rate can beexpected to be lower and the pharmaceutical removal rate lowerdue to the lack of hydroxide ions that promote the decomposition of ozone.165
MATERIALS AND METHODSOverall experimental setupTwo effluents of relatively high pH (pH 8.0) were treated withozone, whereas two other effluents, low in pH (pH 6.0), weretreated with ozone in combination with H2O2. Treatment wascarried out at these pH levels since they correspond to theupper and lower range of pH values typically found in SwedishWWTP effluents. The effluents selected were from plants withextended nitrogen and phosphorus removal. The differencein pH is due to the origin of the potable water (ground versussurface waters). Further, the effluents also differ with respect toother chemical parameters such as alkalinity and ammoniumand organic matter content. The pharmaceuticals investigated represent different therapeutic classes commonly usedin Sweden, most of them having been found to be present inWWTP effluents (Falås et al., 2012).The production of OH radicals by ozone decomposition wasfollowed indirectly through measuring the ozone concentration. The experiments were carried out initially in effluents witha pH range between 6 and 8, with the aim to determine theminimum amount of H2O2 needed to increase the decomposition of ozone.Uppsala (Effluent 3) and Käppala (Effluent 4). The effluentsamples differed from one another in pH on the day of collection and were adjusted at the start of the experiment by use ofeither NaOH or H2SO4, so as to be exactly pH 6.0 or pH 8.0.Table 1 shows the quality parameters of the effluents.AnalysisThe H2O2 solution (30%) employed was purchased from SigmaAldrich, the NaOH and H2SO4 being purchased from Merck(Germany). The pharmaceutical reference standards werepurchased from different suppliers as analytical grade ( 98%)solids (Appendix: Table S1). The stock solution of pharmaceuticals was prepared in methanol at a concentration of 100 mg ℓ 1.The ozone stock solution was prepared in a glass bottle containing purified water (Millipore-Billerica, MA) and provided witha diffuser to disperse the generated ozone from a 1.0 g h 1 ozonegenerator (O3 Technology AB, Sweden) supplied with dryoxygen gas. The bottle was immersed in an ice bath to increaseozone solubility. Detailed description of the method is found inAntoniou and Andersen (2012).COD and NH4 -N were determined by use of the Hach Langetest kits LCK 114 and LCK 304. To measure alkalinity, a 25 mℓsample was titrated with 0.05 M HCl to a pH of 4.5, and thenthe alkalinity in mg ℓ 1 HCO3- was calculated. DOC was measured on the basis of wet chemical oxidation, using a ShimadzuTOC-Vwp analyser. The UV-absorbance at 254 nm was measured using a Varian CARY50 Bio UV-Vis spectrophotometer.The specific UV absorbance (SUVA), an indicator of the dissolved aromatic carbon that the wastewater contains, known toaffect the reactivity of DOC to ozone, was determined by normalising UV absorbance at 254 nm to the DOC concentration(Weishaar et al., 2003). The O3 doses delivered were analysed bythe colorimetric method of indigo (λ 600 nm) through preparing bottles of indigo trisulphonate solution in Milli-Q waterin parallel with the treatment samples (Bader and Hoigne, 1981;Antoniou and Andersen, 2012).For pharmaceutical analysis, 100 mℓ samples of the treatedeffluent were filtered through a 0.45 µm membrane filter(Millipore) and were acidified to pH 3 by use of sulphuricacid. After SPE extraction, LC/MS/MS analysis of the extractswas carried out, using a triple-stage quadrupole MS/MS TSQQuantum Ultra EMR (Thermo Fisher Scientific, USA) coupledwith an Accela LC pump (Thermo Fisher Scientific, USA) anda PAL HTC autosampler (CTC Analytics AG, Switzerland)having a Hypersil GOLD aQTM column (50 mm x 2.1 mm ID x5 µm particles, Thermo Fisher Scientific, USA). The method ofanalysing pharmaceuticals was used earlier by Hörsing et al.(2011) and Hey et al. (2012). A detailed description and a fullmethod evaluation are presented in Grabic et al. (2012). Theionisation mode, recoveries, relative standard deviations (RSD)and limit of quantification (LOQ) of the pharmaceuticals aregiven in the Appendix: Table S2.WWTP effluentsExperimental setupThe biologically-treated wastewater effluents investigated,differing in their characteristics and representing the typicalvariations in alkalinity, pH, and organic matter and ammonium content, were taken from 4 municipal WWTPs inSweden: Öresundsverket (Effluent 1), Klagshamn (Effluent 2),For the ozone consumption experiments carried out, thebiologically-treated municipal wastewater was ozonated atdifferent pH levels and O3 to H2O2 ratios. Samples were takenat different reaction times for analysis of the O3 content. Forexperiments involving pharmaceutical removal, the wastewaterChemicalsTABLE 1Quality parameters of the effluent wastewaters studiedWWTPs166ÖresundsverketEffluent 1KlagshamnEffluent 2UppsalaEffluent 3KäppalaEffluent 4High pHHigh pHLow pHLow pHCOD (mg ℓ 1)DOC (mg ℓ 1)Initial alkalinity (mg ℓ 1 HCO3-)NH4 -N (mg ℓ 1)UV abs254nm 79.90.0216.035.412.565.33.629.5pH (initial)pH (adjusted)SUVA (ℓ mg 1 m x.doi.org/10.4314/wsa.v40i1.20Available on website http://www.wrc.org.zaISSN 0378-4738 (Print) Water SA Vol. 40 No. 1 January 2014ISSN 1816-7950 (On-line) Water SA Vol. 40 No. 1 January 2014
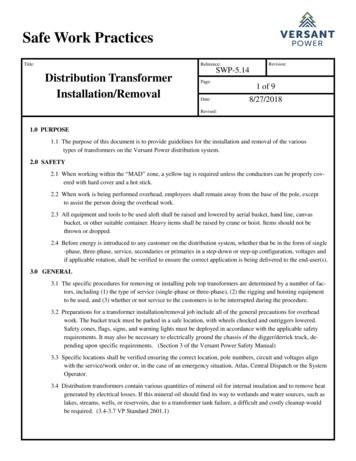
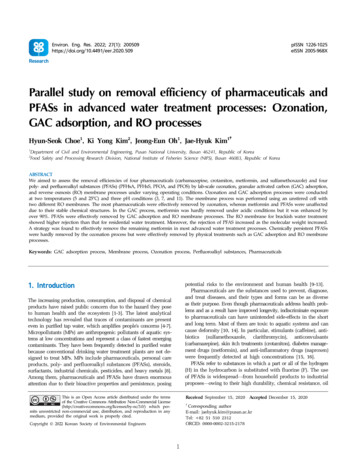
001234567Time, minBA10H2O2/O3 ratioO3 only210.50.2564200123456O3 only10.5Effluent0.251 (O3 )Effluent0.102 (O3 )0.058A7Ozone, mg/lOzone, mg/lOzone, mg/l8H2O2/O3 ratio10126104826042Time, min01234567Time, min0Figure 10246810 12 14 16Ozone consumptionin the WWTP effluent (Effluent 1) at pH 8 (A) and at pH 6 (B) withdifferentTime,min doses of H2O2BH2O2/O3 ratio812AO3 only10.5 1 (O3 )Effluent0.252 (O3 )Effluent0.100.0561084624020012345612147Time, min0246810BTime, minEffluent 3 (H2 O2 /O3 )10Effluent 4 (O3 )Effluent 4 (H2 O2 /O3 )8642016Effluent 3 (O3 )12Ozone, mg/lOzone,Ozone,mg/l mg/l100246810121416Time, minFigure 2BOzone consumption in WWTP effluents at pH 8.0 (A, Effluents 1 and 2) without H2O2 and at pH 6.0Effluent3 (O3 )with H O (at a H O /O ratio of 0.10) and without12(B, Effluents 3 and4) both2 22 23Ozone, mg/l108Effluent 3 (H2 O2 /O3 )Effluent 4 (O3 )Effluent 4 (H2 O2 /O3 )effluents from 4 WWTPs were spiked with pharmaceuticals soas to provide a nominal6 concentration of 1 µg ℓ 1. The spikedeffluents were then transferredinto borosilicate glass bottles4(Schott Duran ) to whichdifferentvolumes of O3 stock solution2were added to provide, in each case, a nominal concentration 1of between 1.4 and 10.70mg ℓO for a6total8 samplevolume of02 3410 12 14 16150 mℓ. The bottles were covered with Time,aluminiumfoil and wereminplaced in a 15 C water bath for 2 h. For the O3 and H2O2 experiments that were conducted, the H2O2 was added just prior tothe addition of ozone. All treatment tests conducted were runin triplicate, a relative standard deviation of up to 20% betweenreplicates being considered for data treatment.When H2O2 was added to the effluents at H2O2/O3 ratiosranging from 2 to 0.25 (Fig. 1), ozone was almost completelyconsumed during the first minute. As could be expected, theeffluent of high pH (pH 8) exhibited the fastest ozone decomposition rate ( 1 min). An additional experiment was also carriedout at pH 6.0, involving the use of lower doses of H2O2, resulting in significantly lower H2O2/O3 ratios of 0.05–0.10. As can beseen (Fig. 1), the differences in ozone removal rate between thesamples are most obvious in the first minute or so of treatment,where the decomposition of ozone increased with an increasein the H2O2/O3 ratio for around 2 min, after which nearly all theozone has been consumed.RESULTS AND DISCUSSIONO3 concentration profiles in the WWTP effluents testedDetermination of ozone concentration profiles atdifferent pHOn the basis of these findings, it is obvious that the additionof relatively small amounts of H2O2 is able to change the ozoneconcentration profile appreciably. To investigate this further,a set of experiments was carried out using 4 different effluentwastewaters (Table 1), two with relatively high pH and twowith relatively low pH. The effluents, after pH adjustmentsto 8.0 and 6.0, respectively, were treated with ozone and thedecomposition was followed (Fig. 2). In the high-pH effluents(Fig. 2A), about half of the ozone was already consumed duringthe first minute, especially in the case of Effluent 2. The differences observed can be attributed to the higher SUVA content inEffluent 2 than in Effluent 1 (Table 1). The relatively high content of aromatic compounds, indicated by the relatively highSUVA level, could explain the increased ozone consumption inthe early stages of treatment, due to fast reactivity of aromaticcompounds, as also observed by Westerhoff et al. (1999). At pHAs can been seen in Fig. 1, the ozone concentration in thewastewater effluents decreased rapidly after the first minute ofozone addition. Thereafter, the rate of ozone decompositiondecreased gradually and stabilised. This relatively fast ozoneconsumption was to be expected due to the matrix componentsin the wastewater consuming the oxidant. In addition, thedecomposition of ozone tended to proceed faster at pH 8 thanat pH 6, in accordance with the results of other studies, suchas Hoigne and Bader (1981), using drinking water spiked withorganic compounds, and Elovitz et al. (2000) which focused onsurface water and groundwater. Wert et al. (2009) also demonstrated the fast consumption of ozone in real wastewaters ofvarying organic carbon lable on website http://www.wrc.org.zaISSN 0378-4738 (Print) Water SA Vol. 40 No. 1 January 2014ISSN 1816-7950 (On-line) Water SA Vol. 40 No. 1 January 2014167
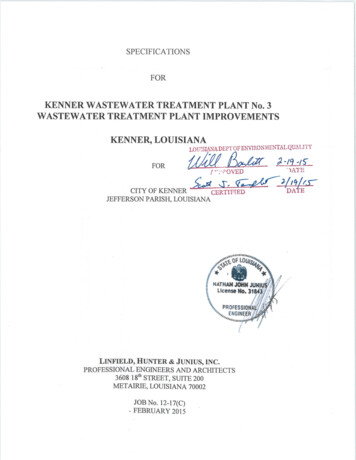
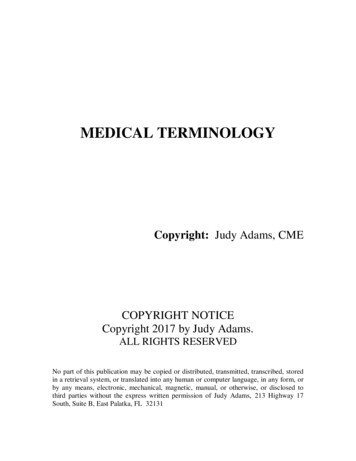
A. Effluent 11009080Removal, %7060O 3 eDiltiazemNaproxenFexofenadineRepaglinideEthinyl el10Figure 3The contribution ofeach level of ozonedose to the removalof pharmaceuticalsin Effluent 1 (A) andEffluent 2 (B) duringozonation at pH 8.0B. Effluent 21009080Removal, %706050O 3 dose(mg/ℓ)4010.7305.3203.310Removal of pharmaceuticals by O3 and H2O2In the ozonation of pH 8.0 effluents, a significant reduction inthe different pharmaceuticals was found, especially in the caseof Effluent 1 (Fig. 3A), even at relatively low doses of ozone.At the lowest dose (1.5 mg ℓ 1 O3), 9 of the 40 pharmaceuticals (clomipramine, sulfamethoxazole, repaglinide, ethinylestradiol, fexofenadine, codeine, naproxen, diltiazem andeprosartan) already showed removal rates of 90–100%; only 8of the pharmaceuticals (bupropion, oxazepam, levonorgestrel,memantine, fluconazole, flutamide, ketoprofen and ibuprofen)exhibited 50% removal. As the ozone dose was increased,most of the pharmaceuticals, including the less reactive ones,were inideFexofenadineClomipramineSulfamethoxazole6.0, in contrast, Effluent 3 appears to have a much lower ozonedemand than Effluent 4 (Fig. 2B), this probably being due tothe lower organic content of Effluent 3, which is only about halfthat of Effluent 4. Similar to what can be seen above (Fig. 1), theaddition of H2O2 to the effluent led to an increased decomposition of ozone, measured as a decline in ozone concentration.These findings show that it is important, when employing ozonation, to investigate the initial ozone demand of thewastewater due to matrix effects. The present findings also showthat at low pH the combination of ozone and H2O2 reduces thereaction time, indicating that it is possible to reduce the size ofthe reaction tank employed for treatment.Biperiden1.40On the other hand, in Effluent 2 (Fig. 3B), the pharmaceuticals were poorly removed, even when the O3 dose wasincreased. This can be attributed to the high SUVA level (2.76as compared with 1.78) of this effluent. The high ozone reactivity of the aromatic components of the DOC may have contributed to the decrease in pharmaceutical removal from theeffluent. Also, as can be observed in Fig. 3, some of the pharmaceuticals in Effluent 1 exhibited a high level of removal inresponse to the lowest ozone dose but did not follow the samepattern of removal in Effluent 2. For example, both clomipramine and repaglinide showed a high degree of removal atthe lowest ozone dose, yet when treated with the same O3 dosein Effluent 2 it was only clomipramine for which the degree ofremoval was significant ( 50%). This shows clearly that both thelevel of removal and the reactivity of pharmaceuticals can varydepending upon the composition of the wastewater matrix.The efficiency of ozone in removing pharmaceuticalsfrom pH 6.0 effluents (Fig. 4A) showed that ozone alone couldremove 90% of half of the pharmaceuticals present in Effluent3 at the lowest ozone dose (1.8 mg ℓ 1). When the dose wasincreased to 4.4 mg ℓ 1, all pharmaceuticals except fluconazolewere degraded by over 90%. A still further increase in theozone dose resulted in over 99% removal of all pharmaceuticals, except fluconazole (93%) and ibuprofen (96%). In contrast,the ozonation of Effluent 4 resulted in 90% degradation of thepharmaceuticals when rather high doses of ozone ( 5 mg ℓ 1)were employed (Fig. 4B). In comparison to the pH 8.0 lable on website http://www.wrc.org.zaISSN 0378-4738 (Print) Water SA Vol. 40 No. 1 January 2014ISSN 1816-7950 (On-line) Water SA Vol. 40 No. 1 January 2014
A. Effluent 31009080Removal, %7060O 3 nyl le2.5Levonorgestrel20Figure 4The contribution ofeach level of ozonedose to the removalof pharmaceuticalsin Effluent 3 (A) andEffluent 4 (B) duringozonation at pH 6.0B. Effluent 4100908070O 3 dose(mg/ℓ)Removal, mTrimethoprimCodeineCilazaprilOrphenadrineEffluent 4Effluent 3100808.9‐10 mg/ℓ O36010 mg/ℓ O3, H2O2/O3 0.07‐0.084010 mg/ℓ O3, H2O2/O3 20IbuprofenRemoval, %(Effluent 1), the observed highremoval of pharmaceuticalsin the pH 6.0 effluent (Effluent3) is likely due to the very loworganic content of this effluent (Table 1), which resultedin more ozone being available(Fig. 2B) to react with thepharmaceuticals.Figure 5 illustrates thecontribution of H2O2 addition to the removal of thosepharmaceuticals that havebeen shown to have the lowestreactivity towards ozone. Forfluconazole (Effluent 3), ascan be seen, there was onlya slight increase in removalafter the addition of H2O2,whereas for ibuprofen noimprovement in its removaloccurred. Thus, the addition of H2O2 (at an H2O2/O3 ratio of 0.08–0.13) to aninitial ozone dose of 10 mg ℓ urium10Figure 5The contribution of H2O2 addition to the removal of pharmaceuticalsless reactive to ozone in Effluent 3 and Effluent 4http://dx.doi.org/10.4314/wsa.v40i1.20Available on website http://www.wrc.org.zaISSN 0378-4738 (Print) Water SA Vol. 40 No. 1 January 2014ISSN 1816-7950 (On-line) Water SA Vol. 40 No. 1 January 2014169
TABLE 2Pharmaceuticals for which at least 90% removal ( ) occurs in each of the effluents when treatedwith 5 mg ℓ 1 O3. (NA compound not nacDiltiazemEprosartanEthinyl eHaloperidol(High pH)(Low pH)Eff 1Eff 3 Eff 2 NA NA Eff 4Pharmaceuticals NA could not be expected to have any appreciable impact on theremoval of pharmaceuticals in this effluent. On the other hand,for Effluent 4, the addition of H2O2 was found to enhance theremoval of ibuprofen, fluconazole, levonorgestrel, sulfamethoxazole and ketoprofen by only 4–16% and of naproxenl by 15%.The overall findings of this study show that reaction timecan be reduced when ozone is combined with small amounts ofH2O2, which will be advantageous when practical implementation of the technology takes place. As for most pharmaceuticals, this addition has no impact on removal efficiency, i.e.,neither increasing nor decreasing its removal.The majority of pharmaceuticals included in this studycontained acidic and/or basic groups, having different andpH-dependent charges (positive, neutral or negative) and, as aresult, may also differ in their tertiary chemical structure, as afunction of pH. The pharmaceuticals that are acidic can be protolysed at pH 6, with no further changes occurring then whenthe pH is increased to 8. In contrast, those pharmaceuticals thathave basic group(s) and low pKb values go from being unprotolysed at pH 6 to being protolysed at pH 8, the charge thuschanging from positive to neutral, which can result in a changein the tertiary structure. Those pharmaceuticals having bothacidic and basic groups may also undergo changes in the chargeand in their tertiary structure. This can be expected to havean impact on the oxidation rate. It is not possible, however, onthe basis of the experiments carried out here, to draw any finalconclusions regarding this.Table 2 provides an overview of the findings regarding removal efficiencies for the pharmaceuticals that wereinvestigated. It can readily be seen that an ozone dose ofaround 5 mg ℓ 1 is sufficient to remove over half of the rimethoprimVenlafaxine(High pH)(Low pH)Eff 1Eff 2Eff 3Eff 4 NA pharmaceuticals, except in the case of Effluent 2, in which amuch higher ozone dose may be required for removing a largefraction of the pharmaceuticals, this most likely being due tothe higher SUVA level of Effluent 2. At the same time, it appearsthat, in the case of wastewaters such as Effluent 3 that arelow in pH and organic content, a reasonable dose of ozone toremove over 90% of the pharmaceuticals is around 5 mg ℓ 1.The oxidation of pharmaceuticals may lead to the production of by- and transformation products. Since these can betoxic to varying degrees as compared with the mother compound, toxicity evaluation of a given technology should beperformed before it is considered for implementation.CONCLUSIONSThe following conclusions can be drawn on the basis of theresults of the study: Ozonation can be employed as an additional treatment stepto enable trace pharmaceuticals to be removed effectivelyfrom wastewater effluents. The amount of ozone required for the removal of pharmaceuticals is dependent upon the chemical composition ofthe wastewater and upon the target compounds, with thecontent of organic matter in general and its aromaticitybeing of considerable importance. Ozone decomposition can be stimulated by adding hydrogen peroxide at low pH. The addition of hydrogen peroxidehas only a limited impact on the quantitative removal ofpharmaceuticals. However, it reduces the treatment timeand, accordingly, the reaction volume needed, which will beadvantageous in ilable on website http://www.wrc.org.zaISSN 0378-4738 (Print) Water SA Vol. 40 No. 1 January 2014ISSN 1816-7950 (On-line) Water SA Vol. 40 No. 1 January 2014
ACKNOWLEDGEMENTSThe authors would like to thank the Swedish Foundation forStrategic Environmental Research through its MistraPharmaprogramme for the financial support of this study. We alsothank the staff and the process engineers of the WWTPs ofÖresundsverket, Klagshamn, Uppsala and Käppala for thewastewater samples they provided.REFERENCESANTONIOU MG and ANDERSEN HR (2012) Evaluation of pretreatments for inhibiting bromate formation during ozonation.Environ. Technol. 33 (15) 1747–1753.BADER H and HOIGNE J (1981) Determination of ozone in water bythe indigo method. Water Res. 15 (4) 449–456.BAHR C, SCHUMACHER J, ERNST M, LUCK F, HEINZMANN Band JEKEL M (2007) SUVA as control parameter for the effectiveozonation of organic pollutants in secondary effluent. Water Sci.Technol. 55 (12) 267–274.BALCIOGLU IA and ÖTKER M (2003) Treatment of pharmaceuticalwastewater containing antibiotics by O3 and O3/H2O2 processes.Chemosphere 50 85–95.BATT AL, SNOW DD and AGA DS (2006) Occurrence of sulfonamideantimicrobials in private water wells in Washington County, Idaho,USA. Chemosphere 64 1963–1971.BENNER J and TERNES TA (2009) Ozonation of metoprolol: Eluci dation of oxidation pathways and major oxidation products.Environ. Sci. Technol. 43 (14) 5472–5480.BUFFLE MO, SCHUMACHER J, SALHI E, JEKEL M and VONGUNTEN U (2006a) Measurement of the initial phase of ozonedecomposition in water and wastewater by means of a continuousquench-flow system: Application to disinfection and pharmaceutical oxidation. Water Res. 40 (9 1884–1894.BUFFLE MO, SCHUMACHER J, MEYLAN S, JEKEL M and VONGUNTEN U (2006b) Ozonation and advanced oxidation ofwastewater: Effect of O3 dose, pH, DOM and HO -scavengers onozone decomposition and HO generation. Ozone: Sci. Eng. 28 (4)247–259.ELOVITZ M, VON GUNTEN U and KAISER HP (2000) Hydroxylradicals/ozone ratios during ozonation processes. II. The effect oftemperature, pH, alkalinity, and DOM properties. Ozone: Sci. Eng.22 123–150.FALÅS P, ANDERSEN HR, LEDIN A and LA COUR JANSEN J (2012)Occurrence and reduction of pharmaceu
166 ISSN 1816-7950 (On-line) Water SA Vol. 40 No. 1 January 2014 MATERIALS AND METHODS Overall experimental setup Two effluents of relatively high pH (pH 8.0) were treated with ozone, whereas two other effluents, low in pH (pH 6.0), were treated with ozone in combination with