Transcription
Data Visualization ‐ Tableau
What is Tableau? An interactive data visualization software thatallows you to tell a story about your data Uses drag‐and‐drop interface to transformdata into visually appealing dashboards http://www.tableau.com/– Tableau Gallery– Tableau Community Forums– Tableau Tutorial Videos– Tableau Help27/10/20162
Tableau Products Several ways to use Tableau– Tableau Desktop– Tableau Public (FREE)– Tableau Server– Tableau Online– Tableau Reader27/10/20163
Tableau Public FREE, fast and easy way to embed richly interactivedata visualizations on your website No programming/coding skills required Good starting point to learn Tableau Upgrades Limited to publishing on Tableau website and cannotsave on local machine. Once published with TableauPublic, your visualization is available to all https://public.tableau.com/s/ ‐ Gallery has richexamples of visualizations from around the webavailable for download and for you to work with27/10/20164
Today: Overview of Tableau Public Prepare data to transform to a visual Working with Tableau Public Intro to Tableau InterfaceConnecting to data – types of data sourcesImporting Data – Overview of the Data Source Tab Creating the Visual Overview of a WorksheetCreating 3 sheets: Bubble, Tree Map and Line Graph Piecing it all into a Visual: Dashboard Save/Publish Examples of visualizations using UN Comtrade Data27/10/20165
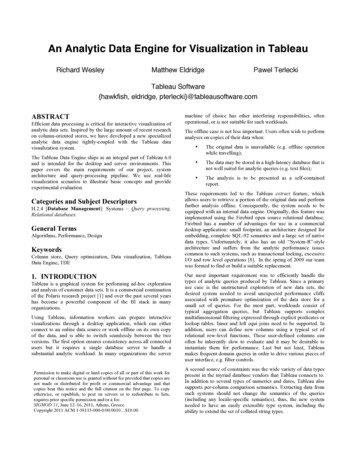
Creating the visualBubbleTree MapLine ct 0/Iceland27/10/20166
Sheets and Dashboard1. Bubble– Partner (Text)– Measure: Trade Value (Size)– Filter: Latest Year2. Tree Map––––Commodity description (Text)Measure: Commodity value share (Size)Trade FlowFilter: Latest year3. Line Graph– Measure: Trade Value (Size)– Filter: Top 3 Commodities Commodity Code (Text)– Filter: Available Years27/10/20167
Working with Tableau Public1. Open Tableau Public 10.2 (short cut on desktop)2. Connect to a text file.– Navigate to \desktop\Tableau Demo\data\Maldives2013‐2015(SITC3‐3D). Click Open.3. Overview of Data Source tab– Connections, Files4. Review imported data– Change Commodity Code data type of from number tostring– Change Partner data type to String ‐ Geographic role ‐ Country/Region5. Worksheets27/10/20168
Dimension vs Measure Tableau automatically classifies your data– Categorical data ‐ Dimensions ‐ Headers– Quantitative data ‐ Measures ‐ Axes Aggregations are always measures.27/10/20169
zhome/Icelandexportandimportbypartnerandproduct 0/Iceland27/10/201610
BubblePartner (Text), Measure: Trade Value (Size), Filter: Latest YearOverview of the worksheet (Toolbar, Dimensions, Measures, “Show Me” feature,Marks, Filters)1.2.3.4.5.6.7.8.Drag Partner from Dimension to ColumnsDrag Trade Value (US ) from Measure to RowsUnder Show Me, choose Bubble visualDrag Partners to Filters. Select All.Drag Year from Dimensions To Filter. Filter latest year (2015)Under the Marks section, change from Circle to Text.Under the Marks section, click on Tooltip. Change entries to “Select Partner to view commodity breakdown.”Rename sheet to “Bubble” and hide this title from the page27/10/201611
zhome/Icelandexportandimportbypartnerandproduct 0/Iceland27/10/201612
Tree MapCommodity description (Text), Measure: Commodity value share (Size), Trade Flow,Filter: Latest yearDrag Trade Flow from Dimension to ColumnsDrag Commodity from Dimension to Rows.Drag Trade Value (US ) from Measure to Rows beside CommodityUnder Show Me, choose Tree Map visual.Drag Trade Flow from Dimension to back to ColumnsDrag Trade Flow from Dimension to Color on the Marks cardDrag Year from Dimensions To Filter. Filter latest year (2015)Drag Trade Value (US ) from Measure to Marks card.–Right click and choose Edit Table Calculation.–Set Calculation Type as “Percent of Total” and Compute Using as“Table down”. Drag the measure on to the Label Marks card.9. Rename sheet as “Tree Map” and hide this title from the page1.2.3.4.5.6.7.8.27/10/201613
zhome/Icelandexportandimportbypartnerandproduct 0/Iceland27/10/201614
Line GraphMeasure: Trade Value (Size), Filter: Top 3 Commodities CommodityCode (Text), Filter: Available Years1.2.3.Drag Trade Flow and Year from Dimensions to ColumnsDrag Trade Value (US ) from Measures to RowDrag Commodity Code to Filters. Select All from list then inthe Top tab, choose Top 5 by sum of Trade Value(US )4.5.6.In Marks card, drag Trade Flow to color, CommodityCode to Text and DetailTooltip contentsRename sheet to “Line” and hide this title from the page27/10/201615
Creating the dashboard Dashboard – collection of several worksheetsin a single place1. Click on dashboard to create one for thisexercise.2. Rename to “Maldives”3. Arrange sheets in preferred layout4. Apply single filter to all sheets– Dashboard ‐ Actions27/10/201616
Saving and sharing your visual Create your free profile on Tableau Public(https://public.tableau.com/s/) Go to File ‐ Save to Tableau Public As ‐ enterlogin credentials and “Enter”27/10/201617
27/10/201618
Data Visualizations using UN Comtrade Data https://public.tableau.com/profile/uncomtrade#!/ https://comtrade.un.org/labs/27/10/201619
THANK YOU27/10/201620
Working with Tableau Public 1. Open Tableau Public 10.2 (short cut on desktop) 2. Connect to a text file. – Navigate to \desktop\Tableau