Transcription
Review of World Economics (2022) 425-2ORIGINAL PAPERCommodity price pass‑through along the pricing chainRebeca Jiménez‑Rodríguez1· Amalia Morales‑Zumaquero2Accepted: 14 June 2021 / Published online: 3 July 2021 The Author(s) 2021AbstractThis paper analyses the commodity price pass-through along the pricing chainfor the global commodity price index and the indices of its main categories (i.e.,agricultural raw materials, food and beverages, energy and metals) in the world,advanced and emerging economies. To do so, the study considers country-by-country vector autoregression models and pool the results by taking weighted means for18 advanced economies and 19 emerging countries, as well as for the world (definedas the sum of advanced and emerging economies). The results show the following:(i) there is evidence in favour of partial pass-through from commodity prices to producer prices, although the evidence for the pass-through to consumer prices is lessevident; (ii) the pass-through in the world seems to be led by both advanced andemerging countries for producer prices and only by advanced economies for consumer prices; (iii) higher prices in the four categories (agricultural raw materialsonly in the short-run) induce significant higher producer prices in almost all cases,with shocks in the prices of energy and metals showing the largest effects; and (iv)energy prices explain the highest variability of producer and consumer prices.Keywords Commodity price pass-through · Producer prices · Consumer pricesJEL Classifications E31 · C32* Rebeca Jiménez‑Rodríguezrebeca.jimenez@usal.esAmalia Morales‑Zumaqueroamalia@uma.es1Department of Economics, University of Salamanca, Campus Miguel de Unamuno,37007 Salamanca, Spain2Department of Economics, University of Málaga, Campus El Ejido, 29071 Málaga, Spain13Vol.:(0123456789)
110R. Jiménez‑Rodríguez, A. Morales‑Zumaquero1 IntroductionIn the mid-2000s, commodity prices (specially, food and energy prices) experienced a sharp increase driving inflation up worldwide. This fact renewed theinterest in studying the relation between commodity prices and inflation. It hasbeen well established in the literature that commodity prices could affect inflationthrough the first-round effects, either the direct effects on consumers (e.g., moreexpensive energy bills) or the indirect ones on producers (e.g., higher productioncosts due to higher energy costs), and the second-round effects related to consumer and producer expectations that may impact negatively on consumption andinvestment (Castro et al., 2017; ECB, 2010).The related literature has highlighted different reasons why it may be relevantto analyse the relation between commodity prices and producer/consumer prices.Among them, we can point out the following: (i) monetary authorities may usecommodity prices as leading indicators of inflation (Ciner, 2011; Mossa, 1998)and so anticipate their monetary policies to counteract the negative impact thatchanges in commodity prices may have on the economy; (ii) higher commodity prices lead to higher production costs (Garner, 1989; Marquis & Cunningham, 1990), which may cause higher consumer prices if producers do not absorbtotally these changes in the costs and may also reduce investment of firms due tothese higher costs; (iii) higher commodity prices may reduce disposable incomeof consumers when producers transfer price pressure to consumers (FAO, 2017);and (iv) higher flexibility of commodity prices with respect to the price of othergoods and services allows them to adjust quickly after suffering a shock, but theimpact of such a shock on the price of other goods and services is long-lasting(Cheung, 2009), which gives rise to important consequences on real economicactivity.The previous empirical literature has mostly focused on analysing the macroeconomic effects of changes in commodity prices. The first strand of this literature has studied the impact of commodity price shocks on economic growth.Thus, commodity price changes seem to affect long-run economic growth, withcommodity price volatility increasing both uncertainty and risk, and so leading todecrease investment (UNCTAD, 2012). Countries that rely heavily on a commodity that shows high price volatility have more volatile terms of trade and so lessdirect investment, leading to less economic growth rates (Blattman et al., 2007;UNCTAD, 2012). In particular, previous evidence shows that commodity pricechanges particularly affect the economic growth rates in low-income countries(Bredenkamp & Bersch, 2012; International Monetary Fund, 2012; UNCTAD,2012).The second strand of the literature focuses on the effects of commodity priceson inflation. Thus, Blomberg and Harris (1995) analyse the link between commodity prices and consumer prices by considering five major U.S. commodityindices (the Commodity Research Bureau—CRB—spot index, the Journal ofCommerce index, the crude Producer Price Index—PPI, the National Association of Purchasing price index and the Federal Reserve Bank of Philadelphia’s13
Commodity price pass‑through along the pricing chain 111prices paid index) and three subgroups of commodities (gold, oil, food). Theyobtain that there is no long-run link between the level of commodity prices andthe level of consumer prices, but there is a connection between the level of commodity prices and the rate of consumer price inflation. Adams and Ichino (1995)study the effects of the prices of five primary commodity categories (agriculturalraw materials, beverages, foods, metals and petroleum) on inflation in the industrial world and they obtain that increases in commodity prices have little effecton inflation unless strong shocks happen in the commodity market. Ciner (2011)analyses contemporaneous and causal linkages between commodity prices (measured as the CRB commodity futures index, which includes 19 commodities inthe version 2005) and U.S. consumer inflation using domain statistical methods.His results show that there is a long-run positive relation between commodityprices and inflation. Cecchetti and Moessner (2008) and Liu and Weidner (2011)find that the second-round effects were very weak for a large number of countriesand, consequently, headline inflation tended to converge to core inflation. Hobijn(2008) studies the effects of grain and oil prices on the U.S. Personal Consumption Expenditures index of inflation for the period 2006–2008 and obtains thatthe impact is modest. Likewise, Ajmera et al. (2012) show the modest effects thatchanges in the price of four commodities (crops, animal slaughter and processing, dairy, and oil and natural gas) have on the overall U.S. Consumer Price Index(CPI) inflation over the period 2003–2008. Fernández (2014) considers four U.S.price indices (CPI Urban Consumers-All items, the U.S. CPI Urban ConsumerCommodities, the PPI Finished Goods and the PPI Crude Materials for Further Processing) and 31 commodity prices and she obtains that not only shocksin commodity prices can impact on aggregate price indices, but also shocks inaggregate price indices can impact on commodity prices. Chen et al. (2014)explore five small commodity-exporting countries under inflation targeting andobtain that commodity price aggregates have predictive power for their CPI andPPI inflation. Ramalhete-Moreira (2014) finds that changes in commodity pricesare important for explaining consumer inflation in developed and emerging countries. Finally, Sekine and Tsuruga (2016) examine the effects of commodity priceson headline inflation by using a panel of 144 countries and find that the effects ofcommodity price shocks on inflation are transitory, giving support to the smallrole of the second-round effects on inflation.Within the second line of the literature, we find authors who explicitly study thedegree of commodity price pass-through to inflation. For example, De Gregorioet al. (2007) study the pass-through from oil prices to the general price level for 34countries and conclude that the pass-through has fallen worldwide during the last30 years. Chen (2009) analyses the oil price pass-through to inflation for 19 industrialized countries and obtains evidence in favour of a decline in the oil price passthrough. Rigobon (2010) analyses the pass-through from commodity prices to retailprices using micro price data for 50 countries. His results show that the response ofcountries to shocks is different and that sectors respond differently across countriesand commodities, with sectoral characteristics explaining a third of all the explainedvariation. Ferrucci et al. (2012) analyse the pass-through of food commodity pricesto final consumer prices in the euro area and obtain that commodity prices are the13
112R. Jiménez‑Rodríguez, A. Morales‑Zumaqueromain determinant of the increase in CPI and PPI. Gelos and Ustyugova (2017)consider a broad range of structural characteristics and policy benchmarks in 31advanced and 60 emerging and developing countries, and obtain that countries withhigher food shares in CPI baskets, fuel intensities, and with previous high inflationlevels were more susceptible to develop inflationary effects from commodity pricesshocks. More recently, Comunalea and Simolab (2018) study the pass-through ofnominal exchange rates and commodity prices to consumer prices in the Commonwealth of Independent States (CIS) and obtain that the pass-through of commodityprices is explicitly significant. This paper contributes to this specific strand of theliterature.It is our aim to provide new evidence on the pass-through of commodity pricesto producer and consumer prices. In doing so, we study the commodity price passthrough along the pricing chain for the global commodity price index and the indicesof its main categories (agricultural raw materials, food and beverages, energy andmetals) in the world, advanced and emerging economies by estimating country-bycountry VAR models and pooling the results by taking weighted means for the corresponding group of countries. Notice that we use individual countries’ PPI and CPIindices and country-specific commodity price indices with time-varying weights.The contribution of this paper could be summarized in answering the next fourkey questions: (i) is the degree of commodity price pass-through to producer andconsumer prices similar in advanced and emerging economies?; (ii) which groupof countries (advanced or emerging countries) is leading the pass-through in theworld?; (iii) do energy prices have the most important consequences on producerand consumer prices?; and (iv) which category of the global price index of all commodities (i.e., agricultural raw materials, food and beverages, energy and metals)exhibits higher effects?The rest of the paper is organized as follows. Section 2 describes the data and theeconometric methodology. Section 3 presents the estimation results. Finally, Sect. 4includes the concluding remarks.2 Data and methodology2.1 DataThe new database from International Monetary Fund (IMF) Commodity Termsof Trade (https:// data. imf. org/? sk 2CDDC CB8- 0B59- 43E9- B6A0- 59210 D5605 D2) provides a new aggregate commodity price index, which is country-specific.1In particular, country-specific commodity price indices (including export, import,and terms-of-trade indices) are reported for different economies.2 For each country,1Following the suggestion of a referee, we use country-specific commodity price indices instead ofaggregate commodity price indices provided by the IMF Primary Commodity Prices database.2See Gruss and Kebhaj (2019) for technical details.13
Commodity price pass‑through along the pricing chain 113Gruss and Kebhaj (2019) consider that the change in the international real price ofup to 45 individual commodities (which are divided into four different categories:agricultural raw materials, food and beverages, energy and metals)3 is weightedusing commodity-level trade data and they provide two variants for each index, oneconsidering time-invariant weights and other using time-varying weights.It is worth mentioning that the IMF Primary Commodity Terms of Trade database provides country-specific commodity price indices, but it does not provide suchindices by categories. However, Bernard Gruss and Suhaib Kebhaj have graciouslyprovided us with data of country-specific commodity price indices by categories.This has allowed us not only to analyse the commodity price pass-through along thepricing change at the aggregate level, but also at the disaggregate level.Therefore, we consider 37 countries (18 advanced countries and 19 emerging countries; all shown in Table 1)4 and we use the country-specific commodity export5 price index (calculated by using individual commodities weighted bythe ratio of exports to total commodity exports and with time-varying weights) asthe global price index of all commodities that are internationally traded. Additionally, we consider its main four categories: (i) agricultural raw materials export priceindex (obtained by using eight individual commodities—cotton, hard logs, hardsawnwood, hides, natural rubber, softlogs, soft sawnwood, and wool—weightedby the ratio of exports to total commodity exports and with time-varying weights)(ii) food and beverages export price index (obtained by using twenty-five individualcommodities—bananas, barley, beef, cocoa, coffee, corn, fish, fish meal, groundnuts, lamb, olive oil, oranges, palm oil, poultry, rapeseed oil, rice, shrimp, soybeanmeal, soybean oil, soybeans, sugar, sunflower seed oil, swine meat, tea, and wheat—weighted by the ratio of exports to total commodity exports and with time-varyingweights); (iii) energy export price index (obtained by using three individual commodities—coal, crude oil, and natural gas—weighted by the ratio of exports to totalcommodity exports and with time-varying weights); and (iv) metals export priceindex (obtained by using nine individual commodities—aluminum, copper, gold,iron ore, lead, nickel, tin, uranium, and zinc—weighted by the ratio of exports tototal commodity exports and with time-varying weights).6Given that our aim is both to analyse how commodity price shocks are transmitted to producer and consumer prices at the global level and to compare such a passthrough in advanced countries versus the one in emerging economies, we analyse3See Table A2 of Gruss and Kebhaj (2019), where the list of individual commodities included in eachcategory is provided, as well as the detailed price source for each commodity.4Table 1 includes the countries considered and their shares in total world gross domestic product (GDP)at purchasing power parities (PPP). Thus, the reported share for each country is the average weight ofthe country’s GDP in the global GDP based on PPP over the longest available sample at IMF dataset(World Economic Outlook, October 2020) (https:// www. imf. org/ en/ Publi catio ns/ WEO/ weo- datab ase/ 2020/ Octob er).5Following the related literature, we consider the commodity export price index. However, the empiricalanalysis developed in this paper has been also replicated for the commodity import price index. Resultsare highly similar and are available upon request.6It is worth mentioning that all commodity prices used are country-specific and are calculated by usingtime-varying weights.13
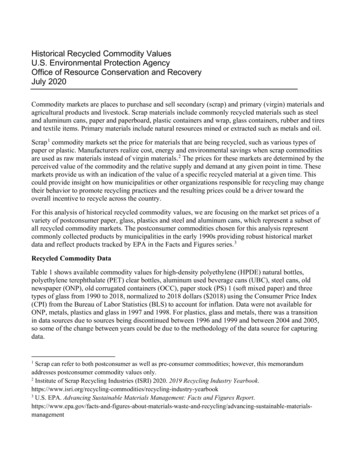
46AustraliaAustriaBelgiumCanadaCzech rging countries31.373TurkeyThailandSouth AfricaRussiaPolandPhilippinesPeruMexicoEmerging hares (PPP)100World (considered as Advanced Emerging countries)82.066World (considered as Advanced Emerging 3280.2013.2840.897Shares (PPP)IndonesiaIndiaHungaryCosta ing CountriesEmerging CountriesShares (PPP)Note: This Table presents the countries considered and their shares in total world GDP at PPP, with the share for each country being the average weight of the country’sGDP in the global GDP based on PPP over the longest available sample at IMF dataset (World Economic Outlook, October 2020). Moreover, this Table shows the weightsby group of countriesTotal weightsAdvanced countriesPanel C: Normalized weights by group of countriesTotal rlandsKorea (South)Advanced CountriesAdvanced countriesPanel B: Weights by group of countriesShares(PPP)Advanced CountriesPanel A: Shares by countriesTable 1 Countries and weights114R. Jiménez‑Rodríguez, A. Morales‑Zumaquero
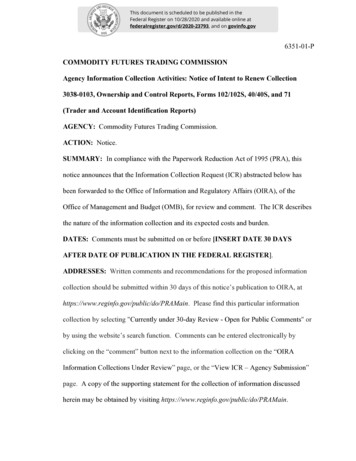
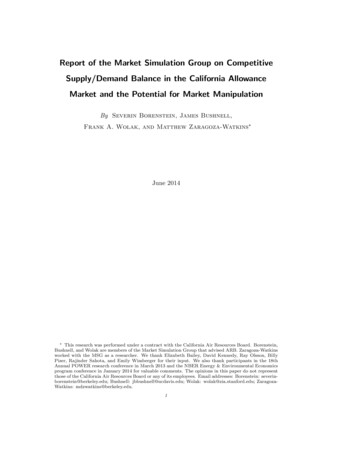
Commodity price pass‑through along the pricing chain 115each individual country included in Table 1 by running country-by-country VARmodels and pool the results by taking weighted means for advanced countries andemerging countries, as well as for the world.7 In doing so, we need to consider theproducer and consumer price indices of each country. The database of Global Economic Indicators (DGEI) developed by the Federal Reserve Bank of Dallas (https:// www. dalla sfed. org/ insti tute/ dgei) contains the Headline Consumer Price Index(CPI) and Producer Price Index (PPI) (or Wholesale Price Index, WPI)8 for theworld (excluding the U.S.), the advanced (excluding the U.S.) countries, the U.S. andthe emerging economies.9 However, this database does not provide the individualcountry data, but Enrique Martínez-García and his colleagues at the Federal ReserveBank of Dallas have graciously provided us with such data. This ensures both thegood quality of the data and the consistency of the way the data are calculated.Table 2 shows the available sample of each country for the different variablesconsidered in levels.2.2 MethodologyWe follow the approach used by Furlong and Ingenito (1996) and Ferrucci et al.(2012) to study the pass-through along the pricing chain by considering a VARmodel. In doing so, we run country-by-country 12th-order VAR models for theglobal price index of all commodities and its main four categories (agricultural rawmaterials, food and beverages, energy and metals). We pool the results for the globalprice and its main categories by taking weighted means10 for advanced countriesand emerging countries, as well as for the world.The reduced-form of the VAR model may be written as:Yt c 12 Φj Yt j 𝜀tj 1where Yt is a (3 1) vector of endogenous variables (containing the first log-differences of the corresponding country-specific commodity price index and the firstlog-differences of both producer and consumer price indices), c is (3 1) interceptvector, Φj is the jth (3 3) matrix of autoregressive coefficients, and 𝜀t is the (3 1)generalization of a white noise process with variance–covariance matrix Ω.7We would like to thank a referee for suggesting to use country-by-country estimation and pool theseresults instead of using directly aggregate data.8It is worth noting that the DGEI dataset mixes producer and wholesale prices. Grossman et al. (2013)state “The WPI differs from the PPI because it includes domestically produced goods sold in the homemarket (also included in the PPI) and imported goods (which are excluded from the PPI). WPI excludesprices of exported goods (which are included in the PPI). WPI also measures purchasers’ prices—including transportation costs, sales taxes, and VAT—while PPI measures sellers’ prices at the factory.”.9DGEI reports data that have been seasonally adjusted by X12-ARIMA method (see Grossman et al.,2013).10The weights used to pool the results are those included in Table 1.13
116R. Jiménez‑Rodríguez, A. Morales‑ZumaqueroTable 2 Sample periodCountryCountry-specificcommodity priceindicatorsCPIPPI/WPICommon ch 020M8Korea 0M81980M1-2020M8United Kingdom 0M8United 020M81999M6-2020M8Costa 80M1-2020M91980M2-2019M11 12-2020M8 -2020M8Russia1992M1-2020M101990M12-2020M8 1997M12-2020M8 1997M12-2020M8South 0M81986M1-2020M81986M1-2020M8Note: This Table shows the available sample period for each variable in levels and each country, as wellas the common sample for each particular country13
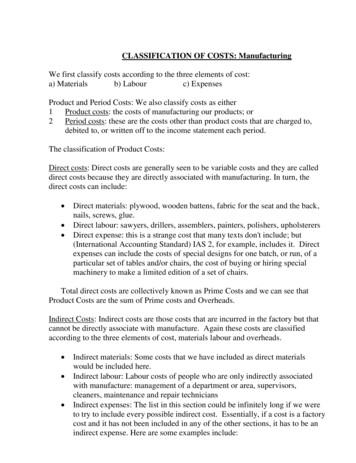
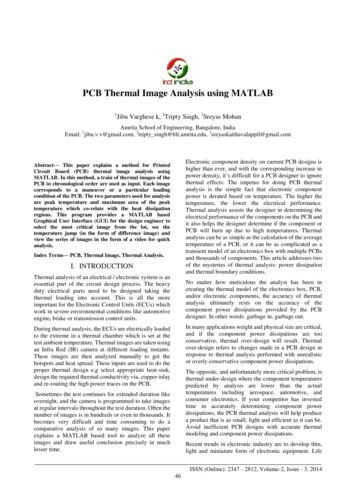
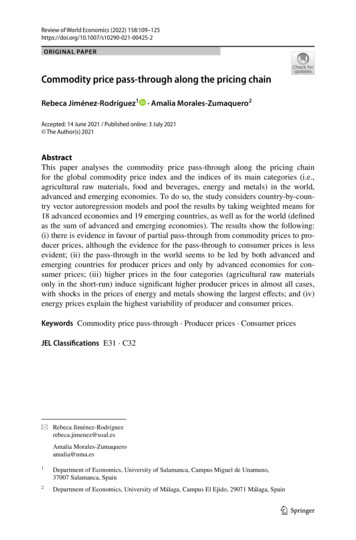
Commodity price pass‑through along the pricing chain 117We identify the model by means of the Cholesky decomposition, which is equivalent to using exclusion restrictions on the contemporary impact of structural shocks(i.e., variables that come before in the order affect the following variables both contemporaneously and with lags, while variables that come after only affect the previous variables with lags). We consider an order of the variables consistent withthe pricing chain assumption (i.e., commodity price, producer price and consumerprice).11 Thus, it is assumed that changes in commodity prices have an immediateimpact on producer and consumer prices, but commodity prices are contemporaneously exogenous considering that they can start to be influenced by shocks inproducer and consumer prices with a delay of a month, which is not excessivelyrestrictive.12We calculate the impulse responses of producer and consumer prices to a 1%shock in the corresponding commodity price and their corresponding 95% confidence bands by means of Monte Carlo with 20,000 simulations. Moreover, weobtain the forecast error variance decomposition of producer and consumer prices.As was mentioned, the country-by-country results (available upon request) havebeen pooled taking weighted means for advanced and emerging countries, as wellas for the world. We establish that a response is statistically significant in the pooledresults when it is for at least 50% of the weighted responses in each group of countries considered.3 Empirical resultsThis section reports both the commodity price pass-through along the pricing chain(which is measured as the cumulated impulse response of producer and consumerprices to a 1% increase in the corresponding commodity price) and the percentage ofthe unanticipated changes of producer and consumer prices attributed to the corresponding commodity price shock at different time horizons. Thus, Table 3 displaysthe estimated commodity price pass-through to producer and consumer prices forthe global price index and the indices of its main categories in the world, advancedand emerging economies, while Table 4 shows the fraction of the estimated forecasterror variance attributed to the corresponding commodity price shock in each groupof countries studied.Higher global price of all commodities leads to significantly higher producerprices in the world and in both advanced and emerging countries, with the passthrough not being complete. In particular, we observed that the short-run impact(i.e., the impact 3 months after the shock) of a 1% increase in the global price ofall commodities on producer prices is around 0.15% for all groups of countries11As a robustness check, we also consider generalized impulse response functions, which provide usefulinformation on how commodity price shocks affect domestic prices without establishing any prior aboutthe ordering of the variables. The results (available upon request) are basically the same.12For instance, Lee and Ni (2002) assume that oil prices are not contemporaneously influenced by otherU.S. macroeconomic variables. Likewise, Hahn (2003) considers this assumption for the euro area as awhole.13
118R. Jiménez‑Rodríguez, A. Morales‑ZumaqueroTable 3 Commodity Price Pass-through to PPI and CPIGlobalAll 850.0055-0.0089-0.0152Agricultural raw materialsFood and eousAfter 3 monthsAfter 6 monthsAfter 12 monthsA er 18 monthsA er 24 monthsA er 36 monthsA er 60 monthsAfter 3 monthsAfter 6 monthsAfter 12 monthsA er 18 monthsA er 24 monthsA er 36 monthsA er 60 monthsAdvanced economiesAfter 3 monthsAfter 6 monthsAfter 12 monthsA er 18 monthsA er 24 monthsA er 36 monthsA er 60 monthsAfter 3 monthsAfter 6 monthsAfter 12 monthsA er 18 monthsA er 24 monthsA er 36 monthsA er 60 monthsEmerging economiesAfter 3 monthsAfter 6 monthsAfter 12 monthsA er 18 monthsA er 24 monthsA er 36 monthsA er 60 monthsAfter 3 monthsAfter 6 monthsAfter 12 monthsA er 18 monthsA er 24 monthsA er 36 monthsA er 60 monthsNote: This Table presents the commodity price pass-through to PPI/CPI, which is measured as the cumulated impulse response of PPI/CPI to a 1% increase in commodity prices. A blue slanted number meanslack of significance (i.e., the cumulated response is not statistically significant at the 5% significancelevel)(i.e., the world, advanced and emerging economies). The cumulated effects inthe mid-run (i.e., the impact 12 months after the shock) are around 0.18% in theworld and advanced countries and about 0.13% in emerging countries. After oneyear, the impact gradually diminishes over time, even being statistically insignificant 60 months after the shock in emerging economies. Furthermore, whilst consumer prices also increase significantly after a hike in the global price, there is nostatistically significant impact on consumer prices in the emerging countries. Therefore, there seems that producers do not transmit the price pressures to consumersin emerging economies and they do only partially13 in advanced economies and in13It is considered that there is a complete pass-through from producer prices to consumer prices after ashock in commodity prices when the effect of such a shock on producer prices is almost equal to the oneon consumer prices.13
Commodity price pass‑through along the pricing chain 119Table 4 Variance decompositionGlobalAll commoditiesCategoriesAgriculturalraw materialsFood and bever- EnergyagesMetalsWorldPPI3-period horizon30.92744.98385.127732.336911.93536-period on31.20166.96188.009232.659815.4911CPI 3-period horizon14.95862.28143.144418.85894.53276-period 5.58964.22075.362419.92377.029060-periodh
agricultural raw materials, food and beverages, energy and metals) in the world, advanced and emerging economies. To do so, the study considers country-by-coun-try vector autoregression models and pool the results by taking weighted means for 18 advanced economies and 19 emerging co