Transcription
INTERNATIONAL JOURNAL OF MARKETING,FINANCIAL SERVICES & MANAGEMENT RESEARCHOnline Available at indianresearchjournals.comVol.1 No. 6, June, ISSN 2277 3622DEVELOPING OPTION STRATEGIES BY USING TECHNICALANALYSIS: A CASE STUDY OF AUTOMOBILE SECTORDR. N MARUTI RAOAssociate Professor, PG Dept. of Business Administration, Rani Channamma University, BelagaviABSTRACTDuring last one decade there was a rapid growth of derivatives market in India in terms of trading volume,number of stock options available for trading, participation of investors in derivatives market. It was alsoobserved that retail investors are showing lot of interest in the derivatives market. However, retail investors havelost lot of money in the derivatives market due to lack of knowledge about the product and investment strategiesetc. The risk involved in stock option trading can be minimized / return on stock option trading can beimprovised through designing suitable investment strategies such as bull spread, bear spread, butterfly spread,strips, strap, strangle, straddle, etc. But, the fact is that simply selecting best of the option strategies does not helpinvestors to minimize risk or maximize profit, due care should be taken while selecting strike price, expirationdate and premium rates. So, investors need to develop risk management as well as risk analysis tool which is thekey to limiting option risk/ maximizing profit. In the backdrop of this a study has been conducted to developinvestment strategies for retail investors by using technical analysis. Auto industry was selected for the purpose ofthe study. Major auto companies which are part of option segment were selected i.e. Tata Motors, Maruti SuzukiIndia and Mahindra and Mahindra. The data required for the study was collected from Bombay Stock Exchangeand National Stock Exchange. The data collected were analysised by using Exponential Moving AverageMethod, charts, etc. The paper makes an attempt to enumerate how Exponential Moving Average Method can beused in selection of stock option strategy in order to manage risk associated with investment in stock optionmarket. A few managerial implications of this study are as stated under: wise investment decision, Enhancingreturn on investment, hedging, etc.Keywords: Close Price, Exponential Moving Average Price, Option Price and Option strategies.INTRODUCTIONDuring last one decade there was a rapid growth of derivatives market in India in terms of trading volume, number ofstock options available for trading, participation of investors in derivatives market. It was also observed that retailinvestors are showing lot of interest in the derivatives market. However, retail investors have lost lot of money in thederivatives market due to lack of knowledge about the product and investment strategies etc. The risk involved in stockoption trading can be minimized / return on stock option trading can be improvised through designing suitableinvestment strategies such as bull spread, bear spread, butterfly spread, strips, strap, strangle, straddle, etc. But, the factis that simply selecting best of the option strategies does not help investors to minimize risk or maximize profit, due careshould be taken while selecting strike price, expiration date and premium rates. So, investors need to develop riskmanagement as well as risk analysis tool which is the key to limiting option risk/ maximizing profit. There are number ofrisk management and analysis tools available, which help investors to take wise investment decisions. One of thepopular tools which is widely used by technical analyst is Exponential Moving Average Method (EMAM) which helpsto predict future movement in stock price. If the investor uses technical analysis as a means to select stock option strategyand strike price then it possible to minimize risk / maximize profit on stock option trading. In the backdrop of this astudy has been conducted to develop investment strategies for retail investors by using technical analysis. The papermakes an attempt to enumerate how Exponential Moving Average Method can be used in selection of stock option94
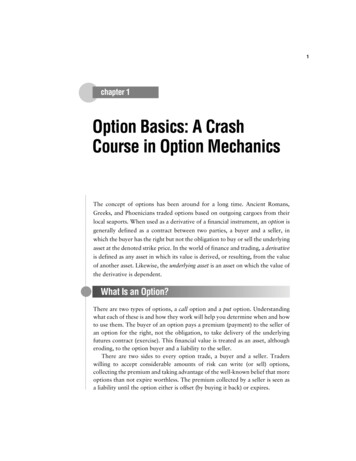
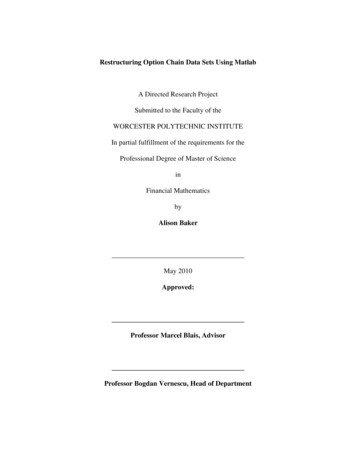
DR. N MARUTI RAOstrategy in order to manage risk associated with investment in stock option market. A few managerial implications ofthis study are as stated under: wise investment decision, Enhancing return on investment, hedging, etc. Auto industrywas selected for the purpose of the study. Major auto companies which are part of option segment were selected i.e. TataMotors, Maruti Suzuki India and Mahindra and Mahindra. The data required for the study was collected from BombayStock Exchange and National Stock Exchange. The data collected were analysised by using Exponential MovingAverage Method, charts, etc.ABBREVIATIONEMAP: Exponential Moving Average PriceBSE: Bombay Stock ExchangeNSE: National Stock ExchangeObjectives of Study1) To develop stock option strategy for auto stock2) To develop a model for selecting stock option strategy.3) To offer suggestions to retail investorsMethodology Auto industry was selected for the purpose of the study. Major auto companies which are part ofoption segment were selected i.e. Tata Motors, Maruti Suzuki India and Mahindra and Mahindra. The data required forthe study was collected from Bombay Stock Exchange and National Stock Exchange. The stock prices of auto stocktraded in Bombay Stock Exchange from 2nd January to 10th February 2012 were collected. The option price and strikeprice were collected from National Stock Exchange. The data collected were analysised by using Exponential MovingAverage Method, charts, etc. Predicting future price of stockTata Motors Ltd.Tata Motors Ltd is a market leader in auto industry. Tata Motors is available for option trading both in NSE with lot sizeof 500 units. Exponential Moving average price of the Tata Motors has been calculated based on 10 days moving period.Chart - 195
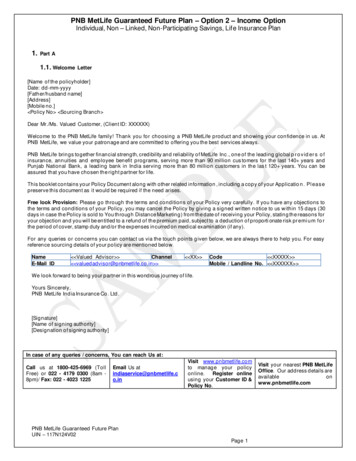
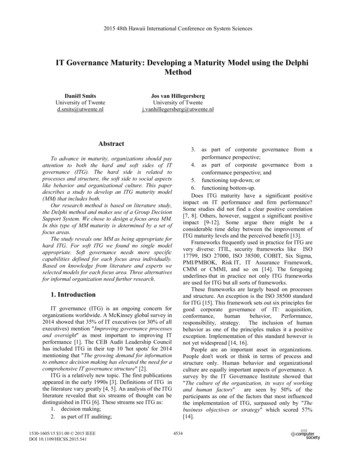
DEVELOPING OPTION STRATEGIES BY USING TECHNICAL ANALYSIS: A CASE STUDY OF AUTOMOBILE SECTORIt is evident from the chart 1 that the EMAP of Tata Motors has not intersected with close price during the period underreference. If we assume that prior to 2nd January 2012, both EMAP and close price have intersected and thereafterEMAP of Tata Motors is started moving in upward direction as it is visible from the chart then it is possible to predictabout future movement of price. The EMPA curve is moving in upward direction therefore the price of Tata Motors isexpected to move in upward direction.Selection of Option strategyAs price of Tata motors is expected to go up moderately in the near term, it is suggested for investor to design Bull PutSpread strategy as it will helps them to book profit/hedge risk. On 10th February 2012, the stock option price and strikeprice quoted for Tata Motors Ltd (lot size: 500) in NSE option segment are given:Underlying asset: Tata Motors LtdExpiration Date: 23rd March 2012Option Type: PutStrike price120130135140145150Option Price4.0035.6039.6044.2548.7048.50Bull Put Spread StrategyBuy 120, 1 Put on Tata Motors at Rs. 4.00 Sell 150, 1 Put on Tata Motors at 48.50Chart -2The chart-2 exhibits that the bull put spread strategy will ensure a maximum profit of Rs. 89000 if the spot price of TataMotors moves in upward direction as per the forecast.Maruti Udyog Ltd.Maruti Udyog Ltd is one of the leading players in the auto industry. Maruti Udyog is available for option trading both in96
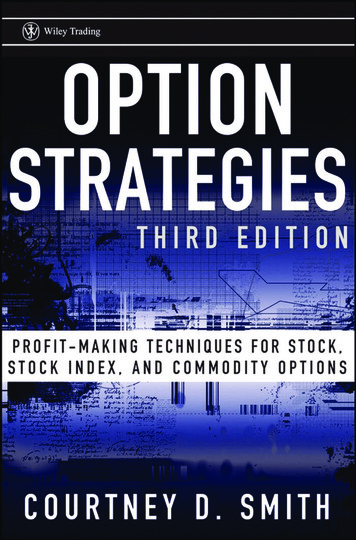
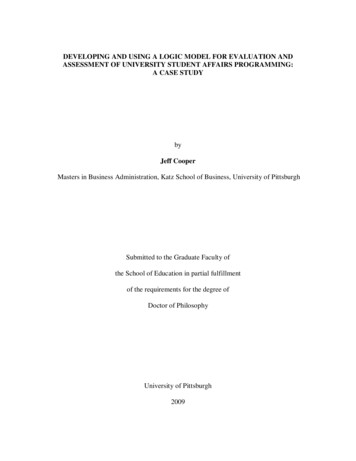
DR. N MARUTI RAONSE with lot size of 250 units. Exponential Moving average price of the Maruti Udyog has been calculated based on 10days moving period.It is evident from the chart -3 that the EMAP of Maruti Udyog has not intersected with close price during the periodunder reference. If we assume that prior to 2nd January 2012, both EMAP and close price have intersected andthereafter EMAP of Maruti Udyog is started moving in upward direction as it is visible from the chart then it is possibleto predict about future movement of price. The EMPA curve is moving in upward direction therefore the price of stockwill move in upward direction.Chart -3Selection of Option strategyPrice of Maruti Suzuki India Ltd expected to go up moderately in the near term; therefore investors have an opportunityto use any of the following option strategy to book profit / hedge risk: a) long call option b) naked put option, c) bullput spread. On 10th February 2012, the stock option price and strike price quoted for Maruti Suzuki India ltd in NSEoption segment are given below:Underlying asset: Maruti Suzuki India LtdExpiration Date: 23rd March 201297
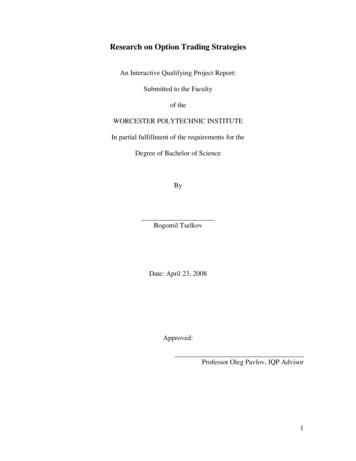
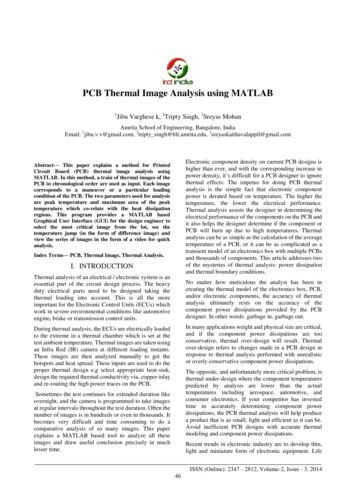
DEVELOPING OPTION STRATEGIES BY USING TECHNICAL ANALYSIS: A CASE STUDY OF AUTOMOBILE SECTORChart - 4 : Payoff from Bull Put SpreadIt can be understood from chart -4 that the bull put spread strategy helps investor to book profit if the price ofMaruti Suzuki India Ltd reaches to Rs.1200 and above in the cash market. The total payoff from this strategy is Rs.750if the spot price of underlying asset reaches to Rs.1200 and Rs.25750 if the spot price reaches to Rs.1300.Chart -5: Payoff from Long Call98
DR. N MARUTI RAOIt is evident from the chart -5. that the long call strategy helps investor to book profit if the price of Maruti Suzuki IndiaLtd moves to Rs.1180 and above in the cash market. The total payoff from this strategy is Rs.2000 if the spot price ofunderlying asset reaches to Rs.1200 and Rs.32000 if the spot price reaches to Rs.1300.Chart -6: Payoff from Naked PutIt is clear from the chart -6. that the Naked put strategy can helps investor to book profit if the price of MarutiSuzuki India Ltd moves to Rs.1260 and above in the spot market. The total payoff from this strategy is Rs 4000 if theprice of underlying asset moves to Rs.1200 and Rs.14000 if the spot price moves to Rs.1300.The analysis of chart-4, 5 and 6, reveals that investors should design long call strategy as this strategy helps them tomaximise profit compared to other option strategy.Mahindra and MahindraMahindra and Mahindra is also one of the major players in the auto industry. Mahindra and Mahindra is available foroption trading both in NSE with lot size of 500 units. Exponential Moving average price of the Mahindra andMahindra has been calculated based on 10 days moving period.Chart -799
DEVELOPING OPTION STRATEGIES BY USING TECHNICAL ANALYSIS: A CASE STUDY OF AUTOMOBILE SECTORIt is evident from the chart -7 that the EMAP of Mahindra and Mahindra has intersected with close price on 10thFebruary 2012 and started moving downward direction signalling that price of stock will move in downward directionin the near future.Selection of Option strategyPrice of Mahindra and Mahindra expected to move in downward direction; therefore investor has an opportunity to useany of the following option strategy to book profit / hedge risk: a) naked call option b) bear call spread, c) bear putspread. On 10th February 2012 the stock option price and strike price quoted for Mahindra and Mahindra Ltd in NSEoption segment are given below:Underlying asset: Mahindra and MahindraExpiration Date: 23rd March 2012Payoff from Naked call optionBasket IStrike Price: 640Call Option Price: 47.50Chart -8100
DR. N MARUTI RAOBasket IIStrike Price: 660Call Option Price: 39Chart- 9Basket IIIStrike Price: 680Call Option Price: 25.65Chart 10The analysis of charts 8, 9 and 10 reveals that it is advantageous for investors to sell call option with strike price of 680 atRs. 25.65 rather than selling call option with strike price of 660 and 640. The short position on call option with strikeprice of 660 will fetch the investors Rs.19500 if the spot price moves as per the technical analysis.101
DEVELOPING OPTION STRATEGIES BY USING TECHNICAL ANALYSIS: A CASE STUDY OF AUTOMOBILE SECTORPayoff from Bear Call SpreadBuy call option 800 at Rs. 1.20Sell call option 640 at Rs.47.50It is evident from the chart -11 that the bull call spread strategy can helps investor to book a minimum profit of 4350 anda maximum profit of 24350 if the spot price moves in downward direction as per forecastChart 11Payoff from Bear Put SpreadBuy call option 720 at Rs. 23.60Sell call option 680 at Rs.16.35It is evident from the chart -12 that the bull put spread strategy can helps investor to book minimum profit of 1375and a maximum profit of 16375 if the spot price moves in downward direction as per forecast.Chart 12102
DR. N MARUTI RAOThe analysis of above table reveals that it is very safe and profitable for investor to design the bull put spread strategyas it will ensure maximum and constant profit if the spot price of Mahindra and Mahindra moves to Rs.660/670/680.Conclusion Investors in option market can use Exponential Moving Average Method for selecting option strategiesand strike price and option premium which may be of immense help to them in hedging risk associated with investmentin option market but also helps in maximising profit if prices of underlying stock moves in a direction as per theprediction made by using EMAM.REFERENCES1) John Hull, "Options, Futures, and Other Derivatives, Prentice Hall, 2011.2) John Person, technical analyst, Daniels Trading, "Moving Average Formula & Strategy Guide".3) Raman Kumar, Atulya Sarin and Kuldeep Shastri, "The Impact of Options Trading on the Market Quality of theUnderlying Security: An Empirical Analysis" The Journal of Finance, Volume III, No.2, April 19984) Sandeep Srivastava, Surendra S Yadav, and P K Jain, "Significance of Non-Price Variables in Price Discovery: anEmpirical Study of Stock Option Market in India", Vikalpa, volume.33, No 2, April-June 2008.5) Zhang, Jin E. "A lattice algorithm for pricing moving average barrier options"6) Journal of Economic Dynamics and Control, Volume, 34, 2010, Pp: 542-554.103
DEVELOPING OPTION STRATEGIES BY USING TECHNICAL ANALYSIS: A CASE STUDY OF AUTOMOBILE SECTOR 100. Basket II Strike Price: 660 Call Option Price: 39 Chart- 9 Basket III Strike Price: 680 Call Option Price: 25.65 Chart 10 The analysis of charts 8, 9 and 10 reveals that it is advantageous for investors to sell call option with strike price of 680 at Rs. 25.65 rather than selling call option