Transcription
CANADA’S ELECTRICITYINDUSTRY
Table of Contents Table of ContentsThe Canadian Electricity Association (CEA)CEA’s Corporate Utility MembersCEA Corporate Partners Program MembershipCEA Mission StatementCEA Strategic GoalsCanada’s Multi-Jurisdictional EnvironmentCanada’s Market StructureNorth American Electric Reliability Corporation(NERC) RegionsElectricity Demand in Canada by Sector, 2014Electricity Demand in Canada by Sector, 1990 - 2014Electricity Generation in Canada by Fuel Type, 2014Electricity Generation in Canada by Fuel Type, 1990- 2014Electricity Generation in Canada by Province andFuel Type, 2014Canada-US Electricity Trade Volume, 1990 – 2014Canada-US Natural Gas Trade Volume, 1990 – 2014Canada-US Natural Gas Trade Volume, 1998 – 2014Canada-US Electricity Trade Revenue, 1990 – 2012Canada-US Natural Gas Trade Revenue, 1990 – 2014Canada-US Natural Gas Trade Revenue, 2002 – 2015Canada-US Natural Gas Export/Import prices, 2002– 2015Canada-US Electricity Export/Import prices, 1997 –2014Canada-US Natural Gas and ElectricityExport/Import pricesCanada-US Electricity Trade – 2014 (GWh)Electricity Export and Imports between Canada andU.S. (2014)Major Canada-U.S. Transmission InterconnectionsManitoba-Minnesota Grid ConnectionsU.S. Canada Electricity Trade VolumePage 2 Major Canada-U.S. Transmission Interconnections Utility Investment in Canada’s Transmission &Distribution Cables & Lines, 1998 - 2010 Electric Power Generation, Transmission andDistribution Sector Contribution to Canada’s GDP,1990 – 2012 Capital Investment in Canada’s Electric PowerSector, 1990 – 2012 Electric Sector Environmental ProtectionExpenditures by type, 2012 Environmental Protection Expenditures by theElectric Power Sector, 1996 – 2012 Greenhouse Gas (GHG) Emissions in Canada bySector, 2014 Greenhouse Gas (GHG) Emissions in Canada forEnergy Sector, 2014 Nitrogen Oxide (NOx) Emissions in Canada bySources, 2014 Sulphur Oxide (SOx) Emissions in Canada bySources, 2014 Electric Sector Sulphur Oxide (SOx) Emissions inCanada, 1990 - 2014 Mercury Emissions in Canada by Sources, 2014 Electric Sector Mercury Emissions in Canada, 1990- 2014 Particulate Matter (PM2.5) Emissions in Canada bySources, 2014 Electric Sector Particulate Matter (PM) Emissions inCanada, 1990 - 2014 2014 CO2 Electricity Emissions and Intensity inCanada Utility Generated Electricity by Source and GHGemissions, 1990-2013 Factors Contributing to GHG emissions, 1990-2014 Factors Contributing to GHG emissions, 2005-2014 Greenhouse Gas (GHG) Emissions in Canada andthe US by Sector, 2014 Electricity Generating Capacity in the US andCanada by Fuel Type,1 2014 Electricity Generation in the US and Canada by FuelType,1 2014 Building the Next Generation of Infrastructure:Capital Investment Requirements Active MPMO Electricity Sector Projects Active MPMO Electricity Sector Projects – indirectrelevance Active MPMO Electricity Sector Projects - New Canada’s Regulatory Regime for Large EnergyProjects Average Residential Electricity Price in Canada,1998 – 2014 (cents/kWh) Selected World Residential Electricity Prices, 2014 Selected World Industrial Electricity Prices, 2014 The Percentage Change in Household Expenditures2000-2013 Canada’s Future Residential Electricity Needs Low Emission and Sustainable Technologies Usedfor Electricity Generation in Canada Canadian Electricity Statistics Installed Wind Capacity in Canada as of April 2013 Existing Coal Facilities in Canada – End of Life andRegulatory Shut Down Proposed Regulations to address GHG emissionsfrom coal-fired electricity The CEA Councils Vision 2050 CEA Sustainability Program Energy Efficiency Smart Grid Economic Value Electricity in Canada at a Glance For More Information.
The Canadian Electricity Association (CEA) Founded in 1891, the Canadian Electricity Association is thenational forum and voice of the evolving electricity business inCanada. Mission Statement: A safe, secure, reliable, sustainable andcompetitively-priced supply of electricity is essential to Canada’sprosperity.Page 3
CEA’s Corporate Utility MembersPage 4
CEA Corporate Partners ProgramMembershipPage 5
CEA Corporate Partners ProgramMembershipPage 6
CEA Mission StatementA safe, secure, reliable, sustainable andcompetitively priced supply of electricity is essentialto Canada’s prosperity. CEA is the voice of theCanadian electricity industry, promoting electricityas the critical enabler of the economy andCanadians’ expectations for an enhanced quality oflife.Page 7
CEA Strategic GoalsInfrastructure – Ability to build needed electricity infrastructure, to meet growingdemand and replace aging assets.Energy Efficiency – Ability to provide options to customers to assist them in usingelectricity more efficiently, manage costs and minimize environmental impacts.Technology – Ability to maximize and deploy leading-edge technologies.Regulation – Need for more coordinated, effective and efficient regulatory regimeswithin and between governments, and more timely decisions.Environment – Need for holistic approach and greater regulatory coherence onenvironmental issues.Security – Need to ensure the long-term security, reliability and stability of theelectricity system.Page 8
Canada’s Multi-JurisdictionalEnvironmentJurisdictional Division of ResponsibilityProvincial/Territorial Governments Page 9Resource management withinprovincial boundariesIntra-provincial trade and commerceIntra-provincial environmentalimpactsGeneration and transmission ofelectrical energyConservation and demand responsepoliciesFederal Government Resource management on frontierlands Nuclear safety Inter-provincial and international trade Trans-boundary environmentalimpacts Environmental impacts where federallands, investment or powers apply Codes, standards and labeling relatingto conservation and demand Other policies of national interest
Electricity Market Structures in CanadaSaskatchewan Wholesale openaccess Vertically-integratedCrown corporationAlberta Mandatory Power Pool Wholesale & retail open accesssince 2001 Fully competitive wholesale marketBC Wholesale & industrialopen access Vertically-integratedCrown corporation serves94% of customersPage 10Manitoba Wholesale open access Vertically-integrated CrowncorporationOntario Industry unbundling in 1998 Wholesale & retail open accesssince 2002 Hybrid regulation and competitionmodelQuébec Wholesale open access Vertically-integrated Crowncorporation Expanding IPP developmentPEI Procures electricityfrom New Englandmarket and longterm contracts withNew BrunswickNew Brunswick Wholesale openaccess Vertically-integratedCrown corporationNewfoundland Verticallyintegrated Crowncorporation andinvestor-owneddistribution utilityNova Scotia Wholesale openaccess Investor-ownedutility regulated oncost-of-service
North American Electric ReliabilityCorporation (NERC) RegionsPage 11
Electricity Demand in Canada by Sector,2014TotalElectricity Demand in Canada, 2014 491.22 TWhResidential33%Commercial ic Administration3%Industrial43%*Numbers may not sum to 100 percent due to roundingSource: Statistics Canada, Catalogue no 57-003-X, Report on Energy Supply and Demand in Canada, 2014 preliminaryUpdated August, 2016Page 12
Electricity Demand in Canada bySector, 1990 - 2014Total Electricity Demand in Canada, 2014 491.22 TWh600500Commercial & InstitutionalPublic IndustrialSince 2003 electricity demand hasdecreased 7% and, since an historichigh in 2008, 12%Demand 11201220132014Page 13Source: Statistics Canada, Catalogue no 57-003-X, Report on Energy Supply andDemand in Canada, 2014 preliminaryUpdated April, 2016
Electricity Consumption in Canada bySector, 2003 - 2013Total Electricity Consumption in Canada, 2013 485.19 TWh600Commercial & Public ServicesOther non-specifiedTransportationSince 2003 electricityconsumption has decreased3.2% and, since an historichigh in 2008, mand (TWh)40030020010002003Page 1420042005200620072008200920102011Source: IEA Statistics, Canada: Electricity and Heat 2003-2013Updated January 6,, 201620122013
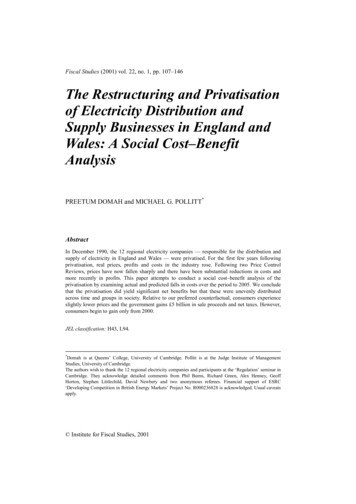
Electricity Generation in Canada by FuelType, 2014Total Electricity Generated in Canada, 2014 627.68 TWhConventionalSteam14.6%Nuclear16.2%Internal Combustion0.3%Combustion Numbers may not sum to 100 percent due to rounding.Source: Statistics Canada, Electric power generation, by class of electricity producer, annual (CANSIM Table 127-0007), 2014Retrieved April, 2016Page 15
Electricity Generation in Canada byFuel Type, 1990 - 2014Total Electricity Generation in Canada, 2014 627.68 TWh700600SolarCombustion TurbineConventional SteamWindInternal CombustionHydro*TidalNuclearGeneration (TWh)5004003002001000*Prior to 2008, wind and tidal generation are included in hydro.Source: Statistics Canada, Electric power generation, by class of electricity producer, annual (CANSIM Table 127-0007), 2014Retrieved April. 2016Page 16
Electricity Generation in Canada byProvince and Fuel Type, 2014Total Electricity Generation in Canada, 2014 627.68 TWh250SolarTidal199.9200WindGeneration (TWh)157.1Combustion TurbineInternal Combustion150NuclearConventional KMBONQCNB*NSPEINFLD*Point Lepreau nuclear generating station resumed power production on November 23, 2012, nuclear has been re-established as a majorsource (about 30%) of electricity in New Brunswick.Page 17Source: Statistics Canada, Electric power generation, by class of electricity producer, annual(CANSIM Table 127-0007), 2014Retrieved August, 2016
Canada-U.S. Electricity Trade Volume,1990 – 20157060Terawatt-hours (TWh)50403020100Source: National Energy Board, Electricity Exports and Imports, 2015.Retrieved August, 2016Page 18
Canada-U.S. Natural Gas TradeVolume, 1990 – 2015120.0ExportsImportsNet100.0Billion cubic meters80.060.040.020.00.0Source: Statistics Canada, Natural Gas Exports and Imports, 2015Retrieved August, 2016Page 19
Canada-U.S. Electricity Trade Revenue,1990 – 20156.0Exports 3.1 billion in 20155.0Imports 0.3 Billion in 2015Billion CDN4.0Net 2.8 Billion in 2015California Energy Crisis3.02.01.00.0California Energy Crisis of 2000 and 2001 was the situation when California had a shortage of electricitySource: National Energy Board, Electricity Exports and Imports, 2015 Retrieved August, 2016Page 20
Canada-U.S. Natural Gas TradeRevenue, 1990 – 201540.035.0ExportsImportsNet30.0Billion CDN25.020.015.010.05.00.0Source: Statistics Canada, Natural Gas Exports and Imports, 2015Retrieved April, 2016Page 21
Canada-U.S. Natural Gas Export/ImportPrices, 2002 – 201510.09.0ExportsImports8.07.0CAN /GJ6.05.04.03.02.01.00.0Source: Statistics Canada, Natural Gas Exports and Imports, 2015Retrieved April, 2016Page 22
Canada-U.S. Electricity Export/ImportPrices/MWh, 1997 – 2015120.0ExportsImports100.0CAN /MWh80.060.040.020.00.0Source: National Energy Board, Electricity Exports and Imports, 2015Retrieved August, 2016Page 23
Canada-U.S. Natural Gas andElectricity Export/Import PriceComparison, 2002 – 2015Electricity Exports120Electricity ImportsNatural Gas ExportsNatural Gas Imports1091008780605CAN /GJCAN /MWh64403220100Source: National Energy Board, 2015Retrieved August, 2016Page 24
Page 25
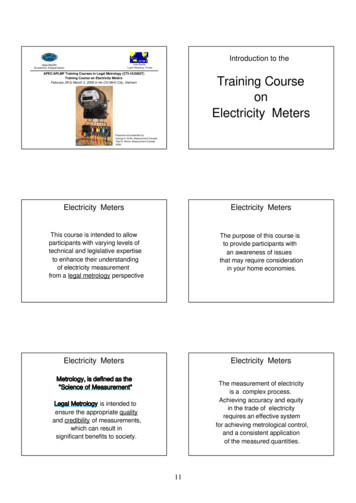
Major Canada-U.S. Transmission InterconnectionsSource: National Energy BoardPage 26
Electricity Exports and ImportsBetween Canada and the U.S. (2014)Data displayed are in gigawatt hoursNumbers may not sum due to roundingSource: National Electricity Board, Export and Imports, 2014.Page 27
The Integrated North American GridMap copyright CEA.Lines shown are 345kV and above. There arenumerous interconnections between Canada and theU.S. under 345KV that do not appear on this map.Page 28
Manitoba-Minnesota Transmission ProjectExisting LineManitobaHydroNew LineHVDC Line /- 500kV(850 miles) Manitoba Hydro (MH): 500 kV lineto U.S. border. Minnesota Power (MP): 500 kVline from border to Duluth. “Hydro by wire” from Manitobaenables “wind by wire” from NorthDakota. Overall project enhances regionalreliability and provides energymarket benefits. 2020 expected in-service date.Page 29HVDC Line /- 500kV(600 miles)WinnipegMinnesotaPower
Utility Investment in Canada’sTransmission and Distribution Cableand Lines, 2006 – 201254.5Billions (Current) CDN 0112012DistributionSource: CANSIM Table 029-0050 Capital and repair expenditures, by industry and type of asset, Canada, provinces and territories.Retrieved April, 2016Page 30
Electric Power Generation, Transmission and DistributionSector Contribution to Canada’s GDP, 2010- 2015 (2007constant dollars) 30.22015 29.63 billionBillion CDN 2007 Constant 30.0 29.8 29.6 29.4 29.2 29.0 28.8 28.6 28.4 28.2Source: Statistics Canada, Gross domestic product at basic prices, utilities, trade,transportation, and communications. April, 2016Page 31
Page 32Source: Statistics Canada, CANSIM Table 031-0002Retrieved June 21, .08.06.04.02.00.0Total capital investment in 2013 20.8billionIntellectual Property ProductsMachinery and equipmentEngineering constructionBuilding construction2007Billion CDN 2007 ConstantCapital Investment in Canada’s Electric Power Sector, 2007–2013 (billions of constant 2007 dollars)
Electric Sector EnvironmentalProtection Expenditures by type, 2012Total electric sector environmental protection expenditures, 2012 1301.6 millionOther0%Fees, fines lassessments andaudits15%Pollution prevention,abatement and control7%Waste managementand sewerageservices42%Wildlife and habitatprotection6%Page 33Reclamation anddecommissioning27%Source: Statistics Canada, Environmental Protection Expenditures in the Business Sector, 2012Retrieved June 9, 2015
Environmental ProtectionExpenditures by the Electric PowerSector,1996– 2012Total electric sectorenvironmentalprotection expenditures, 2012 1301.6 million 1,400OperatingCapital 1,200Millions of dollars 1,000 800 600 400 200 0199619982000200220042006200820102012Source: Statistics Canada, Environmental Protection Expenditures in the Business Sector, 2010Retrieved June 9, 2013Page 34
Greenhouse Gas (GHG) Emissions inCanada by Sector, 2014Total GHG Emissions in Canada, 2014 732 Mt CO2 EquivalentTransportation (170Mt CO2 equivalent)23.6%Emissions Intensive& Trade ExposedIndustries (76 MtCO2equivalent)11.2%Buildings (86 Mt CO2equivalent)11.5%Electricity (85 Mt CO2equivalent)12.3%Oil and Gas (179 MtCO2 equivalent)24.8%Agriculture (75 MtCO2 equivalent)9.9%Waste & Others (54Mt CO2 equivalent)6.7%Note: Emissions do not include the following sectors: land use change and forestry, solvent and other product use and biomassSource: Environment Canada, National Inventory Report 1990-2014: Greenhouse Gas Source and Sinks in Canada, Report date: April, 2016Page 35
Greenhouse Gas (GHG) Emissions inCanada for Energy Sector, 2014Total GHG Emissions in Canada, 2014 732 Mt CO2 EquivalentTotal Energy Sector GHG Emissions in Canada, 2014 594 Mt CO2 EquivalentElectricity & HeatGeneration12.1%Fossil FuelIndustries*10.5%Emissions Intensive andTrade %Transportation28.5%Waste, Light Manufacturing,Construction & Forest Resources7.6%*includes Oil & Gas and Coal ProductionNote: Total energy sector emissions include all those under the National Inventory Category, ‘Energy’Source: Environment Canada, National Inventory Report 1990-2014: Greenhouse Gas Source and Sinks in Canada, Report date: April, 2016Page 36
CO2 Emissions in Canada for PublicElectricity and Heat Production Sector,2014Total Public Electricity & Heat Sector CO2 Emissions in Canada, 2014 85.5 MegatonnesOther fuels, 4.8 MtCO2EOther emissions, 0.8 MtCO2ENatural Gas,19.0 Mt CO2ECoal, 61.6 MtCO2ESource: UNFCCC, National Inventory Submission for Canada, for 1990-2014, Report dated April, 2016Page 37
Utility-Generated Electricity by Source and GHGEmissions, 1990–2013Source: UNFCCC, National Inventory Report for Canada, for 1990-2013,Retrieved June 10, 2015Page 38
Factors Contributing to GHG Emissions Reductionsin the Electricity Sector , 1990-2014, Mt CO2EAdvances in the Generation and Fuel Mix have led to a 9 Mt reductionin emissions despite a 22.8 MWh increase in demand.DemandGenerationMixFuel MixEnergyEfficiencyEmissionFactorsTotal Changes in EmissionsNotes:Demand – the level of electricity generation activity in the utility sector and consists of generation from combustion and non-combustion sources.Generation mix – the relative share of combustion and non-combustion sources in generation activity.Fuel mix (combustion generation) – the relative share of each fuel used to generate electricity.Energy efficiency – the efficiency of the equipment used in combustion related generation of electricity.Emission factors – The emission factor effect reflects changes to fuel energy content over time.Page 39Source: UNFCCC, National Inventory Report for Canada, for 1990-2014,Retrieved April, 2016
Factors Contributing to GHG Emissions Reductionsin the Electricity Sector , 2005-2014, Mt CO2ESignificant reduction in emissions arethe result of Canada’s non-emittingGeneration mixDemandGenerationMixFuel MixEnergyEfficiencyEmissionFactorsTotal Changes in EmissionsNotes:Demand – the level of electricity generation activity in the sector and consists of generation from combustion and non-combustion sources.Generation mix – the relative share of combustion and non-combustion sources in generation activity.Fuel mix (combustion generation) –the relative share of each fuel used to generate electricity.Energy efficiency –the efficiency of the equipment used in combustion related generation of electricity.Emission factors – The emission factor effect reflects changes to fuel energy content over time.Page 40Source: UNFCCC, National Inventory Report for Canada, for 1990-2014,Retrieved April, 2016
Nitrogen Oxide (NOx) Emissions inCanada by Sources, 2014Total NOx Emissions in Canada, 2014 1,922.5 KilotonnesUpstream Petroleum23.2%Other Industrial8.9%Open & Natural Sources0.6%Electric Power8.6%Mobile Sources54.6%Residential/CommercialFuel & Wood3.0%Incineration &Miscellaneous0.1%Source: Environment Canada, National Pollutant Release Inventory, 2014 Air pollutant emissions summary for CanadaRetrieved April, 2016Page 41
Sulphur Oxide (SOx) Emissions inCanada by Sources, 2014Total SOx Emissions in Canada, 2014 1,142.5 KilotonnesResidential/CommercialFuel & Wood3.0%Incineration &Miscellaneous0.2%Electric Power24.2%Non-Ferrous Smeltingand Refining Industry33.6%Open & Natural Sources1.0%Other Industrial15.1%Petroleum Industry (Up& Downstream)24.5%Mobile Sources0.3%Source: Environment Canada, National Pollutant Release Inventory, 2014 Air pollutant emissions summary for CanadaRetrieved April, 2016Page 42
Electric Sector Sulphur Oxide (SOx)Emissions in Canada, 1990 - 2014Total Electric Sector SOx Emissions in Canada, 2014 269 Kilotonnes800700Kilotonnes SO x6005004003002001000Source: Environment Canada, National Pollutant Release Inventory (NPRI) Retrieved April, 2016Page 43
Mercury Emissions in Canada bySources,2014TotalMercury Emissionsin Canada, 2014 3,888.4 KilogramsResidential &Commercial Fuel &Wood4.6%Incineration &Miscellaneous12.1%Electric Power21.5%Non-Ferrous Smeltingand Refining Industry8.1%Cement and ConcreteIndustry8.4%Iron and Steel Industries16.5%Mobile Sources2.4%Open Sources17.4%Petroleum Industry (Up& Downstream)Other Industrial Sources 2.4%6.5%Source: Environment Canada, National Pollutant Release Inventory, 2014 Air pollutant emissions summary for CanadaRetrieved April, 2016Page 44
Electric Sector Mercury Emissions inCanada, 1990 - 2014Total Electric Sector Mercury Emissions in Canada, 2014 762 Kilograms3,5003,000Kilograms Mercury2,5002,0001,5001,0005000Source: Environment Canada, National Pollutant Release Inventory (NPRI)Retrieved on April, 2016Page 45
Particulate Matter (PM2.5) Emissions inCanada by Sources, 2014Total PM2.5 Emissions in Canada, 2014 1,799.5 KilotonnesOpen & Natural Sources(Inc. Agriculture &Waste)83.2%Electric Power0.2%Residential &Commercial Fuel &Wood9.2%Incineration &Miscellaneous0.6%Mining and RockQuarrying0.6%Mobile Sources2.8%Other Industrial2.9%Page 46Petroleum Industry (Up& Downstream)0.6%Source: Environment Canada, National Pollutant Release Inventory,2014 Air pollutant emissions summary for CanadaRetrieved April,, 2016
Electric Sector Particulate Matter (PM2.5)Emissions in Canada, 1990 - 2014Total Electric Sector PM2.5 Emissions in Canada, 2014 3,977 Kilotonnes4035Kilotonnes PM 2.5302520151050Source: Environment Canada, National Pollutant Release Inventory (NPRI)Retrieved on April, 2016Page 47
2014 CO2 Electricity Emissions and160Intensity in 85.5CanadaMT CO eTonnes/GWh CO e22EmissionsSystem IntensityAbsolute EmissionsEmissions s/GWhMillions of Tonnes1002502014Source: National Inventory Report, 1990-2014Page 48
Greenhouse Gas (GHG) Emissions inCanada and the US by Sector, 2014Total GHG Emissions in Canada, 2014 732 Mt CO2 EquivalentAgriculture10.0%Electricity & s10.4%Residential6.3%Oil & Gas26.3%Commercial &Institutional5.6%Transportation23.4%Total GHG Emissions in US, 2014 6,108 MtCO2 .1%Commerical6.6%Electric PowerIndustry30.3%Residential5.7%U.S. Territories0.7%Source: Environment Canada, National Inventory Report and US GHG Emissions and Sinks 1990- 2014, retrieved April, 2016Inventory of U.S. Greenhouse Gas Emissions and Sinks, 1990-2014, retrieved April 2016Page 49
Electricity Generating Capacity in theUS and Canada by Fuel Type,1 2014CanadaUnited StatesTidal andSolar, 0.30% Wind,4.64%InternalCombustion, Others5%CombustionTurbine8%ConventionalSteam lear9%Petroleum4%Hydro,59.02%Total Generating Capacity 132.7 GW50Natural Gas40%Total Generating Capacity 1,066.3 GW1Numbers may not sum to 100 percent due to rounding.Source: US Energy Information Administration, Electric Power Monthly, November 2014 andStatistics Canada, CANSIM Table 127-0009, 2014
Electricity Generation in the US andCanada by Fuel Type,1 ar20.6%Nuclear16%Other ntionalSteam (Coal)15%Natural Gas29.1%Hydro61%Note: Total Electricity Generation in2014 627.68TWh1NumbersNote: Total Electricity Generation in 2014 4, 092 TWhmay not sum to 100 percent due to rounding.Source: US Energy Information Administration, Electric Power Monthly and Statistics Canada, Survey 2151, 2015,Page 51Retrieved Nov 26,, 2015
Building the Next Generation ofInfrastructure: Capital InvestmentRequirementsBillions of 2010 CDN dollars2010 – .862.3293.8Total Canadian Electric Sector Investment Required by 2030 293.8 Billion in 2010 CDN dollars, or 347.5 Billion in current CDN dollars.Source: The Conference Board of Canada, Shedding Light on the Economic Impact of Investing in Electricity Infrastructure,February 2012Page 52
Active MPMO Electricity SectorProjectsMPMO Project NameDescriptionProponentLabrador - Island Transmission Link1,100 km lineNalcor EnergyTransmissionNL500-MW, /- 200 to 250-kVHVDC & HVACENL Maritime Link Inc.TransmissionNL/NS695 MWKeeyask Hydropower LimitedPartnershipHydroMBLower Churchill Hydroelectric Generation3,074 MWNalcor EnergyHydroNLSite C Clean Energy Hydroelectric Generation1,100 MWBC HydroHydroBCUp to 4,800 MWOPGNuclearON320 MW (off-shore)NaiKun Wind DevelopmentWindBC50 MWSaskatchewan Power Corp.HydroSKMaritime Link TransmissionKeeyask Hydroelectric GenerationDarlington New Nuclear Power PlantNaiKun Offshore Wind EnergyTazi Twe Hydroelectric GenerationPage 53Source: Major Projects Management Office, Project Tracker, updated April, 2016Project Type Location
Active MPMO Electricity SectorProjects – indirect relevanceMPMO Project NameBow City Coal Mine and PowerDeep Geological DepositoryDescriptionProponentProject Type Location2x 500 MWBow City Power Ltd.CoalABWaste ManagementOntario Power GenerationNuclearONNote: indirect relevance refers to projects that are indirectly related to electricity generation and include infrastructure related activities, such as mining(of coal for power generation), waste management (of radioactive waste) and dam (re)constructionSource: Major Projects Management Office, Project Tracker, Updated April, 2016Page 54
Non-MPMO Electricity Sector Projects– new proposalsMPMO Project NameBipole III Transmission LineChamouchouane - Bout-de-l'Île Transmission LineDescriptionProponent1,475 kmManitoba HydroTransmissionMB735 kVQuebec CWindONGreen Electron Natural Gas Power GenerationProject300 MWHawkeye Green Energy Hydroelectric Generation175 MWMica 5 and 61000 MWRocky Creek Wind Power500 MWTrillium Offshore Wind Farm414 MWGreenfield South PowerCorporationHawkeye EnergyCorporationBC HydroRupert Peace PowerCorporationTrillium Power WindCorporationProject Type LocationNote: indirect relevance refers to projects that are indirectly related to electricity generation and include infrastructure related activities, such as mining(of coal for power generation), waste management (of radioactive waste) and dam (re)constructionSource: Major Projects Management Office, Project Tracker, Retrieved June 19, 2015Page 55
Canada’s Regulatory Regime for LargeEnergy ProjectsPlanningEnvironmental Assessment ProcessPermittingFollow-upCanadian Environmental Assessment Act - CEA Agency*National Energy Board Act - NEB*Nuclear Safety and Control Act - CNSC*Impact reviews (YESAA, MVRMA Land Claim / CEAA)Innuvialuit Final Agreement - INAC*Land use plansManagement BoardsTerritorial Lands / Water ActSpecies at Risk Act - EC/DFOMetal Mining Effluent Regulations - EC/DFOExplosives Act - NRCanFisheries Act - DFONWPA - TCOthers: MBCA / IBWTA / CPRA / Offshore Accords / CEPA*Permits required under other Acts trigger CEAA OGD participantsIllustrative – some components would not apply to same projectNWPA – Navigable Waters Protection Act / YESAA – Yukon Environmental and Socio-Economic Assessment ActMVRMA – Mackenzie Valley Resource Management Act / MBCA - Migratory Birds Convention Act /IBWTA – International Boundary Waters Treaty Act / CPRA – Canadian Petroleum Resource Act /Offshore Accords – Canada - NS and NFLD Offshore Accords / CEPA – Canadian Environmental Protection ActPage 56
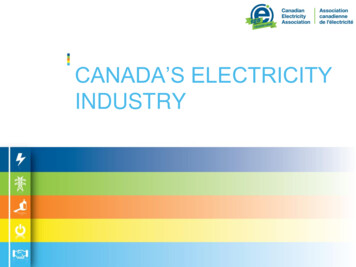
Average Residential Electricity Price inCanada, 1998 – 2015 (cents/kWh)14.012.15 11.85 11.94 12.15 12.3212.0Cents/kWh10.09.85 9.58 9.79 9.949.77 9.679.40 9.58 9.6610.34 10.4410.82 10.768.06.04.02.00.01998 1999 2000 2001 2002 2003 2004 2005 2006 2007 2008 2009 2010 2011 2012 2013 2014 2015Source: Hydro Quebec, Comparison of Electricity Prices in Major North American Cities, 1998 – 2015, Retrieved August, 2016Ontario Hydro: Electricity Rates by Province, Retrieved June 20, 2015Notes: Based on 1,000 kWh monthly consumptionAverage electricity price is an average of 11 major Canadian cities for years 1998-2008 and an average of 12 majorCanadian cities for years 2009-2015; and may not represent an exact national average.Page 57
Selected World Residential ElectricityPrices, 2014DenmarkItalyIrelandAustriaUnited urkeyUnited StatesCanadaMexico05101520US cents/kWh2530354045Source : International Energy Agency, Key World Energy Statistics 2015 with 2014 dataHydro Quebec, Comparison of Electricity Prices in North American Cities 2014Page 58
Selected World Industrial ElectricityPrices, 2014ItalyIrelandPortugalUnited DenmarkPolandCanadaUnited States0510US cents/kWh1520253035Source : International Energy Agency, Key World Energy Statistics 2015 with 2014 dataHydro Quebec, Comparison of Electricity Prices in North American Cities 2014Page 59
Percentage Change in HouseholdExpenditures 2000-2014(Year over Year PercentageChange)250%200%150%100%50%0%2000 2001 2002 2003 2004 2005 2006 2007 2008 2009 2010 2011 2012 2013 2014Property TaxesElectricityWaterInternet ServicesNote: The price increase for the residential electricity sector has increased 39% between1999 and 2013, the lowest amongst property taxes, water and internet services for principleaccommodation.Page 60Source: Statistics Canada, Survey of Household Spending, 2015
Canada’s Future Residential ElectricityNeedsReference: Graphics from BC Hydro: Lighting the Way. Estimates based on abusiness as usual scenario. Stats Canada Population Projections: Table 052-0005Page 61
Low Emission and SustainableTechnologies Used for llengesWind PowerNo fuel cost, no emissions or waste, renewablesource of energy, commercially viable source ofpowerLess cost competitive than conventional energy source,variable energy resource, transmission issues,environmental concerns with regards to noise andinteraction with birds, land use issuesSmall HydroLow capital costs, many potential sites in Canada,well established technology, able to meet smallincremental capacity needs, reduct
Utility Investment in Canada’s Transmission & Distribution Cables & Lines, 1998 - 2010 Electric Power Generation, Transmission and Distribution Sector Contribution to Canada’s GDP, 1990 –2012 Capital Investment in Canada’s Electric Power Sector, 1990 –2012 Electric S