Transcription
Analytics InsightsEducationAn introduction to CLOsJune 2021AUTHORSLuke LuYield Book Mortgage Researchan.lu@lseg.comElizabeth HanRefinitiv LPCelizabeth.han@refinitiv.comHugo PereiraRefinitiv A Collateralized Loan Obligation (CLO) is a structured securitization thatprovides financing to non-investment grade companies and caters to debtinvestors with varying credit risk appetites. In this paper, we explore the keyfeatures of a CLO, including the underlying leveraged loan portfolio, dealstructural protections, and the role of a CLO manager. The marketperformance of CLOs has been resilient through economic downturnsincluding the COVID pandemic.An LSEG Business1
ContentsExecutive summary3Leveraged loans4What is a CLO?7CLO life cycle8Deal structure10Tests, triggers, and concentration limits11Role of the CLO manager11Investment in CLOs13Performance through COVID14Conclusion19Glossary20yieldbook.com2
Executive summaryLeveraged loans, issued by non-investment grade companies, are typicallysenior secured, floating rate, and callable. They are generally issued throughbank syndication desks, and traded in a secondary market.A Collateralized Loan Obligation (CLO) is a funding vehicle that buys a portfolioof diversified leveraged loans as assets and issues a series of debt obligations,including debt tranches, at various credit ratings and an unrated equity tranche.CLOs have sophisticated deal structures with robust credit enhancement and riskprotection for investors through specially designed performance tests andtriggers.Deals usually start with a warehouse and ramp-up period where the assetportfolio is built up, followed by a reinvestment period where asset managers cantrade in and out loans and reinvest prepaid principal proceeds. There is a noncall period at the early part of the reinvestment period, during which equityholders cannot call the deal. An amortization period follows the reinvestmentperiod.CLO managers play an important role in mitigating risk and enhancing the valueof the asset portfolio by actively trading the loans during the reinvestment period.CLOs have proven to be a resilient and mature product, and have weatheredrecent severe economic downturns relatively unscathed thanks to its self-curingstructure and active management.yieldbook.com3
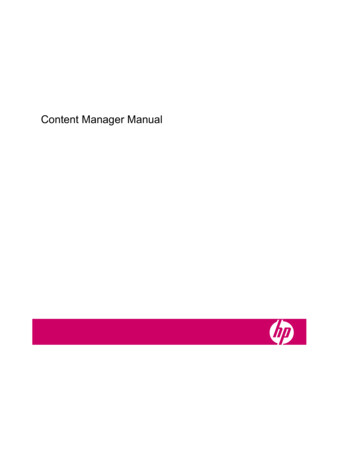
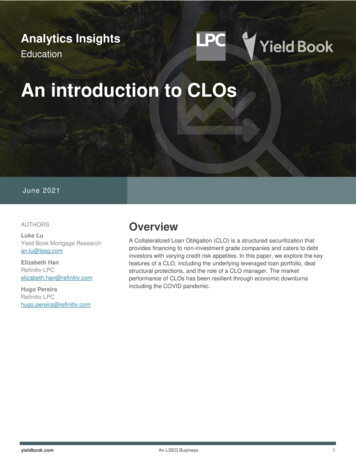
Leveraged loansLeveraged loans are issued by companies with high debt levels and rated belowinvestment grade. They are usually floating rate (with Libor1 as index), seniorsecured, and rated at or below Ba1/BB . Borrowers work with the arrangingbanks to underwrite and syndicate the loan. After issuance, loans can be tradedin the secondary market.Leveraged loans usually have a five- to seven-year tenor, with soft call protectionfor six months and can be called at par without penalty at any time outside thenon-call period. Issuers may call loans when the loan issuer wants to retire thedebt, or when loan spreads tighten and secondary prices exceed par due to acatalyst such as a rating upgrade or a reduction in the Debt / EBITDA ratio.Lenders assess the credit risk of theloan when evaluating its spread andyield. Ratings, loan seniority inissuer’s capital structure, industrytrends, and a sponsor’s track recordare among many factors lenderslook at when assessing the creditrisk.There is an active secondary market for leveraged loans. The loan prices reflectcredit and liquidity risk, and are impacted by market conditions. They rarely tradesignificantly above par due to the callability feature.In the U.S., it is common for loans to have Libor floors that range from 50bp to100bp. When Libor is below the floor, the issuer pays the floor plus the spread.When Libor rates were high pre-2020, floors were less relevant and the majorityof loans were done without floors. As rates fell rapidly following COVID, floorsstaged a strong comeback. So far in 2021, about 77% of first lien institutionalloans have a floor from 0 to 75bp, 8% have a floor of 100bp, and only 15% haveno floors.Many issuers are owned by private equity firms who are sponsors of theleveraged loans. Lenders look at the track record of sponsors in evaluating theriskiness of the loan. Sponsors can use the proceeds of a leverage loan invarious ways, including a leveraged buyout of the company, supporting mergerand acquisition (M&A), recapitalizing their balance sheet, refinancing existingdebt, or obtaining additional funding.One of the benefits of investing in CLOs is diversification. Each CLO can includemore than 500 leveraged loans in its underlying asset portfolio. As many as 35industries are represented in CLO loans, with the top 10 industries making up65% of the universe. As demonstrated in Exhibit 1, Business Services,Healthcare, Banking, and High Tech are top industries with a double digitpercentage allocation.1Libor based originations are expected to end at the end of 2021, and outstanding legacy contracts have until June 30, 2023 to transition to areplacement rate.yieldbook.com4
Exhibit 1 – U.S. Leveraged Loan Industry Distribution (Moody’s)6%5%18%6%7%17%8%9%12%Healthcare & PharmaceuticalsHigh Tech IndustriesMedia: Broadcasting & SubscriptionHotel, Gaming, & LeisureConstruction & Building11%Services: BusinessBanking Insurance and Real EstateTelecommunicationsServices: ConsumerChemicals, Plastics, & RubberSource: Yield Book, Trepp (May 2021).Investors also benefit from coverage from the major credit rating agencies.Exhibit 2 shows Moody’s rating distribution of CLO loans. B2 and B3 are themost common ratings. In aggregate they account for 60% of the universe.Exhibit 2 – US Leveraged Loan Rating Distribution (Moody’s)2%1%0%0%3%Rating agencies actively monitor thecredit risk of loans in CLO collateralto ensure the rating is still valid.There was a large amount ofdowngrade activity in the wake ofthe COVID pandemic in CSource: Yield Book, Trepp (May 2021).The total outstanding balance of U.S. leveraged institutional loans isapproximately 1.23 trillion. Exhibit 3 shows historical leveraged loan issuance inrecent years. New issuance for 2020 totaled 212 billion, while refinancingyieldbook.com5
activity was 186 billion. Issuance volume for 2021 has been very strong in thefirst four months, with 106 billion of new issue volume and 207 billion ofrefinancing activity.Exhibit 3 – US Leveraged Loan IssuanceSource: Refinitiv LPC (May 2021).The majority of leveraged loans are first lien senior secured. Exhibit 4 showssome key loan metrics by lien types. Second lien loans have significantly higherspreads and lower secondary average bids, with about half rated Caa2.Exhibit 4 – US Leveraged Loan MetricsLienFirst LienSecond LienPct ofUniverseSpread(bps)MktPriceTop 1 IndustryTop 1 Rating98%3659812% High Tech32% - B22%7479420% High Tech54% - Caa2Source: Refinitiv LPC, S&P/LSTA Leveraged Loan Index (June 2021).Leveraged loans usually have contract terms (called covenants), which aredesigned to protect lenders and require loan issuers to meet certain financialtests or maintain certain operational and financial performance standards. In abenign credit environment, some loans are made more borrower-friendly withless restrictive covenants, and they are referred to as covenant-lite (“cov-lite”)loans. Cov-lite loans can become more levered, which may lead to lowerrecoveries in the event of a default. Cov-lite loans have gained popularity since2014 and make up 70-80% of leveraged institutional loan issuance.yieldbook.comSecond lien and cov-lite loans havehigher inherent credit risk.6
CLOs have been a major source of demand for leveraged loans, holding over50% of the market. In addition, CLOs also play an important role in the liquidity ofthe leveraged loan secondary market.What is a CLO?A Collateralized Loan Obligation (CLO) is a funding vehicle that buys leveragedloans as assets and issues rated debt tranches and an unrated equity tranche.CLOs have a highly diversified loan portfolio. It is common to have more than400 unique loan issuers across 15-25 industries. The portfolio needs to maintaincertain metrics, which include tests on portfolio diversity, weighted averagespreads (WAS) and weighted average rating factors (WARF), etc.CLO portfolios can be static, wherein the assets that make up the CLO remainlargely unchanged. These are usually created for the purposes of balance sheetmanagement and are referred to as balance sheet CLOs. Or the portfolios canbe dynamic, where the assets are actively managed and profit is created in thearbitrage between a CLO's portfolio assets and the cost of servicing its debt—these are called market-arbitrage CLOs. This paper will focus on marketarbitrage CLOs, the predominant structure.CLO portfolio can be static ordynamic. The latter is the mostcommon, known as market-arbitrageCLOs.Exhibit 5 shows annual new issuance of U.S. CLOs since 2000. New issuancefor 2020 amounted to 90 billion (down 24% from 2019) due to COVID relatedmarket disruption. Issuance in 2021 has been very robust with 65 billion in thefirst five months of the year. Post the great financial crisis (GFC), the U.S. CLOmarket has grown significantly with total outstanding assets-under-managementsurpassing 782 billion.Exhibit 5 – US CLO New Issue VolumeSource: Refinitiv LPC (May 2021).There are two types of CLOs that are backed by leveraged loans ‒ BroadlySyndicated CLOs (BSL) which is by far the most common CLO type, and MiddleMarket CLOs (MM), which include loans to smaller companies.yieldbook.com7
Middle Market loans typically have small-to-medium size (less than 150 million)and issuer EBITDA of less than 50 million. MM CLOs have much higher WASand funding costs due to smaller issuers and a liquidity premium.In BSL CLOs, managers buy already issued corporate loans in the primary andsecondary markets. On the other hand, MM CLOs typically source loans directlythrough the private credit market and a manager can be the originator of theloans.Unlike BSL CLO loans, MM loansare illiquid and don’t have good pricediscovery.Since MM loans are less liquid, smaller and largely unrated, investing in dealswith good metrics at the time of origination and managers with a strong trackrecord are very important.As most CLO deals are BSL deals, we will focus on BSL CLOs in the rest of thispaper.Post-GFC, CLOs changed significantly with increased credit enhancement forsubordinate tranches and more restrictive indentures. The new deals post-GFCare generally called CLO 2.0. In response to regulation (Volcker rule and riskretention) some participants in the CLO market refer to deals issued after 2014as CLO 3.0.CLO life cycleExhibit 6 is the life cycle of a typical CLO deal, which has a 5-year reinvestmentperiod (with the first two years as a non-call period) followed by a 3-yearamortization period.Deals usually start with a warehouse and a ramp-up period where the assetportfolio is built up to a target par balance, followed by a reinvestment period,which is one of the unique aspects of a CLO.Exhibit 6 – CLO Deal Life CycleCLOs have many stages in their lifecycles with the unique feature of areinvestment period, followed byamortization.Source: Yield Book (May 2021).CLOs are actively managed vehicles. During the reinvestment period, the CLOmanager actively manages the portfolio, e.g., buys/sells loans, and principalproceeds generated by assets (prepayments and recoveries) are used forreinvestment (i.e., manager buys new assets).yieldbook.com8
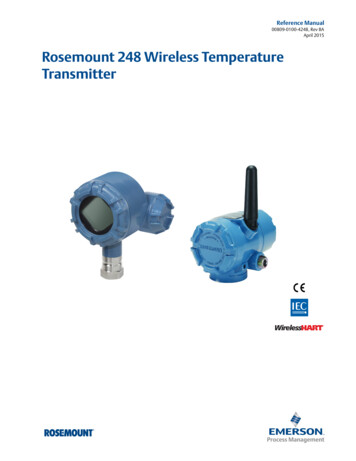
The non-call period, during which deals cannot be called, coincides with the firstpart of the reinvestment period. Equity investors with the approval of the CLOmanager can decide to call the deal once the non-call period ends.There are various reasons for an equity investor to call the deal. A common oneis to refinance debt tranches, i.e., pay debt holders in full and reissue debt at alower spread. Refinancing tranches enable the deal to reduce funding costs. Ifcredit spreads tighten, the deal can take advantage of this and improve equityreturns, however this comes at the cost of debt holders.A refinancing can be for specific debt tranches, while a reset involves all the debttranches. Managers can also reset a deal to extend the reinvestment period andlengthen the fee stream. The life of the deal can be extended multiple timesbefore the SPV completely winds down.Some deals have restrictions in the number of times a deal can be reset. When adeal reaches that limit, or when the structure needs to be changed significantly,equity holders can instead liquidate the asset portfolio and reissue a new deal.As the name implies, reissuing requires issuing the deal again i.e., setting up anew SPV.CLO Deals have a non-call periodafter which equity investors have theright to redeem. Refinancingtranches, resetting the deal, and reissuing the deal are three ways toredeem.CLO refinancing/reset volume jumped in the first few months of 2021 as the marketrallied and equity holders/managers looked to lower capital costs (Exhibit 7).Exhibit 7 – Monthly US CLO Issuance (New Issue/Refi/Reset/Reissue) vs.AAA Discount Margin (January 2017 – April 2021)24022050.020040.018030.016014020.0AAA DM (bp)US CLO Volume ngsResetsReissuesBSL CLO AAA DMSource: Refinitiv LPC (May 2021).Assuming the deal is not called, the amortization period starts after thereinvestment period ends. Proceeds from prepayments and recoveries are usedto pay down tranches that start to amortize based on the order of their seniority inthe structure. Some portion of principal proceeds can potentially still bereinvested if the deal language allows it and the manager is in compliance withmaintenance tests, with the remainder of principal proceeds used to pay downthe tranches.yieldbook.com9
Deal structureExhibit 8 shows a generic CLO deal structure. CLOs issue floating-rate debttranches, rated AAA through BB (sometimes B). Naturally, lower credit ratingscorrespond to lower credit enhancement levels (or attachment points) and widerspreads (to compensate for higher risk). The non-rated Equity tranche sits at thebottom of the capital stack.In general, asset cash flows are paid to the CLO debt tranches from the top down(AAA to BB) and asset losses accrue from the bottom up (Equity to AAA). Cashflows are adjusted by trigger fail/pass of specific performance tests at eachtranche.Like other structured products, CLOs benefit from funding arbitrage (assetinterest – liability cost). Asset portfolio's interest income typically exceeds debttranches’ interest (and management fees), and the excess interest goes to theEquity tranche which has high structural leverage (Debt Balance / Equity Balance 10-11x) and can achieve cashflow yields of 15-20%.Exhibit 8 – A Typical CLO Deal StructureNew issue spreads and attachmentpoints depend on market conditions,portfolio quality, a CLO manager’sreputation, etc.Source: Yield Book (May 2021). Tranche spreads and credit enhancement levels are for illustrativepurpose only.yieldbook.com10
Tests, triggers, and concentration limitsCLO performance tests and associated triggers are designed to reduce the riskto senior tranches in the event of collateral underperformance (higher rate ofdowngrades/defaults).CLOs generally have two main performance tests for debt tranches: Overcollateralization Ratio (OC) Par amount of asset portfolio / Balance ofdebt tranches equally or senior to a given debt tranche Interest Coverage Ratio (IC) Interest paid by the asset portfolio / Interestpayable on debt tranches equally or senior to a given debt trancheWhen an OC test is breached, coupon payments to junior tranches (relative tothe given debt tranche of OC test) are withheld and redirected to pay down theprincipal of senior tranches so that the OC test can be cured. If junior tranchesmiss their coupon payments due to an OC test breach, the missed couponamounts can sometimes be added back to the balance of the tranches via PIK(payment-in-kind).Performance tests and triggers arekey CLO structural protectionfeatures, making the CLO dealstructure self-curing.When an IC test breaches its trigger, the cashflow waterfall follows the samemechanism as described above to reduce the senior debt tranche balance untilthe test cures.For OC tests, there are some par value haircuts applied to adjust the varyinglevels of risk in the collateral. One is a CCC concentration test. Typically, CLOshave a limit (e.g., 7.5%) that determines the percentage of the portfolio that canbe rated CCC or below. If the CCC bucket of the CLO goes above this limit,loans rated CCC or below are sorted by price in descending order, and anybalance beyond the CCC limit is calculated at market price or at an assumedrecovery instead of par.Another haircut applied to the OC ratios comes from deeply discounted assets. Ifan asset is purchased at a deep discount ( 80), it is recorded at the purchaseprice until it trades above 80 for a period of time.In addition, defaulted assets are recorded at the lower of the market price orassumed recovery for the OC calculation.Lower quality assets, such as loanswith CCC rating or deeplydiscounted price, are penalized inOC ratio calculation.There are collateral quality tests that a CLO manager needs to monitor such asWAS, WARF, Weighted Average Life (WAL), and Diversity Score. These testscan limit a manager’s trading by requiring the transaction maintain or improve thetest.Finally, concentration tests place certain limits specified in the deal documentsthat the manager needs to be compliant with. These limits include the percentageof second lien, percentage of cov-lite, percentage of single issuer, andpercentage of same industry, etc.Role of the CLO managerThe CLO manager has a very important role in the performance of the portfolio,and refers to the investment firm/team which is responsible for many aspects ofthe deal, e.g., loan selection, trading decisions, deal structuring, compliance totests/limits, and asset surveillance.yieldbook.com11
A manager’s responsibility varies during different stages of the deal. Asdiscussed earlier, a manager builds a portfolio to reach the initial target parbalance during the ramp-up period. During the reinvestment period, a managercan trade in and out of loans and replace prepayment with new loans, ensuringthe CLO passes maintenance tests and new loans are compliant with the dealdocumentation.Because the underlying loans have an active secondary market, a manager cantake advantage of loan price volatility to make trading gains. As an example, amanager can find value and buy a discounted loan in the secondary market,creating portfolio par, and sell close to par after a reduction in the perceived riskof the loan and/or a rating upgrade. Similarly, a manager can add significantvalue by avoiding problematic industries through underweighting, e.g. energy in2016, or transportation during COVID.In return for their services, managers are paid a senior management fee (usually25bps), subordinate management fee (usually 15bps), and an incentive fee(based on equity tranche returns).Experienced managers with a strongcredit selection skillset and a soundrisk framework can add significantvalue by taking advantage of marketvolatility.Managers need to balance risk/reward in managing the portfolio. For example,the equity investor may benefit from excess spread with riskier loans that otherdebt holders try to avoid. If a manager takes excessive risk on the asset side,there can be negative consequences including write-down or lower liquidity of theequity/debt tranche, non-compliance to WARF/Diversity tests, and reputationaldamage.For CLO investors to understand and evaluate different CLO managers, someimportant considerations include: Portfolio turnover: Is the manager actively trading or running a “buy-and-hold”strategy? Credit selection: Does the manager have a robust credit selection processand a proven track record? WAS/WARF trade-off: Is the manager running high risk/high reward portfolioor vice versa? Facility size: Do the loans in the deal portfolio have a large concentration ofsmall facility sizes, which may warrant higher spreads as compensation forcompany size risk? Portfolio liquidity: Do the loans in the deal portfolio have a highly liquidsecondary market? Active exposure: Is the manager running a portfolio that is closer to loanindexes or are they taking active exposure and/or concentration risk? Specific concentration: Is the manager running a portfolio with a specificconcentrated risk bucket (CCC/second liens/first time issuers/industry) togenerate excess spread? Going concern: Does the manager have strong backing and long-termcommitment to the CLO business?yieldbook.comThere are pros and cons of differentmanager styles, but no “good” or“bad” styles – it all depends on aninvestor’s investment objective andrisk/reward appetite.12
Investors can use various quantitative and qualitative criteria to evaluatemanager style/performance/tiering. Management style is also dynamic and maychange based on personnel changes or the investment environment.Investment in CLOsCLOs offer unique investment opportunities with compelling relative values. Itappeals to a broad investor base across the capital stack (Exhibit 9). In recentyears, the CLO investor base has continued to grow as more and more investorscome to understand and become comfortable with the product.Exhibit 9 – Investor Base for CLO Capital StackSenior Tranches(AAA/AA)Mezzanine Tranches(A/BBB/BB)Equity TranchesInsurance CompaniesHedge FundsPrivate Equity FundsBanksAsset ManagersStructured CreditFundsPension FundsInsurance CompaniesHedge FundsAsset ManagersBanksCLO ManagersSource: Yield Book, Refinitiv LPC (May 2021).There are many ways CLO investments are attractive and can be accretive to afixed-income portfolio. Spread pick-up compared to similarly rated tranches. Debt tranches have substantial credit support. Active management can add significant value if done right, e.g., building parthrough trading gains thereby increasing credit support. Underlying loan portfolios are senior secured loans with historically highrecoveries. Transparency in CLO assets with public credit ratings and audited financialstatements. Active secondary market for both collateral loans and debt tranches. CLO assets are not subject to mark-to-market, hence they are shielded frommarket volatility. Managers can take advantage of market volatility withoutbeing a forced seller.The CLO is an attractive investmentproduct offering many uniquerisk/return opportunities.Meanwhile, investors should be aware of some risks associated with CLOinvestments. CLO deal structures are complex relative to some other securitizedproducts. After the non-call period CLO tranches can be called at par (hencethere is little price upside unless the tranches are bought at discount prices). Theuncertainty around the duration and WAL of the debt tranches can also be achallenge due to deal call optionality and changes in loan prepayment speeds.yieldbook.com13
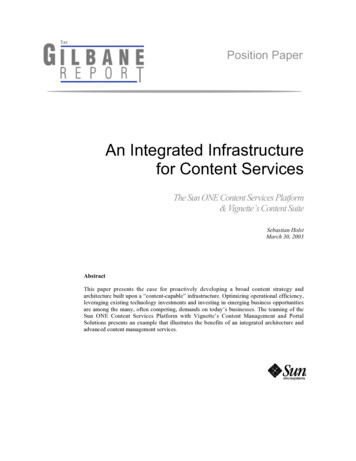
Exhibit 10 shows basic investment analytics on a sample CLO deal when runningthe market standard 20 CPR for prepayment speed, 2 CDR for default rate, anda 60% recovery rate with a no-call scenario. WAL ranges from 3.90 years to 6.95years for tranches A to E.Exhibit 10 – Sample CLO Deal Scenario AnalyticsTrancheRatingSpreadPriceWALMod DurAAAAL 1321003.903.70BAAL 1751005.735.21CAL 2501006.305.51DBBBL 4351006.695.38EBBL 6231006.955.14Source: Yield Book, Trepp (May 2021).CLO debt investors are paid a premium for the call option they are short.Therefore, AAA tranches of CLOs are generally one of the highest yielding AAAtranches across various securitized products.Mezzanine tranches benefit from strong credit enhancement levels and are wellprotected from credit losses in most cases. They also tend to have higher yieldcompared to other similarly rated credit products.Equity tranches are one of the most unique investment instruments across thefixed income spectrum as they offer levered exposure to a diversified creditportfolio and can generate double digit returns post loss and fee.CLOs in general have asset matching liabilities with both being Libor indexfloaters. When Libor rates are very low, Libor floors boost effective spreads andcan increase the cash flow yield for Equity tranche. On the other hand, whenLibor is increasing, total returns for debt tranches go up.CLO is well positioned for a risingrate environment, and is one of thefew scalable floating rate assetclasses.As the underlying risk of the CLO portfolio is corporate credit risk. CLOs can helpdiversify fixed-income portfolios consisting mostly of other asset-backedsecurities (consumer and mortgage).Performance through COVIDExhibit 11 shows how market prices and the percentage of loans rated CCC orbelow reacted to lockdowns and ratings downgrades following COVID. Loanprices suffered a steep loss in March 2020. But market liquidity came backquickly amid massive monetary and fiscal stimulus, and loan prices rebounded inApril. The CCC percentage jumped from 4% in March to 11% in June amid adowngrade wave. With the vaccines rolling out and economy reopening, loanprices recovered, and CCC exposure also steadily declined as rating agenciesupdated their projections with more upgrades than downgrades.yieldbook.com14
Exhibit 11 – U.S. CLO Loan Price and CCC Percentage through COVIDDuring COVID, market pricesseemed to be leading indicator ofdowngrade and upgrade cycles.Source: Yield Book, Trepp (May 2021). Past performance is no guarantee of future performance.Please see the end for important legal disclosures.Exhibit 12 shows loan price movement by industry through the COVID pandemic,covering some of the major COVID impacted industries including Transportation,Retail, Leisure, and Oil & Gas. After the March shock, loan prices across theseindustries have risen steadily in the last 14 months and reverted back to preCOVID levels as sector credit fundamentals gradually recovered.Exhibit 12 – Loan Price (Secondary Average Bids) by Industries throughCOVIDSectors battered by COVID haverebounded as market sentimentimproves and fundamentals recover.100.0Avg bid (% of Apr-2126-Apr-2110-May-2124-May-2165.0Market Overall (N. Amer.)US RetailUS LeisureUS Oil & GasUS Transportation B3/ B-Source: LSTA-Refinitiv LPC MTM Pricing (May 2021). Past performance is no guarantee of futureperformance. Please see the end for important legal disclosures.yieldbook.com15
Another way to show loan price movement is to look at the price distribution overtime (Exhibit 13). 34% of loans traded below 80 and 83% traded below 90 inMarch 2020, vs. only 3% and 5% respectively as of April 2021 (with 14% of loanstrading above par).Exhibit 13 – U.S. CLO Loan Price (Secondary Average Bids) Distributionthrough COVIDAvg bidMar-20Apr-20Dec-20Mar-21Apr-21 7012%10%3%1%2%70 to 8022%11%1%1%1%80 to 8525%11%1%1%1%85 to 9024%16%3%2%1%90 to 9516%32%7%4%4%95 to 981%18%17%12%11%98 to 990%1%20%20%19%99 to 1000%0%37%50%47% 1000%0%10%10%14%Source: Refinitiv LPC (May 2021). Past performance is no guarantee of future results. Please see theend for important legal disclosures.Historically AAA tranches of CLOs never defaulted, and only one AA tranche hasever defaulted. This is primarily due to the high credit enhancement and the riskprotection mechanism embedded into the CLO’s performance tests which divertcash flows from junior tranches to pay down senior tranches in the event ofdeteriorating collateral performance. CLOs are also benefitting from no mark-tomarket requirement and hence no forced liquidations due to sharp asset pricedeclines in severe downturns.Default risk is the likelihood of the issuer defaulting on interest or principalpayment. Historically, the loan market experienced close to 2% default rateannually with default rates peaking in 2009 at 8%. Recovery rates typically rangebetween 60-80%.Looking at the Fitch U.S. Leveraged Loan Default Index (Exhibit 14), we seedefault rates hovered around 1.5% to 2% in 2019 and early 2020 pre-COVID,before rising rapidly following COVID and peaking at 4.5% in September 2020.Default rates are significantly down from the peak and are at 2.4% as of May2021.yieldbook.comDefault rates have been trendingdown since peaking in September2020.16
Exhibit 14 – TTM Institutional Leveraged Loan Default urce: Fitch, Refinitiv LPC (May 2021). Past performance is no guarantee of future performance.Please see the end for important legal disclosures.Exhibit 15 shows the defaulted balance of selected industries hit by COVID(Healthcare, Oil and Gas, Leisure, Mining, and Retail). Healthcare and Oil & Gashad some early defaults following COVID, followed by Leisure/Mining/Retailwhich saw defaults peaking in July/August 2020. Default balances have sincebeen declining steadily for all industries.Exhibit 15 – Balance in Default by Industry ‒ CLO 2.0 (in millions) 2,000For most industries, the recentdefaulted balances have declined topre-COVID levels. 1,500 1,000 500 01/1/2020 3/1/2020 5/1/2020 7/1/2020 9/1/2020 11/1/2020 1/1/2021 3/1/2021Oil and GasLeisure and EntertainmentMiningHealthcareRetail & SupermarketsSource: Refinitiv LPC (May 2021). Past performance is no guarantee of future performance. Pleasesee the end for important legal disclosures.yieldbook.com17
Exhibit 16
leveraged loans. Lenders look at the track record of sponsors in evaluating the riskiness of the loan. Sponsors can use the proceeds of a leverage loan in various ways, including a leveraged buyout of the company, supporting merger and acquisition (M&A), recapitalizing their balance sheet, re