Transcription
Astronomy&AstrophysicsA&A 584, A32 (2015)DOI: 10.1051/0004-6361/201526589c ESO 2015 (Sub)millimetre interferometric imaging of a sampleof COSMOS/AzTEC submillimetre galaxiesII. The spatial extent of the radio-emitting regions O. Miettinen1 , M. Novak1 , V. Smolčić1 , E. Schinnerer2 , M. Sargent3 , E. J. Murphy4 , M. Aravena5 , M. Bondi6 ,C. L. Carilli7,8 , A. Karim9 , M. Salvato10 , and G. Zamorani111234567891011Department of Physics, University of Zagreb, Bijenička cesta 32, 10000 Zagreb, Croatiae-mail: oskari@phy.hrMax-Planck-Institut für Astronomie, Königstuhl 17, 69117 Heidelberg, GermanyAstronomy Centre, Department of Physics and Astronomy, University of Sussex, Brighton, BN1 9QH, UKInfrared Processing & Analysis Center, MS 100-22, California Institute of Technology, Pasadena, CA 91125, USANúcleo de Astronomía, Facultad de Ingeniería, Universidad Diego Portales, Av. Ejército 441, Santiago, ChileIstituto di Radioastronomia – INAF, via Gobetti 101, 40129 Bologna, ItalyNational Radio Astronomy Observatory, PO Box 0, Socorro, NM 87801-0387, USAAstrophysics Group, Cavendish Laboratory, JJ Thomson Avenue, Cambridge CB3 0HE, UKArgelander-Institut für Astronomie, Universität Bonn, Auf dem Hügel 71, 53121 Bonn, GermanyMax-Planck-Institut für extraterrestrische Physik, Giessenbachstrasse 1, 85748 Garching bei München, GermanyINAF–Osservatorio Astronomico di Bologna, via Ranzani 1, 40127 Bologna, ItalyReceived 23 May 2015 / Accepted 22 September 2015ABSTRACTRadio emission at centimetre wavelengths from highly star-forming galaxies, like submillimetre galaxies (SMGs), is dominated bysynchrotron radiation arising from supernova activity. Hence, radio continuum imaging has the potential to determine the spatial extentof star formation in these types of galaxies. Using deep, high-resolution (1σ 2.3 μJy beam 1 ; 0. 75) centimetre radio-continuumobservations taken by the Karl G. Jansky Very Large Array (VLA)-COSMOS 3 GHz Large Project, we studied the radio-emittingsizes of a flux-limited sample of SMGs in the COSMOS field. The target SMGs were originally discovered in a 1.1 mm continuumsurvey carried out with the AzTEC bolometer, and followed up with higher resolution interferometric (sub)millimetre continuumobservations. Of the 39 SMGs studied here, 3 GHz emission was detected towards 18 of them ( 46 11%) with signal-to-noise ratiosin the range of S /N 4.2–37.4. Towards four SMGs (AzTEC2, 5, 8, and 11), we detected two separate 3 GHz sources with projectedseparations of 1. 5–6. 6, but they might be physically related in only one or two cases (AzTEC2 and 11). Using two-dimensionalelliptical Gaussian fits, we derived a median deconvolved major axis FWHM size of 0. 54 0. 11 for our 18 SMGs detected at 3 GHz.For the 15 SMGs with known redshift we derived a median linear major axis FWHM of 4.2 0.9 kpc. No clear correlation wasfound between the radio-emitting size and the 3 GHz or submm flux density, or the redshift of the SMG. However, there is a hint oflarger radio sizes at z 2.5–5 compared to lower redshifts. The sizes we derived are consistent with previous SMG sizes measuredat 1.4 GHz and in mid-J CO emission, but significantly larger than those seen in the (sub)mm continuum emission (typically probingthe rest-frame far-infrared with median FWHM sizes of only 1.5–2.5 kpc). One possible scenario is that SMGs have i) an extendedgas component with a low dust temperature, which can be traced by low- to mid-J CO line emission and radio continuum emission;and ii) a warmer, compact starburst region giving rise to the high-excitation line emission of CO, which could dominate the dustcontinuum size measurements. Because of the rapid cooling of cosmic-ray electrons in dense starburst galaxies ( 104 –105 yr), themore extended synchrotron radio-emitting size being a result of cosmic-ray diffusion seems unlikely. Instead, if SMGs are drivenby galaxy mergers – a process where the galactic magnetic fields can be pulled out to larger spatial scales – the radio synchrotronemission might arise from more extended magnetised interstellar medium around the starburst region.Key words. galaxies: evolution – galaxies: formation – galaxies: starburst – galaxies: star formation – radio continuum: galaxies –submillimeter: galaxies1. IntroductionSubmillimetre galaxies (SMGs; e.g. Smail et al. 1997; Hugheset al. 1998; Barger et al. 1998) are a population of distantgalaxies where star formation is heavily obscured by the dustyinterstellar medium (ISM). The star formation rates (SFRs)in SMGs lie in the range of 102 –103 M yr 1 , and hencethese galaxies stand out as the most intense starbursts in the Appendices are available in electronic form athttp://www.aanda.orguniverse (for reviews, see Blain et al. 2002; Casey et al. 2014).As the potential precursors to the present-day massive elliptical galaxies, SMGs have become one of the primary targets for understanding galaxy evolution across cosmic time(e.g. Swinbank et al. 2006; Fu et al. 2013; Toft et al. 2014;Simpson et al. 2014). In the context of this evolutionary connection, determining the sizes and size evolution of SMGs iscrucial.Nearly all of the cm-wavelength radio emission from starforming galaxies, such as SMGs, is non-thermal synchrotronArticle published by EDP SciencesA32, page 1 of 18
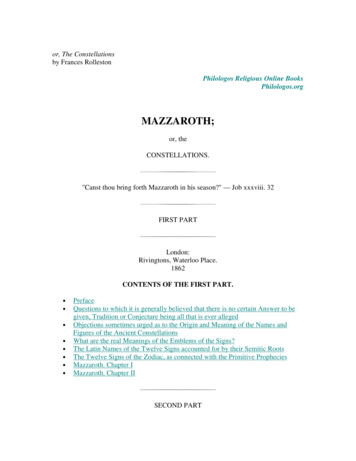
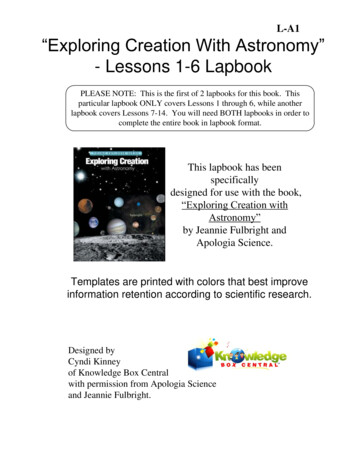
A&A 584, A32 (2015)radiation from relativistic electrons accelerated in supernova(SN) remnants produced by the short-lived, high-mass OB-typestars (M 8 M ; main-sequence lifetime τMS 30 Myr).Because SNe trace the recent/on-going star formation, the radiosynchrotron emission has the potential to trace the spatial scaleson which star formation is occurring. This connection betweenradio emission and star formation is strongly supported by theclose infrared (IR)-radio correlation observed in galaxies (e.g.Helou et al. 1985; Beck & Golla 1988; Xu et al. 1992; Condon1992; Yun et al. 2001; Bell 2003; Tabatabaei et al. 2007; Murphyet al. 2008; Sargent et al. 2010; Morić et al. 2010; Dumas et al.2011). On the basis of this correlation, the IR-emitting regionof a star-forming galaxy is expected to be comparable in sizeto that of radio continuum emission. However, the most recent studies of the sizes of IR-emitting regions of SMGs basedon continuum imaging observations with the Atacama LargeMillimetre/submillimetre Array (ALMA) show that these aresignificantly smaller than SMG radio sizes presented in the literature (Simpson et al. 2015a; Ikarashi et al. 2015). A possible explanation for this discrepancy, as suggested by Simpsonet al. (2015a), is cosmic ray (CR) diffusion in the galactic magnetic field away from their acceleration site, which would render larger radio sizes. To test this further here we present astudy of radio sizes of SMGs from a well selected sample ofSMGs in the Cosmic Evolution Survey (COSMOS; Scovilleet al. 2007) deep field using radio data from the Karl G. JanskyVery Large Array (VLA)-COSMOS 3 GHz Large Project (1σnoise of 2.3 μJy beam 1 , angular resolution 0. 75; Smolčić et al.,in prep.). We describe the SMG sample and the employed VLAdata in detail in Sect. 2. The 3 GHz images are presented inSect. 3, and the analysis (size measurements and radio spectralindices) are presented in Sect. 4. We compare our results withliterature studies in Sect. 5, discuss the results in Sect. 6, andsummarise the main results of the paper in Sect. 7.To be consistent with the most recent results from thePlanck mission (Planck Collaboration XIII 2015), the cosmology adopted in the present work corresponds to the flat ΛCDMuniverse with the dark energy density ΩΛ 0.692, total(dark luminous baryonic) matter density Ωm 0.308, and aHubble constant of H0 67.8 km s 1 Mpc 1 .2. Data2.1. Source sampleThe target SMGs of the present study – AzTEC1–30 – were originally discovered in the JCMT/AzTEC 1.1 mm continuum survey (18 resolution) towards a COSMOS subfield (0.15 deg2 insize) by Scott et al. (2008). The signal-to-noise ratios (S/N) ofthese SMGs were found to be in the range of S /N1.1 mm 4.0–8.3(see Table 1 in Scott et al. 2008). The 15 brightest sources,AzTEC1–15 (S /N1.1 mm 4.6), were imaged (and detected)with the Submillimetre Array (SMA) at 890 μm (2 resolution)by Younger et al. (2007, 2009). More recently, AzTEC16–30(S /N1.1 mm 4.0–4.5) were imaged with the Plateau de BureInterferometer (PdBI) at 1.3 mm ( 1. 8 resolution) by Miettinenet al. (2015). These interferometric follow-up studies have allowed us to accurately determine the position of the actual SMGsgiving rise to the millimetre continuum emission seen in thesingle-dish AzTEC maps and, in eight cases, to resolve thesingle-dish emission into multiple (two to three) components(at 2 resolution). This way, we can reliably identify the correct 3 GHz counterparts of the target SMGs. We note that eventhe faintest component in our source sample (AzTEC26b) has aA32, page 2 of 18Fig. 1. Redshift distribution of the target SMGs divided into three subsamples: the red and green histograms show the spectroscopic and photometric redshifts, respectively, while the blue histogram shows theredshift values derived from the radio-to-submm spectral index (seeTable 1). The redshift bins have a width of Δz 0.4. The lower redshift limits were placed in the bins corresponding to those values.1.3 mm flux density of 0.9 mJy, which corresponds to 4 mJyat the observed-frame 850 μm (assuming a dust emissivity indexof β 1.5; see Miettinen et al. 2015), and hence can be considered an SMG (cf. the classic SMG threshold of S 850 μm 5 mJyrefers to bright SMGs e.g. Hainline et al. 2009; González et al.2011). We also note that none of these SMGs has been detectedin X-rays, and hence they do not appear to harbour any strong active galactic nucleus (AGN; a typical 3σ upper limit to the fluxdensity in the 0.5–2 keV band data of the Chandra COSMOSLegacy Survey is 6 10 16 erg cm 2 s 1 , F. Civano et al.,in prep.). This suggests that the observed radio emission fromour SMGs is predominantly powered by star formation. This isfurther supported by the fact that none of our SMGs were detected with the Very Long Baseline Array (VLBA) observationsat a high, milliarcsec resolution at 1.4 GHz (Herrera Ruiz et al.,VLBAin prep.), yielding a 3σ flux density upper limit to S 1.4GHz of 1 1 60 μJy beam .Our sample of 39 SMGs is listed in Table 1. The coordinates given in the table correspond to the (sub)mm peak positions determined in the aforementioned SMA and PdBI studies. Table 1 also provides the source redshifts that are basedon spectroscopic measurements (seven sources), optical to nearinfrared (NIR) spectral energy distribution fitting (i.e. photometric redshift; 17 sources), and radio/submm flux density ratios(15 sources). The redshift distribution is shown in Fig. 1. We refer to Miettinen et al. (2015, and references therein) for furtherdetails and discussion on the redshifts of our SMGs.2.2. VLA 3 GHz radio continuum dataThe observations used in the present paper were taken by theVLA-COSMOS 3 GHz Large Project (PI: Smolčić; Smolčićet al., in prep.). Details of the observations, data reduction, andimaging can be found in Novak et al. (2015), Smolčić et al.(2015a), and Smolčić et al. (in prep.). In the present paper,1As described in Appendix A, we have detected two 3 GHz sourcestowards AzTEC8. The western radio source is associated with our targetSMG, while the eastern 3 GHz source, physically unrelated to the SMG,is also detected at 1.4 GHz with the VLBA.
O. Miettinen et al.: Spatial extent of radio emission in the COSMOS SMGsTable 1. Source list.Source α2000.0[h:m:s]09 59 42.8610 00 08.0510 00 20.7009 59 31.7210 00 19.7510 00 06.5010 00 18.0609 59 59.3409 59 57.2509 59 30.7610 00 08.9110 00 08.9410 00 35.2909 59 37.0510 00 10.0310 00 09.6310 00 12.8909 59 50.06909 59 39.19409 59 38.90409 59 42.60710 00 28.73510 00 29.25610 00 20.25110 00 02.55810 00 02.71010 00 02.85609 59 50.68109 59 31.39910 00 38.96910 00 39.41010 00 39.194.09 59 59.38609 59 59.65710 00 39.21110 00 04.68010 00 26.35110 00 26.56110 00 03.552δ2000.0[ : : ] 02 29 38.2 02 26 12.2 02 35 20.5 02 30 44.0 02 32 04.4 02 38 37.7 02 48 30.5 02 34 41.0 02 27 30.6 02 40 33.9 02 40 09.6 02 40 12.3 02 43 53.4 02 33 20.0 02 30 14.7 02 30 18.0 02 34 35.7 02 44 24.50 02 34 03.83 02 34 04.69 02 35 36.96 02 32 03.84 02 32 09.82 02 41 21.66 02 46 41.74 02 46 44.51 02 46 40.80 02 28 19.06 02 36 04.61 02 38 33.90 02 38 46.97 02 38 54.46. 02 38 15.36 02 38 21.08 02 40 52.18 02 30 37.30 02 37 44.15 02 38 05.14 02 33 00.94Redshiftaz referenceazspec 4.3415zspec 1.125zspec 5.298zphot 4.93 0.43 1.11zphot 3.05 0.33 0.28zradio/submm 3.52zphot 2.30 0.10zspec 3.179zphot 1.07 0.11 0.10zphot 2.79 1.86 1.29zspec 1.599zspec 1.599zphot 2.54 0.13 0.33zradio/submm 4.07zradio/submm 2.95zphot 1.30 0.12 0.36zphot 3.17 0.29 0.37zradio/submm 2.42zspec 0.834zphot 4.14 0.87 1.73zphot 3.00 0.19 0.17zphot 3.20 0.18 0.45zphot 1.11 0.10zradio/submm 2.35zphot 2.60 0.18 0.17zphot 2.80 0.14 0.16zradio/submm 1.93zradio/submm 3.00zphot 1.60 0.28 0.50zradio/submm 2.35zradio/submm 2.28zradio/submm 3.17.zphot 2.50 0.24 0.14zradio/submm 1.79zradio/submm 4.17zradio/submm 3.11zradio/submm 2.96zphot 1.45 0.79 0.38zradio/submm 2.5112344546447745544575555555555555.5555555Notes. The coordinates given in Cols. (2) and (3) for AzTEC1–15 referto the SMA 890 μm peak position (Younger et al. 2007, 2009), whilethose for AzTEC16–30 are the PdBI 1.3 mm peak positions (Miettinenet al. 2015). (a) The zspec , zphot , and zradio/submm values are the spectroscopic redshift, optical-NIR photometric redshift, and the redshiftderived using the Carilli-Yun redshift indicator (Carilli & Yun 1999,2000). The z references in the last column are as follows: 1 Yun et al.(2015); 2 Baloković et al. (in prep.); 3 Riechers et al. (2010) andCapak et al. (2011); 4 Smolčić et al. (2012); 5 Miettinen et al.(2015); 6 Riechers et al. (in prep.); 7 M. Salvato et al. (in prep.)(b)AzTEC11 was resolved into two 890 μm sources (N and S) byYounger et al. (2009). The two components are probably physically related, i.e. are at the same redshift (see Appendix A). (c) AzTEC14 wasresolved into two 890 μm sources (E and W) by Younger et al. (2009).The eastern component appears to lie at a higher redshift than the western one (Smolčić et al. 2012). (d) AzTEC25 was not detected in the1.3 mm PdBI observations (Miettinen et al. 2015).we employ – for the first time – the final, full 3 GHz mosaicimaging of COSMOS (192 pointings in total). Briefly, these Sband observations were carried out with the VLA of the NRAO2in its A and C configurations (maximum baseline of 36.4 kmand 3.4 km, respectively) between 2012 and 2014. The 2 GHzbandwidth (2 basebands of 1 GHz each) used was divided into16 sub-bands/spectral windows (SPWs) each with a 128 MHz2The National Radio Astronomy Observatory is a facility of theNational Science Foundation operated under cooperative agreement byAssociated Universities, Inc.bandwidth. Each SPW was subdivided into 64 spectral channels with a width of 2 MHz. The data were calibrated usingthe AIPSLite data reduction pipeline, which is an extension ofNRAO’s Astronomical Image Processing System (AIPS)3 package (Bourke et al. 2014; Mooley et al., in prep.), and adaptedfor the VLA-COSMOS 3 GHz Large Project (for details, seeSmolčić et al., in prep.). Further editing, flagging, and imagingwas done using the Common Astronomy Software Applicationspackage (CASA4 ; McMullin et al. 2007). To reduce sidelobesand artefacts in the data, phase solutions obtained from selfcalibration with the bright quasar J1024-0052 were applied oneach pointing. Every field was cleaned down to 5σ, and furthercleaned down to 1.5σ using manually defined masks around thesources.The data used here were imaged using the multi-scale multifrequency synthesis (MS-MFS) method (Rau & Cornwell 2011).Briggs or robust weighting was applied to the calibrated visibilities with a robust value of 0.5. Considering the aim of thepresent study (i.e. measuring the 3 GHz sizes of our SMGs),the main advantage of MS-MFS is that the final image resolution is not determined by the lowest frequency of the bandwidthused because all the SPWs are used in the image deconvolution. A Gaussian u-v tapering was applied on each pointing using their own Gaussian beam size (Full Width at Half Maximumor FWHM). The final mosaic was restored with a circular synthesised beam size (FWHM) of θmaj θmin 0. 75, where θmajand θmin are the major and minor axes of the beam. The final 1σroot mean square (rms) noise level in our maps is typically about2.3 μJy beam 1 .To quantify the effect of bandwidth smearing (BWS) in our3 GHz mosaic, we examined the behaviour of the ratio of thetotal integrated source flux density to its peak surface brightness as a function of the S/N (e.g. Bondi et al. 2008; Novaket al. 2015; Smolčić et al., in prep.). This comparison showedthat the effect of BWS in the full 3 GHz mosaic of COSMOS isonly up to 3%, and no correction for BWS in the peak surfacebrightness is applied in the present study. To further examine theimportance of BWS, we created images of a subsample of oursources from separate pointings where the source distance fromthe (nearest) phase centre is different. In addition to dependingon the fractional bandwidth, the magnitude of BWS is directlyproportional to the angular distance of the source from the phasecentre. However, no significant radial smearing was seen in theaforementioned images, which lends further support to negligible BWS.3. 3 GHz images and counterpart identificationof the AzTEC SMGsThe 3 GHz images towards our SMGs are shown in Fig. 2.We note that at the redshifts of our sources, z 0.834–5.298,we are probing rest-frame frequencies of νrest 5.5–19 GHz(λrest 1.6–5.5 cm), which are dominated by non-thermal synchrotron radiation with the fraction of thermal emission becoming increasingly important at higher frequencies (e.g. Condon1992; Murphy et al. 2012b). The 3 GHz counterparts of our3http://www.aips.nrao.edu/index.shtmlCASA is developed by an international consortium of scientists based at the NRAO, the European Southern Observatory(ESO), the National Astronomical Observatory of Japan (NAOJ), theCSIRO Australia Telescope National Facility (CSIRO/ATNF), and theNetherlands Institute for Radio Astronomy (ASTRON) under the guidance of NRAO. See http://casa.nrao.edu4A32, page 3 of 18
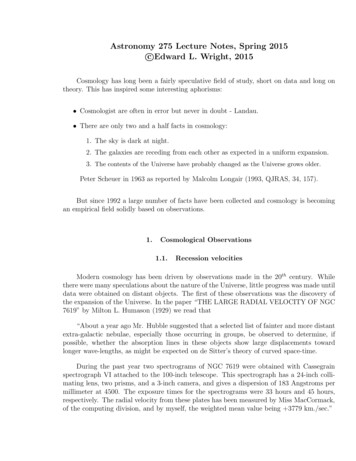
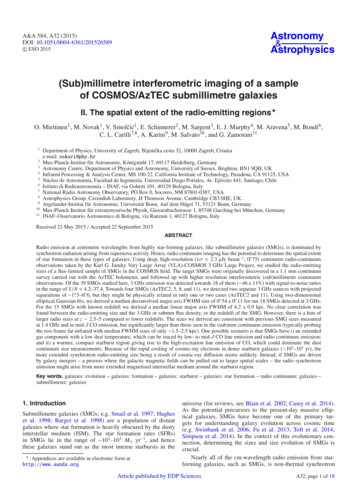
A&A 584, A32 (2015)Fig. 2. VLA 3 GHz images towards AzTEC1–30 displayed with north up and east left. The greyscale images are shown with power-law scaling(except for AzTEC28, where arcsinh scaling is used to better illustrate the intensity scale; a power-law scaling would be completelyblack), and the overlaid red contours start from 3σ and increase in steps of 1σ except for AzTEC5, 7, 8, 11, 12, 22, and 24 where the step is 2 σ. The whitedashed contours show the corresponding negative features (starting from 3σ). The plus sign in each panel marks the (sub)mm peak position(SMA 890 μm for AzTEC1–15: PdBI 1.3 mm for AzTEC16–30). The black thick ellipse shows the resulting Gaussian fit to the source (centred atthe peak position, FWHM size, and PA). For AzTEC2 (both components), 3, 4, 5 (both components), 7, 8 (both components), 11-N, 11-S, and 12the size represents an upper limit (see Table 2). Moreover, for AzTEC4 the peak position was not well determined, and for AzTEC9, 17a, and 27only the major axis FWHM could be determined by JMFIT. The blue filled circle shows the synthesised beam size (0. 75 FWHM). We note thatthe areal coverage of the images differs from each other for illustrative purposes; a scale bar indicating the 1 projected length is shown in eachpanel, annotated with the corresponding proper length [kpc] at the quoted SMG redshift (except when only a lower limit to z is available).SMGs were identified by eye inspection of the correspondingimages. The SMGs AzTEC1–9, 11-N and 11-S, 12, 15, 17a, 19a,21a, 24b, and 27 are found to be associated with a 3 GHz source(with a median offset of 0. 26; Table 2), i.e. 18/39 or 46% (witha Poisson error on counting statistics of 11%) of our sources areA32, page 4 of 183 GHz-emitting SMGs. The S /N of our detected 3 GHz sourcesare in the range of S /N 4.2–37.4, AzTEC7 being the mostsignificant detection. We note that the detection S/N at 1.1 mmof these 3 GHz-emitting SMGs was found to be in the range ofS /N1.1 mm 4.0–8.3 (Scott et al. 2008). To summarise, 18 SMGs
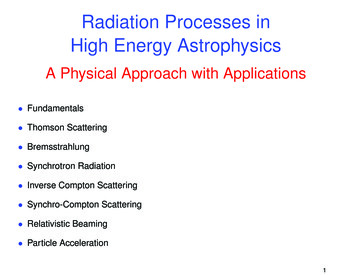
O. Miettinen et al.: Spatial extent of radio emission in the COSMOS SMGsFig. 2. continued.in our sample are found to be associated with 3 GHz emission. Aselection of these SMGs, and the additional 3 GHz radio sourcesnot analysed further in the present study are discussed in moredetail in Appendices A and B, respectively. The SMGs not detected at 3 GHz are discussed in Appendix C.4. Analysis4.1. Measuring the size of the radio-emitting regionWe used AIPS package to determine the deconvolved sizes ofour 3 GHz sources. Two-dimensional elliptical Gaussian fits tothe image plane data were made using the AIPS task JMFIT. Thefitting was performed inside a box containing the source, and thefit was restricted to the pixel values of 2.5σ. The results aregiven in Table 2, and illustrated in Fig. 2. To test the reliabilityof our size measurements, we simulated SMGs with an assignedsize and varying S/N, and fit them in the same manner as thereal sources. These simulations, described in Appendix D, suggest that the sizes provided by JMFIT are generally robust withinthe uncertainties assigned by the fitting task (see Fig. D.1, lowerpanel). As is often done in radio-continuum surveys, we considered a source to be resolved if its deconvolved FWHM size islarger than one-half the synthesised beam FWHM (e.g. Mundellet al. 2000; Ho & Ulvestad 2001; Urquhart et al. 2009). AzTEC1,6, 15, 19a, 21a, and 24b are resolved in both θmaj and θmin , whileA32, page 5 of 18
A&A 584, A32 (2015)Table 2. Results of Gaussian fits to the 3 GHz sources.α2000.0 a[h:m:s]Source IDδ2000.0 a[ : : ]I3 GHz b[μJy beam 1 ]S 3 GHz b[μJy]S /N[ ]FWHM sizec[kpc]PAc[ ]Offset[ ]AzTEC109 59 42.86( 0.003) 02 29 38.20( 0.05)18.3 2.428.3 5.28.0 0.190.67 0.17 0.20 0.43 0.30 1.34.6 1.2 1.4 3.0 2.1118.1 31.8 31.80AzTEC2d10 00 08.04( 0.003) 02 26 12.26( 0.06)15.0 2.418.9 4.76.00.54 0.22 0.38 0.21170.9 32.6 32.70.1610 00 08.01( 0.007) 02 26 10.81( 0.08)10.0 2.414.0 5.04.30.72 0.31 0.44 0.384.6 1.8 3.2 1.8.72.6 28.8 28.8AzTEC310 00 20.69( 0.003) 02 35 20.37( 0.04)19.6 2.319.6 2.38.5 0.38 2.4.0.20AzTEC409 59 31.70( 0.06) 02 30 43.96( 0.14)11.4 2.331.5 7.75.31.72 0.37 0.39 0.38150.6 8.3 8.30.31AzTEC5d10 00 19.75( 0.001) 02 32 04.29( 0.02)49.2 2.485.8 5.821.40.95 0.07 0.38 0.0711.1 2.4 2.5 2.541.3 4.5 4.50.118.7 1.2 1.4 3.3 2.0(6.9 1.9 2.3 3.2 3.2 )3.5 0.4 3.2 0.43.2 0.8 2.9 1.381.3 8.4 8.46.56154.3 22.5 22.60.347.5 0.5 3.0 0.61.5110 00 19.98( 0.003) 02 32 09.98( 0.03)24.0 2.442.8 5.910.7AzTEC6e10 00 06.49( 0.005) 02 38 37.40( 0.09)12.3 2.322.4 5.85.4AzTEC710 00 18.06( 0.001) 02 48 30.43( 0.01)89.5 2.498.4 4.437.4AzTEC8d09 59 59.33( 0.001) 02 34 41.05( 0.02)38.8 2.449.4 4.816.3 0.381.00 0.14 0.16 0.260.92 0.26 0.30 0.43 0.43 0.380.42 0.04 0.050.41 0.10 0.38 0.1709 59 59.51( 0.001) 02 34 41.60( 0.01)73.5 2.473.5 2.429.4 0.38 3.2.2.62AzTEC9 f09 59 57.29( 0.002) 02 27 30.54( 0.03)29.4 2.233.3 4.313.0θmaj 0.40 0.13 0.17θmaj 3.3 1.1 1.433.2 24.1 24.10.60AzTEC11-N10 00 08.90( 0.001) 02 40 09.52( 0.01)57.0 2.367.5 4.624.40.40 0.07 0.08 0.383.5 0.6 0.7 3.331.3 20.5 20.50.170.48 0.04 0.05 0.380.63 0.10 0.10 0.38 0.261.21 0.29 0.32 0.50 0.50θmaj 0.45 0.10 0.12 0.210.54 0.11 0.14 0.44 0.14 0.401.34 0.44 0.67 0.32 0.50 0.150.45 0.13 0.19 0.43 0.17 0.34θmaj 0.92 0.414.2 0.3 0.5 3.35.2 0.8 0.8 3.19.4 2.2 3.9 2.0 3.9 2.5θmaj 3.5 0.8 0.9 1.64.2 0.8 1.1 3.4 1.1 3.311.0 3.6 5.5 2.6 4.1(3.8 1.1 3.6 1.3 1.4 ) 1.6(θmaj 6.4 2.4 2.8 )163.2 14.1 14.11.40AzTEC11-S10 00 08.94( 0.001) 02 40 10.90( 0.01)77.5 2.399.6 4.833.3AzTEC1210 00 35.30( 0.002) 02 43 53.27( 0.02)36.5 2.552.5 5.214.4AzTEC1510 00 12.95( 0.006) 02 34 34.92( 0.10)12.2 2.427.9 6.95.4AzTEC17a f09 59 39.19( 0.001) 02 34 03.58( 0.02)34.9 2.340.8 4.415.1AzTEC19a10 00 28.72( 0.002) 02 32 03.68( 0.03)31.6 2.245.3 5.014.7AzTEC21a10 00 02.63( 0.01) 02 46 42.14( 0.10)9.4 2.325.7 7.94.2AzTEC24be10 00 39.28( 0.002) 02 38 45.14( 0.03)28.0 2.237.6 4.712.6AzTEC27e, f10 00 39.21( 0.004) 02 40 52.65( 0.12)9.9 2.312.6 4.84.329.8 6.1 6.246.4 0 00.070.1678.1 14.8 14.80.20146.3 31.0 15.51.1934.4 17.1 17.10.26174.3 44.2 44.30.2795.2 21.8 21.81.1561.3 0 02.6710.1 13.0 13.10.47Notes. The meaning of columns is as follows: (1): SMG name; (2) and (3): peak position of the fitted Gaussian; (4): peak surface brightness;(5): total flux density provided by the Gaussian fit; (6): S/N as determined from the maximum pixel value with respect to the rms map noise;(7) and (8): deconvolved FWHM size (θmaj θmin ) in arcsec and physical kpc; (9) position angle of the fitted Gaussian measured from norththrough east; (10): projected angular offset from the (sub)mm position. (a) Formal 1σ uncertainties in seconds for α2000.0 and arcseconds forδ2000.0 returned by JMFIT are given in parentheses. (b) The quoted error in I3 GHz is the 1σ rms noise in the map determined inside a 300 box placed near the SMG, and which did not include any 3 GHz sources. The uncertainty in S 3 GHz represents the formal error determined withJMFIT. The uncertainties do not include the absolute calibration uncertainty. (c) The size and PA uncertainties represent the minimum/maximumvalues as returned by JMFIT. We note that the PA is formally defined to range from 0 to 180 , but for example for AzTEC2 the maximumPA value is 203. 5, which is equivalent to an angle of 203. 5–180 23. 5. The minimum and maximum PA values for AzTEC8 and 24b areequal to the nominal value, and hence the quoted uncertainties are equal to zero. (d) Two 3 GHz sources were detected. No linear size is reportedfor the secondary component towards AzTEC2 because of its unknown redshift. (e) For AzTEC6, 24b, and 27 only a lower redshift limit isavailable (see Table 1), and the linear FWHM size quoted in parentheses was calculated at that lower z limit; these linear sizes were not includedin the statistical size analysis. ( f ) For AzTEC9, 17a, and 27 only the major axis could be determined by JMFIT (minor axis 0).AzTEC2 (both components), 4, 5 (both components), 7, 8, 11-N,11-S, and 12 are resolved in θmaj but unresolved in θmin . AzTEC3and the additional component towards AzTEC8 are unresolvedin both axes. The upper size limit for unresolved sources was setto one-half the synthesised beam FWHM ( 0. 38). For AzTEC9,17a, and 27 only the major axis FWHM could be determined byJMFIT, while the fitting task did not provide a value for the minor axis FWHM (the output value 0). In Col. 8 in Table 2,we give the projected linear FWHM size for those SMGs withknown redshift (i.e. not just a lower limit to z derived using theCarilli & Yun (1999, 2000) method). As mentioned earlier inSect. 2.2, no correction for the negligible BWS in the peak surface brightness or FWHM size was applied.To calculate the statistical properties of our radio-emissionsize distribution, we applied survival analysis to take the upper limits to the size into account. We assumed that the censored data follow the same distribution as the uncensored values, and we used the Kaplan-Meier (K-M) method to construct amodel of the input data (for this purpose, we used the NondetectsAnd Data Analysis for environmental data (NADA; Helsel 2005)package for R). However, because more than 50% of our minoraxis data are censored, the K-M estimator could not be used todetermine the median value of the minor axis length, and henceA32, page 6 of 18Table 3. 3 GHz size distribution statistics.ParameterMean θmajMedian θmajMean θminMedian θmin bStandard deviation of θmajStandard deviation of θmin95% confidence interval of θmaj c95% confidence interval of θmin cValuea0. 71 0. 09 (5.5 0.7 kpc)0. 54 0. 11 (4.2 0.9 kpc)0. 45 0. 02 (3.3 0.2 kpc)0. 35 0. 04 (2.3 0.4 kpc)0. 39 (2.9 kpc)0. 07 (0.8 kpc)0. 54–0. 89 (4.0–6.9 kpc)0. 42–0. 49 (2.9–3.7 kpc) Notes. (a) The sample size of the major (minor) axis angular sizes is18 (15), while that of the linear sizes is 15 (13), i.e. the number ofSMGs with either a zspec or zphot value available. (b) The median valueof θmin could not be derived using the K-M estimator. Hence, it wascalculated using the MLE (assuming lognormal distribution), which isalmost identical to the K-M function. (c) A two-sided 95% confidenceinterval for the mean value computed using the K-M method.its value was derived using the Maximum Likelihood Estimator(MLE) of the survivor function. The mean, median, standard deviation, and 95% confidence interval of the deconvolved FWHMsizes are given in Table 3. For example, the median value of
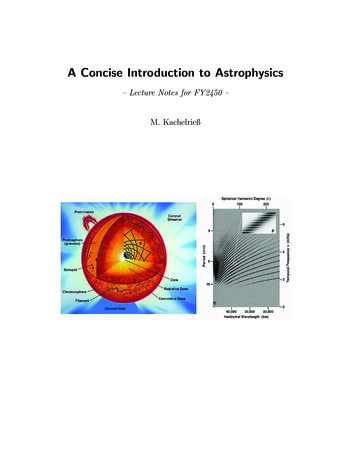
O. Miettinen et al.: Spatial extent of radio emission in the COSMOS SMGsTable 4. Radio continuum characteristics of the 3 GHz detections.Source zTEC15AzTEC17aAzTEC19aAzTEC21aAzTEC24bAzTEC27Fig. 3. Top: angular FWHM of the major axis at 3 GHz as a functi
VLA-COSMOS 3 GHz Large Project (PI: Smolciˇ c; Smol ciˇ c et al., in prep.). Details of the observations, data reduction, and imaging can be found in Novak et al. (2015), Smolˇci cetal. (2015a), and Smolciˇ c et al. (in prep.). In the present paper, 1 As de