Transcription
Astronomy 275 Lecture Notes, Spring 2015c Edward L. Wright, 2015Cosmology has long been a fairly speculative field of study, short on data and long ontheory. This has inspired some interesting aphorisms: Cosmologist are often in error but never in doubt - Landau. There are only two and a half facts in cosmology:1. The sky is dark at night.2. The galaxies are receding from each other as expected in a uniform expansion.3. The contents of the Universe have probably changed as the Universe grows older.Peter Scheuer in 1963 as reported by Malcolm Longair (1993, QJRAS, 34, 157).But since 1992 a large number of facts have been collected and cosmology is becomingan empirical field solidly based on observations.1.Cosmological Observations1.1.Recession velocitiesModern cosmology has been driven by observations made in the 20th century. Whilethere were many speculations about the nature of the Universe, little progress was made untildata were obtained on distant objects. The first of these observations was the discovery ofthe expansion of the Universe. In the paper “THE LARGE RADIAL VELOCITY OF NGC7619” by Milton L. Humason (1929) we read that“About a year ago Mr. Hubble suggested that a selected list of fainter and more distantextra-galactic nebulae, especially those occurring in groups, be observed to determine, ifpossible, whether the absorption lines in these objects show large displacements towardlonger wave-lengths, as might be expected on de Sitter’s theory of curved space-time.During the past year two spectrograms of NGC 7619 were obtained with Cassegrainspectrograph VI attached to the 100-inch telescope. This spectrograph has a 24-inch collimating lens, two prisms, and a 3-inch camera, and gives a dispersion of 183 Angstroms permillimeter at 4500. The exposure times for the spectrograms were 33 hours and 45 hours,respectively. The radial velocity from these plates has been measured by Miss MacCormack,of the computing division, and by myself, the weighted mean value being 3779 km./sec.”
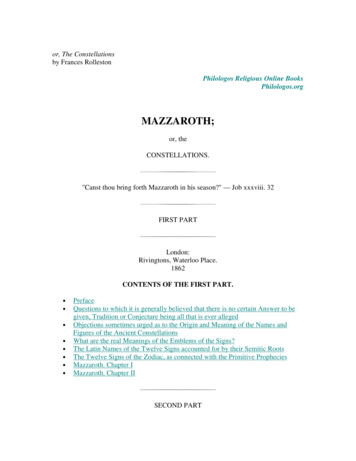
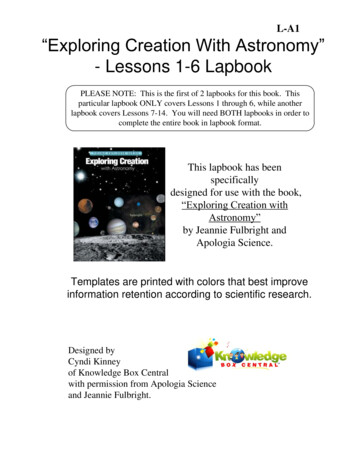
Note that NGC 7619 is a 12th magnitude galaxy and the observational limit now isB 24th magnitude, and especially note the total exposure time of 78 hours!“A RELATION BETWEEN DISTANCE AND RADIAL VELOCITY AMONG EXTRAGALACTIC NEBULAE by Edwin Hubble (1929) takes the radial velocities for 24 galaxieswith “known” distances and fits them to the formv Kr X cos α cos δ Y sin α cos δ Z sin δ(1)where K is the coefficient relating velocity to distance in a linear velocity distance law,while (X, Y, Z) are the contribution of the solar motion to the radial velocity. Hubblefound a solution corresponding to solar motion of 280 km/sec toward galactic coordinatesl 65, b 18. Modern determinations give 308 km/sec toward l 105, b 7 (Yahil,Tammann & Sandage, 1977), so this part of the fit has remained quite stable. Figure 1 showsthe velocities corrected for the motion of the galaxy, v (X cos α cos δ Y sin α cos δ Z sin δ),plotted vs. distance. But the value of K 500 km s 1 Mpc 1 derived by Hubble in 1929 ismuch too large, because his distances were much too small. Nonetheless, this discovery thatdistant galaxies have recession velocities proportional to their distances is the cornerstone ofmodern cosmology.In modern terminology, Hubble’s K is denoted H , and called the Hubble constant. Sinceit is not really a constant, but decreases as the Universe gets older, some people call it theHubble parameter.This velocity field, v H r, has the very important property that its form is unchangedby a either a translation or a rotation of the coordinate system. To have a relation unchangedin form during a coordinate transformation is called an isomorphism. The isomorphismunder rotations around the origin is obvious, but to see the effect of translations considerthe observations made by astronomers on a galaxy A with position rA relative to us and avelocity vA H rA relative to us. Astronomers on A would measure positions relative tothemselves r′ r rA and velocities relative to themselves, v ′ v vA . But v ′ H r H rA H ( r rA ) H r′(2)so astronomers on galaxy A would see the same Hubble law that we do.Thus even though we see all galaxies receding from us, this does not mean that we arein the center of the expansion. Observers on any other galaxy would see exactly the samething. Thus the Hubble law does not define a center for the Universe. Other forms forthe distance-velocity law do define a unique center for the expansion pattern: for exampleneither a constant velocity v v r̂ nor a quadratic law v Mr 2 r̂ are isomorphic undertranslations.In actuality one finds that galaxies have peculiar velocities in addition to the Hubblevelocity, with a magnitude of 500 km/sec. In order to accurately test the Hubble law, oneneeds objects of constant or calibratable luminosities that can be observed at distances large2
Velocity [km/sec]1000500001Distance [Mpc]Fig. 1.— Hubble’s data in 1929.32
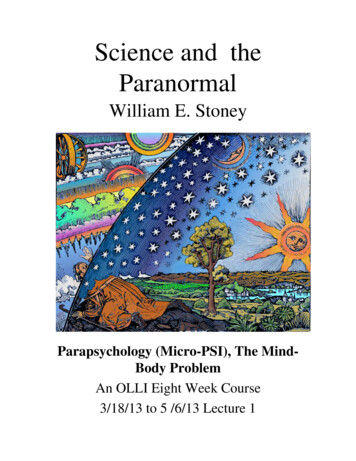
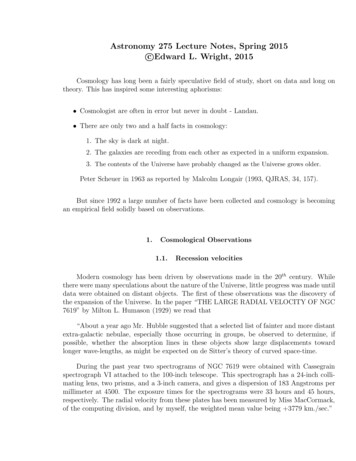
Velocity [km/sec]30000200001000000100200300Distance [Mpc]Fig. 2.— Distance vs. redshift for Type Ia Sne4400500
enough so the Hubble velocity is 500 km/sec. Type Ia supernovae are very bright, andafter a calibration based on their decay speed, they have very small dispersion in absolutemagnitude. Riess, Press & Kirshner (1996) find that slope in a fit of velocities to distancemoduli, log v a(m M) b, is a 0.2010 0.0035 while the Hubble law predicts a 1/5.Thus the Hubble law has a good theoretical basis and is well-tested observationally.The actual value of the Hubble constant H is less well determined since it requires themeasurement of absolute distances instead of distance ratios. But the situation is gettingbetter with fewer steps needed in the “distance ladder”. Currently the best Hubble constantdata come from Riess et al. (2011, arXiv:1103.2976) which gives 73.8 2.4 km s 1 Mpc 1 .Other measures include the DIRECT project double-lined eclipsing binary in M33 (Bonanoset al. 2006, astro-ph/0606279), Cepheids in the nuclear maser ring galaxy M106 (Macriet al. 2006, astro-ph/0608211), and the Sunyaev-Zel’dovich effect (Bonamente et al. 2006).These papers gave values of 61 4, 74 7 and 77 10 km s 1 Mpc 1 . Assuming that theuncertainties in these determinations are uncorrelated and equal to 10 km s 1 Mpc 1 afterallowing for systematics, the average value for H is 71 6 km s 1 Mpc 1 . This averageis consistent with the value from Riess et al. (2011). The most likely range now is the70 2.2 km s 1 Mpc 1 from CMB anisotropy studies based on the Hinshaw et al. (2012,arXiv:1212.5226) fit to the 9 year WMAP data alone, assuming that the Universe followsthe flat ΛCDM model. However, the Planck 2015 Results Paper I (arxiv:1502.01582) gives67.8 0.9 km s 1 Mpc 1 from CMB data alone (Table 9). Note that the weighted mean ofRiess et al. (2011) and Planck is 68.54 0.85 km s 1 Mpc 1 , and the χ2 of the fit to themean is 5.48 with 1 degree of freedom, corresponding to a 2.34σ discrepancy which wouldbe exceeded only 1% of the time by chance, so there may well be systematic errors lurkingin one or both of the methods. We will discuss many ways of measuring H later in thecourse. In many older cosmological papers the uncertain value of H is factored out usingthe notation h H /100 in the standard units of km s 1 Mpc 1 . Thus if a galaxy has aHubble velocity of 1500 km/sec, its distance is 15/h Mpc.While units of km s 1 Mpc 1 are commonly used for H , the metric units would besecond 1 . The conversion is simple: 1H 100 km s 1Mpc107 cm/sec1 3.2 10 18 s 1 243.085678 10 cm9.78 Gyr1.2.(3)AgeAnother observable quantity in the Universe is the age of the oldest things in it. Thereare basically three ways to find ages for very old things. The first and best known example isthe use of the HR diagram to determine the age of a star cluster. The luminosity of the starsjust leaving the main sequence (main sequence turnoff MSTO) varies like L M 4 , so themain sequence lifetime varies like t M 3 L 3/4 . This means that a 10% distance errorto globular cluster gives a 15-20% error in the derived age. Distances to globular clusters5
are determined from the magnitudes of RR Lyrae stars, and there are two different waysto estimate their absolute magnitudes. Using the statistical parallax of nearby RR Lyraestars gives an age for the oldest globular cluster of 18 2 Gyr, while using the RR Lyraestars in the LMC (Large Magellanic Cloud) as standards gives an age of 14 2 Gyr. UsingHIPPARCOS observations of nearby subdwarfs to calibrate the main sequence of globularclusters gives 11.7 1.4 Gyr (Chaboyer, Demarque, Kernan & Krauss 1998, Ap,J 494, 96).The globular clusters needed some time to form, so I will take t 12.2 1.5 Gyr for thismethod.The second technique for determining ages of stellar populations is to look for the oldestwhite dwarf. White dwarves are formed from stars with initial masses less than about 8 M so the first WDs form after about 20 million years. Once formed, WDs just get cooler andfainter. Thus the oldest WDs will be the least luminous and coolest WDs. These are thehardest to find, of course. However, there appears to be a sharp edge in the luminosityfunction of white dwarves, corresponding to an age of about 11 Gyr. Since these are diskstars, and the stars in the disk formed after the halo stars and globular clusters, this meansthat the age of the Universe is at least 12 Gyr, and I will take t 12.5 1.5 Gyr. BradHansen (of UCLA) et al.(2004, astro-ph/0401443) give 12.1 0.9 Gyr for the age of the whitedwarf population in the globular cluster M4. One pitfall in this method is the phenomenonof crystalization in white dwarf nuclei. When the central temperature get low enough, thenuclei arrange themselves into a regular lattice. As this happens, the WDs remain for a longtime at a fixed temperature and luminosity. After the heat of solidification is radiated away,the WD cools rapidly. Thus there will naturally be an edge in the luminosity function ofWDs caused by crystalization. While the best evidence is that the oldest WDs haven’t yetstarted to crystalize, the expected luminosity of a solidifying WD is only slightly below theobserved edge.The third way to measure the age of the Universe is to measure the age of the chemicalelements. This method relies on radioactive isotopes with long half-lives. It is very easyto make a precise measurement of the time since a rock solidified, and by applying thistechnique to rocks on the Earth an oldest age of 3.8 Gyr is found. But rocks that fall out ofthe sky, meteorites, are older. Given that 87 Rb decays to 87 Sr with a half-life of 47.5 Gyr, andthat rubidium and strontium collect in different minerals when a rock solidifies, it is possibleto get a precise reading of how long ago a rock was last molten. The Allende meteorite iswell studied and has an age of 4.554 Gyr. It is much more difficult to get an age for theUniverse as a whole, since one has to assume a model for the star formation history andfor stellar nucleosynthesis yields. For example, the ratio of 187 Re to 187 Os is less than thatpredicted by nucleosynthesis calculations, and 187 Re is radioactive. The derived average ageof the elements is 9.3 1.5 Gyr. Assuming that the elements in the Solar System (since the187Re:187 Os ratio can only be measured in the Solar System) were made uniformly betweenthe age of the Universe t and the formation of the Solar System, then t 14 3 Gyr.Dauphas (2005, Nature, 435, 1203) uses the 238 U:232 Th ratio in old stars and in the Earthto derive an age of t 14.5 2.8 2.2 Gyr.6
The weighted mean of 12.2 1.5, 12.5 1.5, 14 3 and 14.5 2.8 2.2 is 12.9 0.9 Gyr.The dimensionless product H t can be used to discriminate among cosmological models.Taking t 12.9 0.9 Gyr (the weighted mean of real age measurements) and H 73.8 2.4 km s 1 Mpc 1 from supernovae, this product isH t ht 0.97 0.08.9.78 Gyr(4)A more model dependent result comes from fits to CMB data. A flat ΛCDM modelfit to the WMAP 9 year data, the South Pole Telescope data, and the Atacama CosmologyTelescope data gives t 13.742 0.077 Gyr and H 70.5 1.6 km s 1 Mpc 1 (Hinshawet al. (2012, arXiv:1212.5226, Table 4, eCMB column). These values give H t 0.991 0.023. The Planck 2015 Results I paper gives t 13.799 0.038 Gyr and H 67.8 0.9 km s 1 Mpc 1 , so H t 0.957 0.013.1.3.Number countsWhile it took weeks of exposure time to measure the redshifts of galaxies in the 1920’s,it was much easier to photograph them and measure their magnitudes and positions. Animportant observable is the number of sources brighter than a given flux per unit solid angle.This is normally denoted N(S) or N( S), where S is the limiting flux, and N is the numberof objects per steradian brighter than S. In principle N(S) is a function of direction as wellas flux. In practice, for brighter galaxies, there is a very prominent concentration in theconstellation Virgo, known as the Virgo cluster, and toward a plane is the sky known as thesupergalactic plane. This larger scale concentration is known as the Local Supercluster.However, as one looks at fainter and fainter galaxies, the number of galaxies per steradiangets larger and larger, and also much more uniform across the sky. For optical observationsthe dust in the Milky Way creates a “zone of avoidance” where only a few galaxies are seen,but this effect is not seen in the infrared observations from the IRAS experiment. Thus it isreasonable to postulate that the Universe is isotropic on large scales, since the number countsof faint galaxies are approximately the same in all directions outside the zone of avoidance.Isotropic means the same in all directions. Mathematically isotropic means isomorphic underrotations.The slope of the number counts, d ln N/d ln S, is another observable quantity. If thesources being counted are uniformly distributed throughout space, than observing to a fluxlimit 4 times lower will allow one to see object twice as far away. But this volume is 8 timeslarger, so the slope of the source counts is ln 8/ ln 4 3/2. Hubble observed that thesource counts followed this law rather well, indicating that the galaxies beyond the LocalSupercluster but within reach of the 100 inch telescope and old photographic plates wereuniformly distributed in space. This implies that the Universe is homogeneous on large scales.7
Fig. 3.— The brick wall on the left is a homogeneous but not isotropic pattern, while thepattern on the right is isotropic (about the center) but no homogeneous.Just as homogenized milk is not separated into cream and skim milk, a homogeneous Universeis not separated into regions with different properties. Mathematically homogeneous meansisomorphic under translations.It is possible be isotropic without being homogeneous, but the isotropy will only holdat one or two points. Thus a sheet of polar coordinate graph paper is in principle isotropicaround its center, but it is not homogeneous. The meridians on a globe form an isotropicpattern around the North and South poles, but not elsewhere.It is also possible to be homogeneous but not isotropic. Standard square grid graph paperis in principle homogeneous but it is not isotropic since there are four preferred directions.A pattern like a brick wall is homogeneous but not isotropic. Note that a pattern that isisotropic around three or more points is necessarily homogeneous.1.4.CMBRIn 1964 Penzias & Wilson found an excess of radio noise in the big horn antenna atBell Labs. This excess noise was equivalent to 3.5 1 K. This means that a blackbodywith T 3.5 K would produce the same amount of noise. A blackbody is an object thatabsorbs all the radiation that hits it, and has a constant temperature. Penzias & Wilsonwere observing 4 GHz (λ 7.5 cm), and if the radiation were truly a blackbody, then it8
Wavelength [mm]2Intensity [MJy/sr]40010.670.5FIRAS data with 400σ errorbars2.725 K Blackbody30020010000510ν [1/cm]1520Fig. 4.— CMB Spectrum Measured by FIRAS on COBE.would follow the Planck radiation lawIν Bν (T ) 2hν ν 2c1exp(hν/kT ) 1(5)for all frequencies with a constant T . Here Iν is the intensity of the sky in units oferg/cm2 /sec/sr/Hz or W/m2 /sr/Hz or Jy/sr. Actually this blackbody radiation was firstseen at the same 100 inch telescope used to find the expansion of the Universe in the formof excitation of the interstellar cyanogen radical CN into its first excited state. This wasseen in 1939 but the resulting excitation temperature at λ 2.6 mm of 2.3 1 K wasnot considered significant. After 1964, many groups measured the brightness of the skyat many different wavelengths, culminating in Mather et al. (1999, 512, 511), which findsT 2.72528 0.00065 K for 0.5 mm to 5 mm wavelength. Fixsen (2009, arXiv:0911.1955)used a hybrid approach to find T : WMAP gave the CMB dipole amplitude in km/sec, whileFIRAS measured the spectrum of the dipole anisotropy. The integral of the dipole anisotropy9
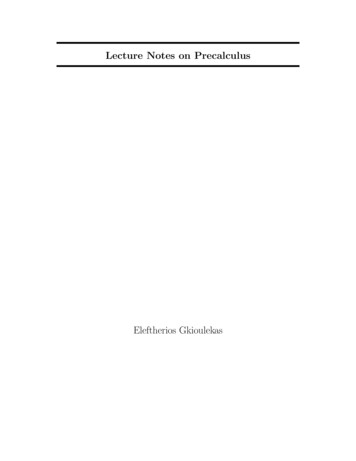
Fig. 5.— Left: true contrast CMB sky. 0 K white, 4 K black. Middle: contrast enhancedby 400X, monopole removed, showing dipole and Milky Way. Right: contrast enhanced by6,667X, with monopole, dipole and Milky Way removed.spectrum goes like (v/c)σSB T 4 so T can be found, giving T 2.726 0.001 K. The grandaverage is T 2.72548 0.00057 K.This blackbody radiation was predicted by Gamow and his students Alpher and Hermanfrom their theory for the formation of all the chemical elements during a dense hot phaseearly in the history of the Universe. Alpher & Herman (1948) predict a temperature of 5 K.But this theory of the formation of elements from 1 to 92 failed to make much of anythingheavier than helium because there are no stable nuclei with atomic weights of 5 or 8. Thusthe successive addition of protons or neutrons is stopped at the A 5 gap. Because of thisfailure, the prediction of a temperature of the Universe was not taken seriously until afterPenzias & Wilson had found the blackbody radiation. A group at Princeton led by Dicke wasgetting set to try to measure the radiation when they were scooped by Penzias & Wilson.When Dicke started this project he asked a student to find previous references and the onlyprior measurement of the temperature of the sky that had been published was T 20 Kby Dicke himself. And this paper was published in the same volume of the Physical Reviewthat had Gamow’s first work.The CMBR (Cosmic Microwave Background Radiation) is incredibly isotropic. Exceptfor a dipole term due to the Sun’s motion relative to the cosmos (like the (X, Y, Z) terms inHubble’s fit), the temperature is constant to 11 parts per million across the sky.1.5.CMB Temperature vs. RedshiftThe temperature of the CMB was first measured (but not recognized) using the levelpopulations in interstellar molecules. This approach can be applied to quasar absorptionline systems, allowing one to measure TCM B at different redshifts. Figure 6 shows results vs.redshift, clearly consistent with the prediction of the Big Bang, TCM B T (1 z).10
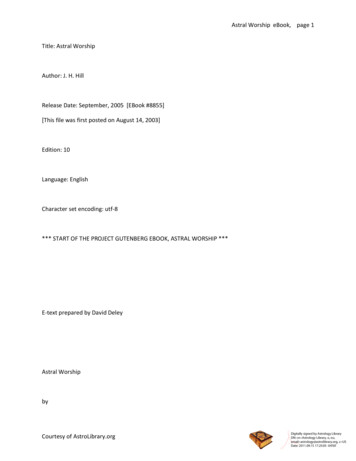
15TCMB105012Redshift, z3Fig. 6.— The CMB temperature measured using absorption line systems. The blue lineshows a constant T as predicted by the steady state model, while the red line show TCM B T (1 z) as predicted by the Big Bang.1.6.Time Dilation vs. RedshiftOne consequence of the standard interpretation of the redshift is that the durationsof lightcurves should be increased when looking at high redshift objects. This has beenconfirmed in the sample of 61 high redshift supernovae from Goldhaber and the SupernovaCosmology Project (2001, astro-ph/0104382) as shown in Figure 7. The width factor w isthe ratio of the duration of the observed decay to a nominal decay duration. The stretchfactor used to calibrate the Type Ia brightness is given by s w/(1 z). If the populationof fast vs. slow decayers does not change with redshift one expects w (1 z). An L1 norm(least sum of absolute values of errors) fit to the Goldhaber et al. data is shown and has thecoefficientsw 0.985(1 z)1.045 0.089 .(6)An L1 fit is robust against outliers in the data, and the uncertainty in the exponent wasevaluated using the half-sample bootstrap method. Clearly this fit is perfectly consistentwith the Big Bang prediction of w (1 z) and 11 standard deviations away from the tired11
2.5Width factor w2.01.510.70.00.10.20.30.4 0.5 0.6 0.7 0.8 0.9 1.0Redshift zFig. 7.— The time dilation (ratio of observed duration to nominal duration at z 0) vs.redshift for high redshift supernovae.light prediction of w (1 z)0 .12
2.Cosmological PrincipleBecause the CMBR is so isotropic, and since isotropic at more than two points implieshomogeneity, and taking the Copernican view that the Earth is not in a special place in thecosmos, we come to promulgate the cosmological principle:The Universe is Homogeneous and IsotropicSince galaxies are receding from each other, the average density of the Universe willbe decreasing with time, unless something like the Steady State model were correct [butit’s not]. This means that we have to be careful about how we define homogeneity. Wehave to specify a cosmic time and state that the Universe is homogeneous only on slicesthrough space-time with constant cosmic time. This sounds like it contradicts one of thetenets of special relativity, which states that different observers moving a different velocitieswill disagree about whether events are simultaneous. However, an observer traveling at 0.1 crelative to us would disagree even more about the Hubble law, since she would see blueshiftsof up to 30,000 km/sec on one side of the sky, and redshifts greater than 30,000 km/sec onthe other side of the sky. Thus we can define a special class of observers, known as comovingobservers, who all see the Hubble law for galaxy redshifts in its simple form. When we askeach comoving observer to determine the local density ρ at a time when the measured ageof the Universe is t, then homogeneity means that this ρ is a function only of t and does notdepend on the location of the observer.13
3.GeometryThe implications of the Cosmological Principle and the Hubble law are substantial. Letthe distance between two galaxies A and B at time t be DAB (t). This distance has tobe measured by comoving observers all at time t. Once distances are large enough so thelight travel time becomes important, this distance must be measured by several comovingobservers strung out along the way between A and B. For example, the path from A to Bmight be A 1 2 . . . B. An observer on galaxy A can measure the distance DA1 (t)by sending out a radar pulse at time tS t DA1 (t)/c, and receiving the echo at timetR t DA1 (t)/c. The distance is found using D c(tR tS )/2 as in all radars. Of coursesince the observer on A is trying to measure the distance, she would have to either guessthe correct time, or else send out pulses continually with each pulse coded so the echo canbe identified with the correct transmit time. In a time interval t to t t, each of thesesmall subintervals grows to (1 H t) times its initial value. Thus for any pair of galaxiesthe distance grows by a factor (1 H t) even if the distance DAB is quite large. Thus theequationdDAB HDAB(7)v dtwhich is the Hubble law is exactly true even when the distances are larger than c/H andthe implied velocities are larger than the speed of light. This is a consequence of the waydistances and times are defined in homogeneous cosmologies, which are consistent with thelocally inertial coordinates of a comoving observer only for small distances.A useful consequence of the Hubble law is that DAB (t), which depends on three variables,can be factored into a time variable part a(t) and a fixed part XAB which depends on thepair of objects but not on the time:DAB (t) a(t)XAB(8)where a(t) is the cosmic scale factor and applies to the whole Universe, while XAB is thecomoving distance between A and B. Obviously one can multiply all the X’s by 10 anddivide a(t) by 10 and get the same D’s, so a convention to fix the scale of the scale factor isneeded. We will usually use a(t ) 1 where t is the current age of the Universe. Of coursethat means that our calculations done today will be off by one part in 4 trillion tomorrow,but this error is so small we ignore it.The common growth factor (1 H t) discussed earlier can be written as a(t t)/a(t).Therefore the Hubble constant can be written asH 1 da.a dt(9)Unless a eHt , the Steady State model, the value of the Hubble constant will change withtime. Thus some people call it the Hubble parameter.14
3.1.Relation between z and a(t)If the Hubble velocities vAB dDAB /dt can be larger than c, we probably should notuse the special relativistic Doppler formula for redshift,s1 v/cλobs 1 z .(10)λem1 v/cWhat technique can we use instead? Let’s go back to our series of observers A 1 2 . . . n B. Galaxy B emits light at time tB tem and wavelength λem . This reachesobserver n at time tn tem DnB (tem )/c . . . This distance is small so we can use thefirst-order approximationvHDnB (tem )λn 1 1 1 H(tn tem )λBcc(11)But the rightmost side is just a(tn )/a(tem ). The same argument can be applied to show thatλn 1a(tn 1 ) λna(tn )(12)Finally we get to galaxy A at time tobs tA , and can write1 z a(tn )a(tA )a(tobs )a(tA ) a(t1 )··· a(t1 ) a(t2 )a(tB )a(tB )a(tem )(13)This formula only applies to the redshifts of comoving observers as seen by comoving observers. It is always possible to have a spaceship traveling at v/c 0.8 one light-day awayfrom the Solar System emit light yesterday which we see today with a redshift of 1 z 3even though a(tobs )/a(tem ) 1.Because of the relationship between redshift z and a(t) and hence t, we often speak ofthings happening at a given redshift instead of at a given time. This is convenient becausethe redshift is observable and usually has a great effect on the rates of physical processes.3.2.MetricsIn General Relativity it is important to realize that coordinates are just used as namesfor events. An event is the analog of a point in space-time. We can name an event S, orR, or Z, or we can give it a name using 4 real variables, typically x, y, z and t. But we canchange between different systems of coordinates, and GR gives us the rules for necessarytransformations. In particular, GR defines a metric that is used to determine measurabledistances and time intervals from coordinate differences. For example, in plane Euclideangeometry, the metric isds2 dx2 dy 2(14)15
P’P’POFig. 8.— Projection used to make a stereographic map from a sphere onto an infinite plane.We can write this asds2 gxx dx2 gxy dxdy gyx dydx gyy dy 2(15)with gxx gyy 1 and gxy gyx 0. This two index tensor gµν is called the metric. If youtransform to rotated and shifted coordinatesx′ a x cos θ y sin θy ′ b x sin θ y cos θ(16)then ds2 dx′2 dy ′2 which has the same form as Eqn (14). Thus translations and rotationsare isomorphisms of Euclidean geometry. But other coordinate transformations do changethe form of the metric. For example, in polar coordinatesds2 dr 2 r 2 dθ2(17)but this metric still describes Euclidean plane geometry. The metricds2 dθ2 sin2 θdφ2(18)is differs only slightly from Eqn (17) but it describes a spherical geometry which is nonEuclidean. The tools of tensor calculus show how to compute the curvature of manifoldsdescribed by a metric, and determine whether the manifold is really curved or not.The metrics needed in cosmology have to be homogeneous and isotropic. Homogeneitymeans that translations in all three spatial directions have to be isomorphisms. Isotropy16
means that rotations about all three axes have to be isomorphisms. These powerful restrictions mean that there are only three possible spatial manifolds that satisfy the cosmologicalprinciple. These can all be described by the metric 2 dr 222222(19) r dθ sin θdφds R 1 kr 2Here R is the radius of curvature of the space, which has to be the same everywhere byhomogeneity, and k 1, 0 or 1. For k 0 this metric describes Euclidean space, whilek 1 describes a 3-dimensional spherical space (the surface of a 4-dimensional ball –but the crutch of thinking about curved spaces embedded in a higher dimensional space isnot very useful.) For k 1 the space has negative curvature. Note that there are manydifferentsystems that can be used to describe the same geometry. By setting R coordinate2ψ dr/ 1 kr we get sin2 ψ ψ2ds2 R 2 dψ 2 dθ2 sin2 θdφ2 (20) 2sinh ψwhere the cases from top to bottom are for k 1, 0 and 1. Yet another form for thehomogeneous and isotropic spatial metrics can be found by analogy to the stereographic mapprojection. This is a projection from one end of a diameter of a sphere to a plane tangentto the other end of the diameter, as shown in Figure 8. If θ is the angle from the tangentpoint to a point on the sphere, then the angle at the projection point is θ/2 and the radiuson the projection plane is r 2 tan(θ/2). Thus dr sec2 (θ/2)dθ so the radial componentof the metric, ds2 dθ2 , can be writtends2 dr 2dr 2 sec4 (θ/2)(1 r 2 /4)2(21)The tangential component of the metric on the sphere, ds2 sin2 θdφ2 , can be written asds2 r 2 dφ2 cos4 (θ/2)4 tan2 (θ/2)dφ2 [2 cos(θ/2) sin(θ/2)]2 dφ24sec (θ/2)(22)Therefore the metric of a sphere can be writtends2 dx2 dy 2(1 (x2 y 2)/4)2(23)where x and y are the coordinates on a stereographic map. The 3-dimensional version ofthis isdx2 dy 2 dz 2ds2 R 2(24)(1 kr 2 /4)2where k 1, 0 or 1 as before. Note that because the angle at the projection plane is θ/2,the angle between the projected ray and the sphere normal is also θ/2, so t
Astronomy 275 Lecture Notes, Spring 2015 c Edward L. Wright, 2015 Cosmology has long been a fa