Transcription
THE JOURNAL OF FINANCE VOL. LXVI, NO. 1 FEBRUARY 2011Does Algorithmic Trading Improve Liquidity?TERRENCE HENDERSHOTT, CHARLES M. JONES, and ALBERT J. MENKVELD ABSTRACTAlgorithmic trading (AT) has increased sharply over the past decade. Does it improvemarket quality, and should it be encouraged? We provide the first analysis of thisquestion. The New York Stock Exchange automated quote dissemination in 2003, andwe use this change in market structure that increases AT as an exogenous instrumentto measure the causal effect of AT on liquidity. For large stocks in particular, ATnarrows spreads, reduces adverse selection, and reduces trade-related price discovery.The findings indicate that AT improves liquidity and enhances the informativenessof quotes.TECHNOLOGICAL CHANGE HAS REVOLUTIONIZED the way financial assets aretraded. Every step of the trading process, from order entry to trading venue toback office, is now highly automated, dramatically reducing the costs incurredby intermediaries. By reducing the frictions and costs of trading, technologyhas the potential to enable more efficient risk sharing, facilitate hedging, improve liquidity, and make prices more efficient. This could ultimately reducefirms’ cost of capital.Algorithmic trading (AT) is a dramatic example of this far-reaching technological change. Many market participants now employ AT, commonly definedas the use of computer algorithms to automatically make certain trading decisions, submit orders, and manage those orders after submission. From astarting point near zero in the mid-1990s, AT is thought to be responsible foras much as 73 percent of trading volume in the United States in 2009.1There are many different algorithms, used by many different types ofmarket participants. Some hedge funds and broker–dealers supply liquidity Hendershott is at Haas School of Business, University of California Berkeley. Jones is atColumbia Business School. Menkveld is at VU University Amsterdam. We thank Mark van Achter,Hank Bessembinder, Bruno Biais, Alex Boulatov, Thierry Foucault, Maureen O’Hara, SébastienPouget, Patrik Sandas, Kumar Venkataraman, the NASDAQ Economic Advisory Board, and seminar participants at the University of Amsterdam, Babson College, Bank of Canada, CFTC, HECParis, IDEI Toulouse, Southern Methodist University, University of Miami, the 2007 MTS Conference, NYSE, the 2008 NYU-Courant algorithmic trading conference, University of Utah, the2008 Western Finance Association meetings, and Yale University. We thank the NYSE for providing system order data. Hendershott gratefully acknowledges support from the National ScienceFoundation, the Net Institute, the Ewing Marion Kauffman Foundation, and the Lester Centerfor Entrepreneurship and Innovation at the Haas School at UC Berkeley. Menkveld gratefullyacknowledges the College van Bestuur of VU University Amsterdam for a VU talent grant.1 See “SEC runs eye over high-speed trading,” Financial Times, July 29, 2009. The 73% is anestimate for high-frequency trading, which, as discussed later, is a subset of AT.1
The Journal of Finance R2using algorithms, competing with designated market-makers and other liquidity suppliers (e.g., Jovanovic and Menkveld (2010)). For assets that trade onmultiple venues, liquidity demanders often use smart order routers to determine where to send an order (e.g., Foucault and Menkveld (2008)). Statisticalarbitrage funds use computers to quickly process large amounts of informationcontained in the order flow and price moves in various securities, trading athigh frequency based on patterns in the data. Last but not least, algorithmsare used by institutional investors to trade large quantities of stock graduallyover time.Before AT took hold, a pension fund manager who wanted to buy 30,000shares of IBM might hire a broker-dealer to search for a counterparty to executethe entire quantity at once in a block trade. Alternatively, that institutionalinvestor might have hired a New York Stock Exchange (NYSE) floor broker togo stand at the IBM post and quietly “work” the order, using his judgment anddiscretion to buy a little bit here and there over the course of the trading dayto keep from driving the IBM share price up too far. As trading became moreelectronic, it became easier and cheaper to replicate that floor trader with acomputer program doing AT (see Hendershott and Moulton (2009) for evidenceon the decline in NYSE floor broker activity).Now virtually every large broker-dealer offers a suite of algorithms to itsinstitutional customers to help them execute orders in a single stock, in pairsof stocks, or in baskets of stocks. Algorithms typically determine the timing,price, quantity, and routing of orders, dynamically monitoring market conditions across different securities and trading venues, reducing market impact byoptimally and sometimes randomly breaking large orders into smaller pieces,and closely tracking benchmarks such as the volume-weighted average price(VWAP) over the execution interval. As they pursue a desired position, thesealgorithms often use a mix of active and passive strategies, employing bothlimit orders and marketable orders. Thus, at times they function as liquiditydemanders, and at times they supply liquidity.Some observers use the term AT to refer only to the gradual accumulation ordisposition of shares by institutions (e.g., Domowitz and Yegerman (2005)). Inthis paper, we take a broader view of AT, including in our definition all participants who use algorithms to submit and cancel orders. We note that algorithmsare also used by quantitative fund managers and others to determine portfolioholdings and formulate trading strategies, but we focus on the execution aspectof algorithms because our data reflect counts of actual orders submitted andcancelled.The rise of AT has obvious direct impacts. For example, the intense activity generated by algorithms threatens to overwhelm exchanges and marketdata providers,2 forcing significant upgrades to their infrastructures. But researchers, regulators, and policymakers should be keenly interested in thebroader implications of this sea change in trading. Overall, does AT have2See “Dodgy tickers-stock exchanges,” Economist, March 10, 2007.
Does Algorithmic Trading Improve Liquidity?3salutary effects on market quality, and should it be encouraged? We providethe first empirical analysis of this question.As AT has grown rapidly since the mid-1990s, liquidity in world equity markets has also dramatically improved. Based on these two coincident trends, itis tempting to conclude that AT is at least partially responsible for the increasein liquidity. But it is not at all obvious a priori that AT and liquidity shouldbe positively related. If algorithms are cheaper and/or better at supplying liquidity, then AT may result in more competition in liquidity provision, therebylowering the cost of immediacy. However, the effects could go the other way ifalgorithms are used mainly to demand liquidity. Limit order submitters granta trading option to others, and if algorithms make liquidity demanders better able to identify and pick off an in-the-money trading option, then the costof providing the trading option increases, in which case spreads must widento compensate. In fact, AT could actually lead to an unproductive arms race,where liquidity suppliers and liquidity demanders both invest in better algorithms to try to take advantage of the other side, with measured liquidity theunintended victim.In this paper, we investigate the empirical relationship between AT and liquidity. We use a normalized measure of NYSE electronic message traffic as aproxy for AT. This message traffic includes electronic order submissions, cancellations, and trade reports. Because we normalize by trading volume, variationin our AT measure is driven mainly by variation in limit order submissionsand cancellations. This means that, for the most part, our measure is pickingup variation in algorithmic liquidity supply. This liquidity supply likely comesboth from proprietary traders that are making markets algorithmically andfrom buy-side institutions that are submitting limit orders as part of “slice anddice” algorithms.We first examine the growth of AT and the improvements in liquidity over a5-year period. As AT grows, liquidity improves. However, while AT and liquiditymove in the same direction, it is certainly possible that the relationship is notcausal. To establish causality we study an important exogenous event thatincreases the amount of AT in some stocks but not others. In particular, weuse the start of autoquoting on the NYSE as an instrument for AT. Previously,specialists were responsible for manually disseminating the inside quote. Thiswas replaced in early 2003 by a new automated quote whenever there was achange to the NYSE limit order book. This market structure provides quickerfeedback to algorithms and results in more electronic message traffic. Becausethe change was phased in for different stocks at different times, we can takeadvantage of this nonsynchronicity to cleanly identify causal effects.We find that AT does in fact improve liquidity for large-cap stocks. Quotedand effective spreads narrow under autoquote. The narrower spreads are aresult of a sharp decline in adverse selection, or equivalently a decrease in theamount of price discovery associated with trades. AT increases the amount ofprice discovery that occurs without trading, implying that quotes become moreinformative. There are no significant effects for smaller-cap stocks, but ourinstrument is weaker there, so the problem may be a lack of statistical power.
4The Journal of Finance RSurprisingly, we find that AT increases realized spreads and other measuresof liquidity supplier revenues. This is surprising because we initially expectedthat if AT improved liquidity, the mechanism would be competition betweenliquidity providers. However, the evidence clearly indicates that liquidity suppliers are capturing some of the surplus for themselves. The most naturalexplanation is that, at least during the introduction of autoquote, algorithmshad market power. Over a longer time period liquidity supplier revenues decline, suggesting that any market power was temporary, perhaps because newalgorithms require considerable investment and time to build.The paper proceeds as follows. Section I discusses related literature. Section II describes our measures of liquidity and AT and discusses the need foran instrumental variables approach. Section III provides a summary of theNYSE’s staggered introduction of autoquote in 2003. Section IV examines theimpact of AT on liquidity. Section V explores the sources of the liquidity improvement. Section VI studies AT’s relation to price discovery via trading andquote updating. Section VII discusses and interprets the results, and SectionVIII concludes.I. Related LiteratureOnly a few papers address AT directly. For example, Engle et al. (2007) useexecution data from Morgan Stanley algorithms to study the effects on tradingcosts of changing algorithm aggressiveness. Domowitz and Yegerman (2005)study execution costs for a set of buy-side institutions, comparing results fromdifferent algorithm providers. Chaboud et al. (2009) study AT in the foreignexchange market and focus on its relation to volatility, while Hendershottand Riordan (2009) measure the contributions of AT to price discovery on theDeutsche Boerse.Several strands of literature touch related topics. Most models take the traditional view that one set of traders provides liquidity via quotes or limit ordersand another set of traders initiates a trade to take that liquidity—for either informational or liquidity/hedging reasons. Many assume that liquidity suppliersare perfectly competitive, for example, Glosten (1994). Glosten (1989) modelsa monopolistic liquidity supplier, while Biais et al. (2000) model competingliquidity suppliers and find that their rents decline as the number increases.Our initial expectation is that AT facilitates the entry of additional liquiditysuppliers, increasing competition.The development and adoption of AT also involves strategic considerations.While algorithms have low marginal costs, there may be substantial development costs, and it may be costly to optimize the algorithms’ parameters foreach security. The need to recover these costs should lead to the adoption ofAT at times and in securities where the returns to adoption are highest (seeReinganum (1989) for a review of innovation and technology adoption).As we discuss briefly in the introduction, liquidity supply involves postingfirm commitments to trade. These standing orders provide free trading options to other traders. Using standard option pricing techniques, Copeland
Does Algorithmic Trading Improve Liquidity?5and Galai (1983) value the cost of the option granted by liquidity suppliers.Foucault et al. (2003) study the equilibrium level of effort that liquidity suppliers should expend in monitoring the market to reduce this option’s cost. Black(1995) proposes a new limit order type that is indexed to the overall marketto minimize picking-off risk. Algorithms can efficiently implement this kind ofmonitoring and adjustment of limit orders.3 If AT reduces the cost of the freetrading option implicit in limit orders, then measures of adverse selection depend on AT. If some users of AT are better at avoiding being picked off, they canimpose adverse selection costs on other liquidity suppliers as in Rock (1990)and even drive out other liquidity suppliers.AT may also be used by traders who are trying to passively accumulate orliquidate a large position.4 There are optimal dynamic execution strategies forsuch traders. For example, Bertsimas and Lo (1998) find that, in the presence oftemporary price impacts and a trade completion deadline, orders are optimallybroken into pieces so as to minimize cost.5 Many brokers incorporate suchconsiderations into the AT products that they sell to their clients. In addition,algorithms monitor the state of the limit order book to dynamically adjust theirtrading strategies, for example, when to take and offer liquidity (Foucault et al.(2010)).II. DataWe start by characterizing the time-series evolution of AT and liquidity for asample of NYSE stocks over the 5 years from February 2001 through December2005. We limit attention to the post-decimalization regime because the changeto a one-penny minimum tick was a structural break that substantially alteredthe entire trading landscape, including liquidity metrics and order submissionstrategies. We end in 2005 because substantial NYSE market structure changesoccur shortly thereafter.We start with a sample of all NYSE common stocks that can be matched inboth the Trades and Quotes (TAQ) and Center for Research in Security PricesCRSP databases. To maintain a balanced panel, we retain those stocks thatare present throughout the whole sample period. Stocks with an average share3 Rosu (2009) develops a model that implicitly recognizes these technological advances andsimply assumes that limit orders can be constantly adjusted. Consistent with AT, Hasbrouck andSaar (2009) find that by 2004 a large number of limit orders are cancelled within two seconds onthe INET trading platform.4 Keim and Madhavan (1995) and Chan and Lakonishok (1995) study institutional orders thatare broken up.5 Almgren and Chriss (2000) extend this optimization problem by considering the risk thatarises from breaking up orders and slowly executing them. Obizhaeva and Wang (2005) optimizeassuming that liquidity does not replenish immediately after it is taken but only gradually overtime. For each component of a larger transaction, a trader or algorithm must choose the type andaggressiveness of the order. Cohen et al. (1981) and Harris (1998) focus on the simplest staticchoice: market order versus limit order. However, a limit price must be chosen, and the problem isdynamic; Goettler et al. (2009) model both aspects.
The Journal of Finance R6price of less than 5 are removed from the sample, as are stocks with an average share price of more than 1,000. The resulting sample consists of monthlyobservations for 943 common stocks. The balanced panel eliminates compositional changes in the sample over time, which could induce some survivorshipeffects if disappearing stocks are less liquid. This could overstate time-seriesimprovements in liquidity, although the same liquidity patterns are presentwithout a survivorship requirement (see Comerton-Forde et al. (2010)).Stocks are sorted into quintiles based on market capitalization. Quintile 1refers to large-cap stocks and quintile 5 corresponds to small-cap stocks. Allvariables used in the analysis are 99.9 % winsorized: values smaller thanthe 0.05% quantile are set equal to that quantile, and values larger than the99.95% quantile are set equal to that quantile.A. Proxies for ATWe cannot directly observe whether a particular order is generated by acomputer algorithm. For cost and speed reasons, most algorithms do not rely onhuman intermediaries but instead generate orders that are sent electronicallyto a trading venue. Thus, we use the rate of electronic message traffic as a proxyfor the amount of AT taking place.6 This proxy is commonly used by marketparticipants, including consultants Aite Group and Tabb Group, as well asexchanges and other market venues.7For example, in discussing market venue capacity limits following an episodeof heavy trading volume in February 2007, a Securities Industry News reportquotes NASDAQ senior vice president of transaction services, Brian Hyndman,who noted that exchanges have dealt with massive increases in message trafficover the past 5 to 6 years, coinciding with algorithmic growth:“It used to be one-to-one,” Hyndman said. “Then you’d see a customersend ten orders that would result in only one execution. That’s becausethe black box would cancel a lot of the orders. We’ve seen that rise from20- to 30- to 50-to-one. The amount of orders in the marketplace increasedexponentially.”8In the case of the NYSE, electronic message traffic includes order submissions,cancellations, and trade reports that are handled by the NYSE’s SuperDOTsystem and captured in the NYSE’s System Order Data (SOD) database. Theelectronic message traffic measure for the NYSE excludes all specialist quoting,as well as all orders that are sent manually to the floor and are handled by afloor broker.6See Biais and Weill (2009) for theoretical evidence on how AT relates to message traffic.See, e.g., Jonathan Keehner, “Massive surge in quotes, electronic messages may paralyse USmarket,” urge-in-quotes-elect.html, June 14,2007.8 See Shane Kite, “Reacting to market break, NYSE and NASDAQ act on capacity,” SecuritiesIndustry News, March 12, 2007.7
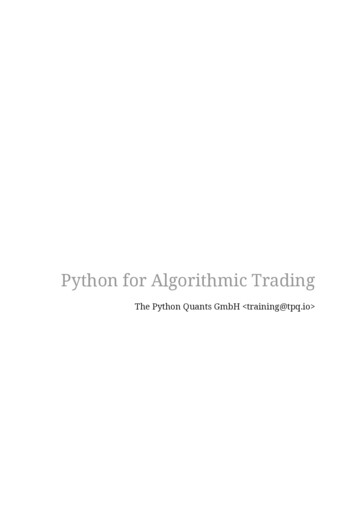
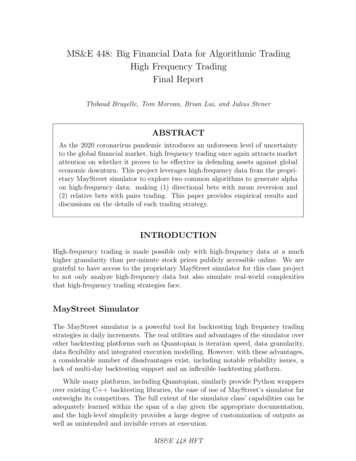
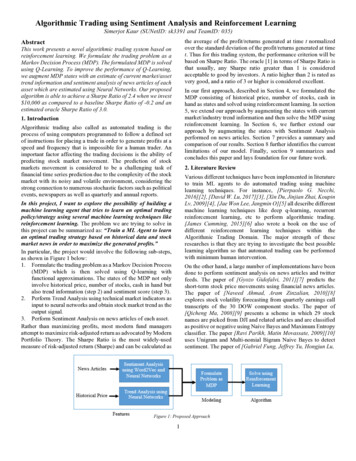
Does Algorithmic Trading Improve Liquidity?7As suggested by the quote above, an important issue is whether and howto normalize the message traffic numbers. The top half of Figure 1 shows theevolution of message traffic over time. We focus on the largest-cap quintileof stocks, as they constitute the vast bulk of stock market capitalization andtrading activity. Immediately after decimalization at the start of 2001, theaverage large-cap stock sees about 35 messages per minute during the tradingday. There are a few bumps along the way, but by the end of 2005 there are anaverage of about 250 messages per minute (more than 4 messages per second)for these same large-cap stocks. We could, of course, simply use the raw messagetraffic numbers, but there has been an increase in trading volume over the sameinterval, and without normalization a raw message traffic measure may justcapture the increase in trading rather than the change in the nature of trading.Therefore, for each stock each month we calculate our AT proxy, algo tradit , asthe number of electronic messages per 100 of trading volume.9 The normalizedmeasure still rises rapidly over the 5-year sample period, while measures ofmarket liquidity such as proportional spreads have declined sharply but appearto asymptote near the end of the sample period (see, e.g., the average quotedspreads in the top half of Figure 2 below), which occurs as more and morestocks are quoted with the minimum spread of 0.01.The time-series evolution of algo tradit is displayed in the bottom half ofFigure 1. For the largest-cap quintile, there is about 7,000 of trading volumeper electronic message at the beginning of the sample in 2001, decreasingdramatically to about 1,100 of trading volume per electronic message by theend of 2005. Over time, smaller-cap stocks display similar time-series patterns.It is worth noting that our AT proxies may also capture changes in tradingstrategies. For example, messages and algo tradit will increase if the same market participants use algorithms but modify their trading or execution strategiesso that those algorithms submit and cancel orders more often. Similarly, themeasure will increase if existing algorithms are modified to “slice and dice”large orders into smaller pieces. This is useful, as we want to capture increasesin the intensity of order submissions and cancellations by existing algorithmictraders, as well as the increase in the fraction of market participants employingalgorithms in trading.B. Liquidity MeasuresWe measure liquidity using quoted half-spreads, effective half-spreads, 5minute and 30-minute realized spreads, and 5-minute and 30-minute priceimpacts, all of which are measured as share-weighted averages and expressedin basis points as a proportion of the prevailing midpoint. The effective spreadis the difference between the midpoint of the bid and ask quotes and the actual9 Our results are virtually the same when we normalize by the number of trades or use rawmessage traffic numbers (see Table IA.4 in the Internet Appendix, available online in the “Supplements and Datasets” section at http://www.afajof.org/supplements.asp). The results are also thesame when we use the number of cancellations rather than the number of messages to constructthe AT measure.
8The Journal of Finance RFigure 1. Algorithmic trading measures. For each market-cap quintile, where Q1 is thelargest-cap quintile, these graphs depict (i) the number of (electronic) messages per minute and (ii)our proxy for algorithmic trading, which is defined as the negative of trading volume (in hundredsof dollars) divided by the number of messages.
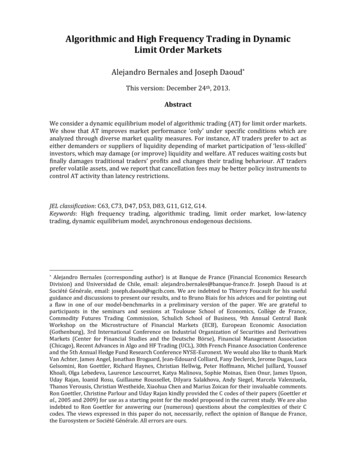
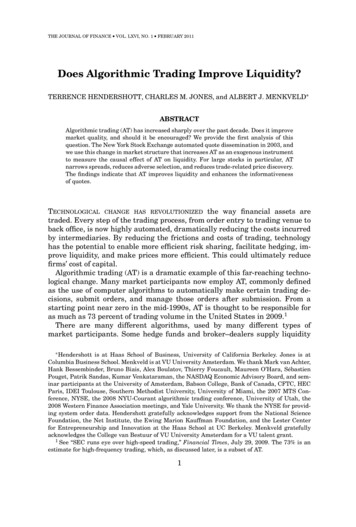
Does Algorithmic Trading Improve Liquidity?9Figure 2. Liquidity measures. These graphs depict (i) quoted half-spread, (ii) quoted depth,and (iii) effective spread. All spread measures are share volume-weighted averages within-firmthat are then averaged across firms within each market-cap quintile, where Q1 is the largest-capquintile.
10The Journal of Finance RFigure 2. Continuedtransaction price. The wider the effective spread, the less liquid is the stock. Forthe NYSE, effective spreads are more meaningful than quoted spreads becausespecialists and floor brokers are sometimes willing to trade at prices within thequoted bid and ask prices. For the tth trade in stock j, the proportional effectivehalf-spread, espreadjt , is defined asespreadjt q jt ( p jt mjt )/mjt ,(1)where q jt is an indicator variable that equals 1 for buyer-initiated tradesand 1 for seller-initiated trades, p jt is the trade price, and mjt is the quotemidpoint prevailing at the time of the trade. We follow the standard tradesigning approach of Lee and Ready (1991) and use contemporaneous quotesto sign trades and calculate effective spreads (see Bessembinder (2003), forexample). For each stock each day, we use all NYSE trades and quotes to calculate quoted and effective spreads for each reported transaction and calculate ashare-weighted average across all trades that day. For each month we calculatethe simple average across days. We also measure share-weighted quoted depthat the time of each transaction in thousands of dollars.Figure 2 shows quite clearly that our measures of liquidity are generallyimproving over the sample period. Figure 1 shows that AT increases almostmonotonically. The spread measures are not nearly as monotonic, with illiquidity spikes in both 2001 and 2002 that correspond to sharp stock marketdeclines and increased volatility over the same sample period (see Figure IA.5in the Internet Appendix). Nevertheless, one is tempted to conclude that these
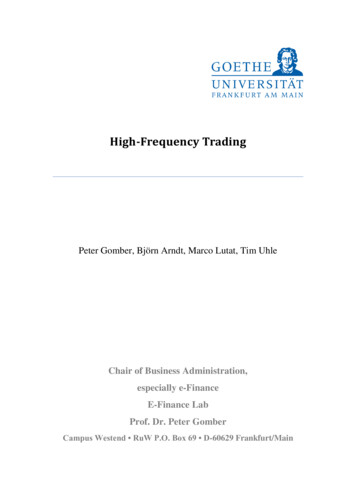
Does Algorithmic Trading Improve Liquidity?11two trends are related. The analysis below investigates exactly this relationship using formal econometric tools.If spreads narrow when AT increases, it is natural to decompose the spreadalong the lines of Glosten (1987) to determine whether the narrower spreadmeans less revenue for liquidity providers, smaller gross losses due to informedliquidity demanders, or both. We estimate revenue to liquidity providers usingthe 5-minute realized spread, which assumes the liquidity provider is ableto close her position at the quote midpoint 5 minutes after the trade. Theproportional realized spread for the tth transaction in stock j is defined asrspreadjt q jt ( p jt mj,t 5min )/mjt ,(2)where p jt is the trade price, q jt is the buy–sell indicator ( 1 for buys, 1 forsells), mjt is the midpoint prevailing at the time of the tth trade, and mj,t 5min isthe quote midpoint 5 minutes after the tth trade. The 30-minute realized spreadis calculated analogously using the quote midpoint 30 minutes after the trade.We measure gross losses to liquidity demanders due to adverse selectionusing the 5-minute price impact of a trade, adv selection jt , defined using thesame variables asadv selection jt q jt (mj,t 5min mjt )/mjt .(3)The 30-minute price impact is calculated analogously. Note that there is anarithmetic identity relating the realized spread, the adverse selection (priceimpact), and the effective spread espreadjtespreadjt rspreadjt adv selection jt .(4)Figure 3 graphs the decomposition of the two spread components. Both realized spreads, rspreadit , and price impacts, adv selectionit , decline from 2001to 2005. Most of the narrowed spread is due to a decline in adverse selectionlosses to liquidity demanders. Depending on the size quintile considered, 75%to 90% of the narrowed spread is due to a smaller price impact.So far, the graphical evidence shows time-series associations between ATand liquidity. The natural way to formally test this association is by regressingthe various liquidity measures (Lit ) on AT (Ait ) and variables controlling formarket conditions (Xit ):Lit αi β Ait δ Xit εit .(5)The problem is that AT is an endogenous choice made by traders. A trader’sdecision to adopt AT could depend on many factors, including liquidity. Forexample, the evidence in Goldstein and Kavajecz (2004) indicates that humansare used more often when markets are illiquid and volatile. Econometrically,this means that the slope coefficient β from estimating equation (5) via OLSis not an unbiased estimate of the causal effect of a change in AT on liquidity.Unless we have a structural model, the only way to identify the causal effect isto find an instrumental variable (IV) that affects AT but is uncorrelated with
12The Journal of Finance RFigure 3. Spread decomposition into liquidity supplier revenues and adverse selection.These graphs depict the two components of the effective spread: (i) realized spread and (ii) theadverse selection component, also known as the (permanent) price impact. Both are based on thequote midpoint 5 minutes after the trade. Results are graphed by market-cap quintile, where Q1is the largest-cap quintile.
Does Algorithmic Trading Improve Liquidity?13εit . Standard econometrics texts, for example, Greene (2007, Ch. 12), show thatunder these conditions, the resulting IV estimator consistently estimates thecausal effect, in this case the effect of an exogenous change in AT on liquidity.We discuss such an instrument in the next section.III. AutoquoteIn this section we provide an overview of our instrument, which is a changein NYSE market structure that causes an exogenous increase in AT.As a result of the reduction of the minimum tick to a penny in early 2001as part of decimalization, the depth at the inside quote shrank dramatically.In response, the NYSE proposed that a “liquidity quote” for each stock bedisplayed along with the best bid and offer. The NYSE liquidity quote wasdesigned to provide a firm bid and offer for substantial size, typically at least15,000 shares, accessible immediately.10At the time of the liquidity quote proposal, specialists were responsible formanually disseminating the inside quote.11 Clerks at the specialist posts onthe floor of the exchange were typing rapidly and continuously from open toclose and still were barely keeping up with order matching, trade reporting,and quote updating. In order to ease this capacity constraint and free up specialists and clerks to manage a liquidity quote, the exchange proposed that it“autoquote” the inside quote, disseminating a new quote automatically whenever there was a relevant change to the limit order book. This would happenwhen a better-priced order arrived, when an order at the inside was canceled,when the inside quote was traded with in whole or in part, or when the size ofthe inside quote changed.Note that the specialist’s structural advantages were otherwise unaffectedby autoquote. A specialist could still disseminate a manual quote at any timein order to reflect his own trading interest or that of floor traders. Specialistscontinued to execute most trades manually, and they could still participatein those trades subject to the unchanged NYSE rules. NYSE market shareremains unchanged at about 80% around the adoption of autoquote.Autoquote was an important innovation
The New York Stock Exchange automated quote dissemination in 2003, and . a trading option to others, and if algorithms make liquidity demanders bet-ter able to identify and pick off an in-the-money trading option, then the cost of providing the trading option