Transcription
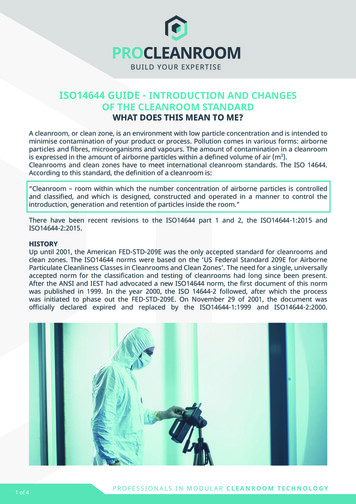
HIGH PERFORMANCECLEANROOMSA Design Guidelines SourcebookJanuary 2006
TABLE OF CONTENTSIntroduction.21. Air Change Rates .32. Demand Controlled Filtration .83. Dual Temperature Chilled Water Loops .124. Exhaust Optimization.165. Fan-Filter Units .206. Low Pressure Drop Air Systems .257. Minienvironments .308. Recirculation Air System Types .359. Vacuum Pump Optimization .4010. Waterside Free Cooling .431
INTRODUCTIONCleanroom design is a challenging field dominated by the need for high reliability,maintenance of strict space cleanliness requirements, life safety, and narrow temperatureand humidity control bands. By necessity, efficiency is a lower priority in design. But thereare a number of design approaches that have been shown to meet all the requirements of acleanroom facility robustly while minimizing power consumption and cost. The CleanroomDesign Guidelines describe a number of successful and efficient design practices specificallyappropriate for cleanroom facilities.Based on actual measurement of operating cleanroom facilities and input from cleanroomdesigners, owners and operators, the Cleanroom Design Guidelines offer many successfuldesign approaches that apply to most cleanroom facilities. No single recommendation can beappropriate for every cleanroom facility, but baseline measurement has clearly shown largeefficiency differences between design solutions that support identical cleanroom conditions.The Design Guidelines are not universal rules, but offer recommendations to the cleanroomdesigner who has little time or budget to evaluate the wide range of efficiency options suitablefor and proven in cleanroom facilities.While cleanroom design is a relatively mature industrial field, the low emphasis on energyefficiency and a conservative tendency on the part of designers to re-use proven designsregardless of their efficiency (often their efficiency was never measured) still results inneedlessly inefficient designs. The Cleanroom Design Guidelines help identify more efficientdesign approaches, allowing at least a high level consideration of efficiency to be included in,and impact, a design process typically compressed by budget and schedule constraints.2
1. AIR CHANGE RATESRecirculation air change rates (ACRs) are animportant factor in contamination control ina cleanroom and are the single largest factorin determining fan and motor sizing for arecirculation air handling system. Air handlersizing and air path design directly impacts thecapital costs and configuration of a building.FIGURE 1DUCTED HIGH EFFICIENCY PARTICULATEAIR (HEPA) FILTERS IN CLEANROOMINTERSTITIAL SPACEMany air change rate recommendations weredeveloped decades ago with little scientificresearch to back them up. The recommended design ranges for ISO Class 5 (Class 100)cleanroom ACRs are from 250 to 700 air changes per hour (see Figure 2). Higher ACRs equateto higher airflows and more energy use, and don’t always achieve the desired cleanliness. Bothnew and existing systems can benefit from optimized air change rates. Frequently this equatesto lower air change rates.Benchmarking has shown that most facilities are operated at or below the low range ofrecommended ACRs. A Sematech study has also verified that lowered air change rates incleanrooms are adequate in maintaining cleanliness. The actual operating ACRs documentedfor ten ISO Class 5 cleanrooms was between 94 and 276 air changes per hour.PRINCIPLES Lower air change rates result in smaller fans, which reduce both the initial investment andconstruction cost. Fan power is proportional to the cube of air change rates or airflow. A reduction in the airchange rate by 30% results in a power reduction of approximately 66%. Lower airflow may improve the actual cleanliness by minimizing turbulence.APPROACHDesigners and cleanroom operators have a variety of sources to choose from when lookingfor ACR recommendations. Recommendations are not based on scientific findings andconsequently there is no clear consensus on an optimum ACR. For this reason, many ofthe established guidelines are outdated.There are several conflicting sets of recommendations on cleanroom airflow. Articles inCleanrooms magazine1 have explored the different ways of measuring or describing airflowand have discussed the Institute of Environmental Sciences and Technology (IEST; RollingMeadows, Ill.) recommendations; however, few industry observers have examined actualpractices and the relationship on construction and energy costs.3
There is no agreement on a recommended ACR rate. Most sources suggest a range of rates,while these ranges tend to be wide and do not provide clear guidance to designers who need toselect a set ACR value to specify equipment sizes. Figure 1 shows the result of a comparativereview of recommended ACRs.FIGURE 2RECOMMENDED AIR CHANGE RATES FORISO CLASS 5 (CLASS 100)CLEANROOMS2Using better air change rate practices will allow designers to lower construction costs as wellas reduced energy costs while maintaining the high level of air cleanliness that is requiredin cleanroom facilities.Cleanrooms Magazine3 pointed out that many of the recommended ACRs are based onrelatively low-efficiency filters that were prevalent in the mid 1990’s. For example, today’swidely-used 99.99 percent efficient filters are three times more effective at filtering out 0.3micron particles than the 99.97 percent filters that were common in the mid 1990’s.Ultra-low penetration air (ULPA) filters are even more efficient than those of the mid 1990’s.The high end of that range is almost three times the rate at the low end, yet the impact of thisdifference on fan sizing and motor horsepower is radically greater. According to the fan affinitylaws, the power difference is close to the cube of the flow or air change rate difference. Forexample, a 50 percent reduction in flow will result in a reduction of power by approximately afactor of eight or 87.5 percent. Due to filter dynamics, the cube law does not apply exactly and,typically, the reduction is between a cube and a square relationship.4Even relatively modest reductions of 10 percent to 20 percent in ACR provide significantbenefits. A 20 percent decrease in ACR will enable close to a 50 percent reduction in fan size.The energy savings opportunities are comparable to the potential fan size reductions.
ACR reductions may also be possible when cleanrooms are unoccupied for a length of time.In most cleanrooms, human occupants are the primary source of contamination. Once acleanroom is vacated, lower air changes per hour to maintain cleanliness are possibleallowing for setback of the air handling systems. Setback of the air handling system fanscan be achieved by manual setback, timed setback, use of occupancy sensors, or bymonitoring particle counts and controlling airflow based upon actual cleanliness levels.It is a common misconception that making a cleanroom more efficient will drive upconstruction costs. However, well-planned ACR reductions can reduce both constructionand energy costs. This is a true win-win situation, which decreases the amount of work themechanical system has to perform and offers high leverage for downsizing equipment.Biotechnology and pharmaceutical cleanrooms are designed to meet current GoodManufacturing Practices (cGMPs). Traditionally, high air change rates were followed withoutchallenge because they had been previously accepted by regulators. As new informationbecomes available (such as case studies showing acceptable performance at lower airflows)the current Good Manufacturing Practice should be able to reflect use of lower airflow.Best practice for ACRs is to design new facilities at the lower end of the recommended ACRrange. Once the facility is built, monitoring and controlling based upon particle countscan be used to further reduce ACRs. Variable speed drives (VSDs) should be used on allrecirculation air systems allowing for air flow adjustments to optimize airflow or account forfilter loading. Existing systems should be adjusted to run at the lower end of the recommendACR range through careful monitoring of impact on the cleanroom process(es). Where VSDsare not already present, they can be added and provide excellent payback if coupled withmodest turndowns.BENCHMARKING FINDINGS/CASE STUDIESThe data from the cleanroom energy benchmarking study4 conducted by Lawrence BerkeleyNational Laboratory suggests that air change rates can be lower than what is currentlyrecommended by several sources (see Figure 3). The benchmarking data suggests that anISO Class 5 facility could be operated with an air change rate of around 200 air changesper hour and still provide the cleanliness classification required. It can be concluded thatrarely is more than 300 ACR required.While the recommended design ranges for ACRs are from 250 to 700 air changes per hour,the actual operating ACRs ranged from 90 to 625 2. All of these cleanrooms were certifiedand performing at ISO Class 5 conditions. This shows that cleanroom operators can use ACRsthat are far lower than what is recommended without compromising either production orcleanliness requirements.This is often done to lower energy costs. However, these facilities did not take advantage of thefan sizing reduction opportunities during construction. As a result, most of the fan systemswere operating at very low variable speed drive speeds.5
FIGURE 3MEASURED AIR CHANGERATES FOR ISO CLASS 5(CLASS 100) CLEANROOMSFortunately, a growing body of data, case studies and research are available that documentsuccess. In a study by International Sematech (Austin, Texas)5, no noticeable increase ofparticle concentrations was found when air change rates were lowered by 20 percent in ISOClass 4 cleanrooms. Also, a study at the Massachusetts Institute of Technology (MIT;Cambridge, Mass.)6 found that in a raised-floor-type cleanroom “with a small decrease in airvelocity, such facilities will decrease particle deposition and maintain air uni-directionality.”Other success has been noted by cleanroom operators at Sandia National Laboratories(Albuquerque, N.M.). Sandia National Laboratories has successfully reduced air change ratesin their state-of-the-art ISO Class 4 and 5 cleanrooms. This is especially significant sinceSandia pioneered laminar flow cleanrooms in the early 1960s.RELATED CHAPTERS Low Pressure Drop Air Systems Demand Controlled Filtration Fan-filter Units Recirculation Air Handling Systems MinienvironmentsREFERENCES1) Fitzpatrick, Mike and Goldstein, Ken, Cleanroom Airflow Measurement: Velocity, AirChanges Per Hour Or Percent Filter Coverage? Cleanrooms Magazine, May 2002; andFitzpatrick and Goldstein, Cleanroom Airflows Part II: The Messy Details, CleanroomsMagazine, July 2002.6
2) Sources:1. IEST Considerations in Cleanroom Design (IEST RP-CC012.1)2. Raymond Schneider, Practical Cleanroom Design3. Cleanrooms equipment supplier4. Faulkner, Fisk and Walton, “Energy Management in SemiconductorCleanrooms”5. California-based designer and cleanrooms instructor6. Federal Standard 209B (superceded by ISO/DIS 14644)7. National Environment Balancing Bureau, Procedural Standards for CertifiedTesting of Cleanrooms, 19963) Jaisinghani, Raj, “New Ways of Thinking About Air Handling,” CleanroomsMagazine, January 2001.4) htm.5) Huang, Tom, Tool and Fab Energy Reduction, Spring 2000 NorthwestMicroelectronics Workshop, Northwest Energy Efficiency Alliance.6) Vazquez, Maribel and Glicksman, Leon, On the Study of Altering Air Velocities inOperational Cleanrooms, 1999 International Conference on Advanced Technologiesand Practices for Contamination Control.RESOURCES IEST-RP-CC012.1, Considerations in Cleanroom Design, The Institute ofEnvironmental Sciences and Technology (IEST), 1993. Rumsey Peter, An Examination of ACRs: An Opportunity to Reduce Energy andConstruction Costs, Cleanrooms Magazine, January 2003. Xu, Tim, Considerations for Efficient Airflow Design in Cleanrooms, Journal of theIEST, Volume 47, 2004. Xu, Tim, “Performance Evaluation of Cleanroom Environmental Systems,”Journal of the IEST, Volume 46, August 2003. Schneider, R., “Designing Cleanroom HVAC Systems,” ASHRAE Journal V.43, No. 8,pp. 39-46, August 2001. ISO/DIS 14644-1, “Cleanrooms and associated controlled environments. Part 1:Classification of air cleanliness,” International Organization for Standardization,1999. ISO/DIS 14644-2, “Cleanrooms and associated controlled environments. Part 2:Testing and monitoring to prove continued compliance to ISO/DIS 14644-1,”International Organization for Standardization, 2000. National Environment Balancing Bureau, “Procedural Standards for CertifiedTesting of Cleanrooms,” 1996.7
2. DEMAND CONTROLLED FILTRATIONRecirculation air flow in cleanrooms has traditionally been determined through variousmethods. There are several published recommended ranges of airflow which present differingrecommendations including ASHRAE Applications Handbook chapter 16 (table 2), IESTRecommended Practice 012.1, and ISO 14644-4 Annex B, however, these and other sourcesprovide conflicting recommended ranges of air change rates and the range of values is verybroad. Air change rates have been determined based upon historical rules of thumb, thatwhich was previously successful for similar contamination control situations, or pureguesswork.Contamination control is the primary consideration in cleanroom design, however therelationship between contamination control and airflow is not well understood. Contaminantssuch as particles or microbes are primarily introduced to cleanrooms by people althoughprocesses in cleanrooms may also introduce contamination. During periods of inactivity orwhen people are not present, it is possible to reduce airflow and maintain cleanlinessconditions. Reducing airflow by use of variable speed fans which are normally a feature ofrecirculation systems is an energy efficiency measure that can save a lot of energy. Even smallreductions in airflow can save significant amounts of energy due to the approximately cuberelationship between airflow and fan energy. In some situations airflow reduction may belimited by the cooling that the airflow provides to a process, however in many cases airflowscan readily be reduced.There are several methods of controlling airflow in order to achieve “demand controlledfiltration”. These range from simple use of timers to sophisticated particle monitoring andcontrol. As shown below airflow reduction did not necessarily increase particle counts duringan LBNL pilot study.FIGURE 1PILOT STUDY AIRFLOW REDUCTIONAND PARTICLE COUNTS81
PRINCIPLES Reduce recirculated airflow in cleanroom when it is unlikely that particles will be generated Optimize airflow for best contamination control by real time particle monitoring andautomatic control of the recirculation systemAPPROACHRecirculation air flow can be determined based upon whatever criteria the cleanroom ownerand designer are comfortable with. This may involve selecting design values from publishedrecommended values such as IEST Recommended Practice 012.1, or ISO- 14644-4 priorcorporate recommendations, or other design guidance. Generally, airflow values from the lowend of the recommended ranges will yield acceptable contamination control. Using this designairflow, the recirculation system can be designed including sizing of fans, motors, ductwork,and return air paths. In addition, variable speed fans and a control mechanism must beprovided. This design condition will consider the maximum airflow as a worst caserequirement for the cleanroom and will allow the airflow to be reduced when appropriate.Recirculation airflow can be controlled in various ways: Use of timers or scheduling software to lower airflow at certain times when the cleanroom isunoccupied and with minimal process activity. This generally would be a step changereduction in airflow when the room is expected to be unoccupied and increased back tohigher airflow before room is reoccupied. Use of occupancy sensors to lower airflow whenever people are not present in the cleanroom.Placement and time delay of sensors needs to be such as to sense when people have exited orare about to enter the space. Use of particle counters to control airflow in the room based upon real-time cleanlinessmonitoring. In this scheme, particle counters will be deployed to monitor the various sizesof particles of concern for a given cleanroom’s contamination control problem. The numberand placement of counters will need to be determined through interaction with processengineers and may involve some experimentation. An output signal from the particlecounters can directly control recirculation fan speed.System pressurization is an important factor in implementing an airflow reduction strategy.It’s important to note that the makeup air system and exhaust systems will continue to operateat their normal levels. This is usually necessary for safety considerations although there maybe certain types of cleanrooms where these systems airflow could be reduced as well. A reviewof system effects should be performed to ensure that desired pressurization levels can beachieved with any reduction of cleanroom airflow.Consideration of process equipment heat loads may limit the amount of airflow reduction.Airflow could be separately controlled to provide adequate airflow for heat removal, or simplyset to always provide adequate airflow.9
BENCHMARKING FINDINGS/CASE STUDIESFIGURE 2MEASURED RECIRCULATIONAIR HANDLER POWER REDUCTION2The figure above shows the reduction in fan power for a cleanroom where a timer was used toset back airflow when the cleanroom was unoccupied at night and on weekends. The airchange rate was reduced from 594 ACH to 371 ACH to achieve this reduction. Another casestudy showed similar reduction in fan power as shown in Figure 3 below.FIGURE 3FAN-FILTERED RECIRCULATION FANPOWER REDUCTION IN FACILITY K310
RELATED CHAPTERS Recirculation Air System Types Fan-filter Units Air Change RatesREFERENCES1) LBNL/Rumsey Engineers Cleanroom Benchmarking Study2) ibid3) ibidRESOURCES Tschudi, William; Faulkner, David; Hebert, Allan; “Energy Efficiency Strategies forCleanrooms Without Compromising Environmental Conditions” ASHRAE Symposium,June 2005. Xu, Tim, “Performance Evaluation of Cleanroom Environmental Systems,” Journal of theIEST, Volume 46, August 2003. Jaisinghani, Raj, “New ways of thinking about air handling,” Cleanrooms magazine,January 2001. Faulkner, D., Fisk, W. J., and Walton, T. Energy Savings in Cleanrooms FromDemand-controlled Filtration. LBNL-38869.11
3. DUAL TEMPERATURE CHILLED WATER LOOPSChiller energy can account for10 to 20% of total cleanroomenergy use. The majority of annualchilled water use goes to mediumtemperature chilled waterrequirements – 55 F for sensiblecooling and 60 to 70 F for processcooling loads. When outside airtemperatures are cool andhumidity is low (i.e., nolow-temperature water is neededfor dehumidification), 100% ofthe chilled water is for mediumtemperature loop uses.FIGURE 1TYPICAL CENTRIFUGAL CHILLER UNITStandard cleanroom chiller plant design provides chilled water at temperatures of 39 to 42 F.While this temperature is needed for dehumidification, the low setpoint imposes an efficiencypenalty on the chillers. Typically, heat exchangers and/or mixing loops are used to convert thelow temperature, energy intensive chilled water into warmer chilled water temperatures forsensible or process cooling loads.FIGURE 2CHILLER EFFICIENCYChiller efficiency is a function of the chilled water supply temperature. All other things equal,higher chilled water temperatures result in improved chiller efficiency. For example, bydedicating a chiller in a dual chiller plant to provide chilled water at 55 F, 20 to 40% ofchiller energy and peak power can be saved when compared to both chillers operating at 42 F.PRINCIPLES12 Chiller work is proportional to the vapor pressure work of the compressor – this work islowered if chilled water temperatures are raised and/or condenser water temperatures arelowered. Because of less compressor work, medium temperature chillers have smaller compressorsand are thus lower in cost on a dollars per ton and electrical infrastructure basis as compared to chillers delivering standard lower chilled water temperatures. The majority of cleanroom chilled water requirements are best served by medium temperature, 55 to 70 F chilled water.
APPROACHCleanroom facilities usually have a number of medium temperature loops required by theindustrial processes. Recirculation cooling may be supplied by coils that use mixing stationsto supply a non-condensing 55 F water temperature and a process cooling water loop wouldutilize a heat-exchanger to create water between 60 and 70 F. Energy savings are realized notby creating medium temperature demands, but by designing a system that creates mediumtemperature water directly without wasting energy intensive low temperature water.Cleanroom facilities typically need low temperature water only to handle peak outside airloads. Peak loads by definition occur 2 to 5% of the time in a year. For example, an outdoorair drybulb (DB) temperature of 95 F is used for design conditions, but 24-hour operatingconditions may be at an average outside air temperature of 70 F DB. Typically, make up airconditioning accounts for 25–30% of the chilled water load, while recirculation air andprocess cooling loads account for 60–70%. See Figure 3.FIGURE 3COMPARISON OF DESIGN VERSUSACTUAL OPERATING CHILLED WATERLOADS FOR A 13,000 SFCLEANROOM FACILITYChiller efficiency is directly impacted by the chilled water supply temperature – chillersoperate most efficiently when the temperature lift (the difference in temperature between theevaporator and the condenser) is minimized. The magnitude of the lift is proportional to thedifference between the chilled water supply temperature and condenser water supplytemperature. The lift is reduced if either the condenser water supply temperature is reducedor if the chilled water supply temperature is increased. Therefore, if the medium temperaturewater loads can be served by a chiller operating at the required medium supply temperature,the chiller energy required will be reduced significantly over a low temperature chiller withmixing loop or heat-exchanger.13
Figure 4 compares the chiller operating curves of the same chiller at two different chilledwater supply temperatures with a constant condenser water supply temperature. The entireoperating range of the chiller with 60 F chilled water temperature is vastly more efficient thanthe chiller operating at 42 F as shown in Figure 4. The energy savings of the chiller operatingat 60 F are 40% over the entire load range. In a well-configured and controlled system, therewill also be condenser pump and tower savings (both first-cost and operating cost), since themore-efficient chiller has less total heat to reject.FIGURE 4COMPARISON OF LOW TEMPERATUREAND MEDIUM TEMPERATUREWATER-COOLED CHILLERSA common first-cost challenge is economically providing redundancy. While the savingspossible from implementing a medium temperature chiller loop can usually justify additionalbackup equipment, careful plant layout and design can allow the same chiller to providebackup to the low temperature and the medium temperature loop – providing redundancy atabout the same cost as a standard single temperature plant. The redundant chiller should besized and piped to provide either low temperature or medium temperature water (see Figure 5)as required. Selecting the backup chiller without a variable frequency drive (VFD) can help tolower the initial cost. However, the decision to select a variable frequency driven chiller as thebackup should be based on the anticipated runtime of the chiller, and whether or not thechiller needs to be rotated into the normal operating schedule.14A medium temperature loop also greatly expands the potential for free cooling, which is whenthe cooling tower is utilized to produce chilled water. Cooling towers sized for an approachtemperature of 5 to 8 F can be utilized to produce chilled water at 55 F for much of the year,particularly at night in moderate and dry climate zones such as in California and Arizona.There is better system redundancy in a dual temperature chilled water loop system ascompared to a low temperature chilled water loop system that provides cooling for sensibleand process loads. Failures can be caused by controls of the temperature loops, automatedvalves and fouling of the heat exchangers, which exist in greater abundance in a lowtemperature chilled water loop system.
FIGURE 5CONFIGURATION OF CHILLERSFOR A DUAL TEMPERATURECHILLED WATER LOOP SYSTEMBENCHMARKING FINDINGS/CASE STUDIESA dual temperature chilled water loop system was measured at a 4,200 sf cleanroom facility(referred to as Facility G) in a recent benchmarking study. The medium temperature loop wasproviding 1,300 tons of cooling to sensible cooling air handler coils and process cooling at awater supply temperature of 48 F. The low temperature loop was providing 1,200 tons ofcooling to the makeup air handlers at a water supply temperature of 42 F.The medium temperature water-cooled chillers and the low temperature water-cooled chillershad an operating efficiency of 0.57 kW/ton and 0.66 kW/ton, respectively. The mediumtemperature chillers were running at about 14% better in efficiency due to a chilled watertemperature difference of only 6 F.In a pilot project for a multiple cleanroom building campus, implementation of a dualtemperature chilled water system was analyzed. The cleanroom facility required 3,900 tons ofcooling: 2,370 tons of makeup air cooling, and 1,530 tons of sensible and process cooling. Byproviding 42 F temperature water for low temperature use and 55 F for medium temperatureuse, approximately 1,000,000 would be saved per year (electricity rate of 0.13/kWh).The cost of implementing this was 2,000,000 with a payback of only 2 years.RELATED CHAPTERS Waterside Free CoolingREFERENCES1) LBNL/Rumsey Engineers Cleanroom Benchmarking Study2) The chiller efficiency reported is based on manufacturer’s simulated data of the samechiller. The water-cooled chiller was simulated running at 100% full load and had acondenser water supply temperature 70 F in both cases.RESOURCES http://hightech.lbl.gov/cleanrooms.html15
4. EXHAUST OPTIMIZATIONExhaust airflow rates are typicallydictated by process equipment exhaustspecifications. Equipment manufacturers’suggested exhaust quantities have beenfound to be overstated. For example, arecent study by International Sematechfound that exhaust airflows could bereduced in four devices typically found insemiconductor cleanrooms: wet benches,gas cabinets, ion implanters and verticalfurnaces. The results of the study reportedthat a reduction of total exhaust airflowby 28% exists among the four devicestested. The same study, which measuredfume capture and containmenteffectiveness, found one piece ofequipment where an increasedexhaust rate was required to maintainsafe containment.FIGURE 1CHEMICAL EXHAUST STACKPRINCIPLES All air exhausted from a cleanroom has to be replaced by conditioned and filtered makeup air. For a cleanroom facility operating 24 hours a day, costs for exhaust air range from 3 to 5 per cubic feet per minute (cfm) annually. Building and fire codes require minimum amounts of exhaust for some types of cleanrooms.For example, the Uniform Building Code’s H6 classification, which covers many commonsemiconductor cleanroom spaces, requires a minimum of 1 cfm per square foot (sf) ofoutside air.APPROACH16Exhaust systems are provided for a variety of reasons. In most industrial cleanrooms, exhaustdesign is driven by the need to protect occupants from hazardous fumes generated by or inprocess equipment, or to remove heat generated by equipment located in the workspace.The first type of exhaust system usually involves the use of fume hoods, wet benches, orequipment-integrated process equipment fume capture systems. The fundamental approach toexhaust optimization must be to verify and improve the safety of workers in the cleanroom.
Often, manufacturer recommendations for exhaust airflow rates are significantly overstatedand/or based on a crude face velocity approach to estimating exhaust rates required forcontainment. Good practice suggests using direct measurements of the containment to setthe exhaust rate. Methods such as tracer gas testing verify and document a safe operatingcondition, resulting in safer use. Studies indicate that proper optimization typically lowersoverall facility exhaust flow rates, resulting in energy savings in addition to the safety benefits.Conditioning makeup air for a cleanroom is expensive. Makeup air goes through severalprocesses before it can be delivered to a cleanroom. Dependent on the space setpoints and theoutside climate, the air has to be filtered, heated, cooled, pressurized by a fan, dehumidifiedand/or humidified. Each CFM of makeup air also results in a CFM of exhaust, which mayrequire treatment before being released. The
The Design Guidelines are not universal rules, but offer recommendations to the cleanroom designer who has little time or budget to evaluate the wide range of efficiency options suitable for and proven in cleanroom facilities. While cleanroom design is a relativel