Transcription
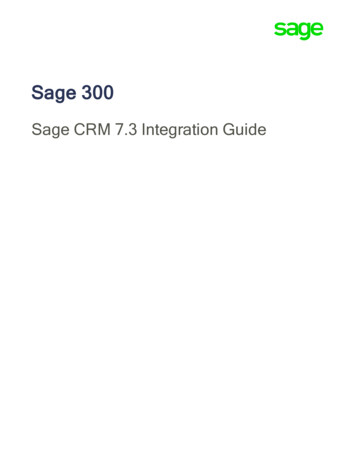
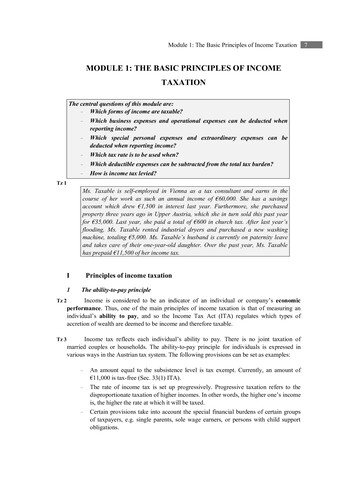
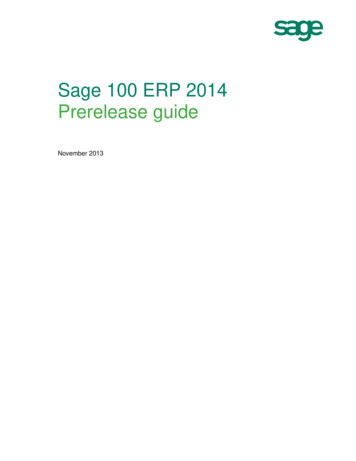
RSFRussell Sage Foundation - Chartbook of Social Inequality 100,000Real Mean and Median Income, Families and Individuals, 1947-2012, andHouseholds, 1967-2012 (Reported in 2012).Median Family IncomeMean Family IncomeMedian Household Income 80,000 82,843Mean Household IncomeMedian Individual Income 71,274Mean Individual Income 62,241Income 60,000 51,017 40,563 40,000 31,886 27,255 20,000 26,989 19,549 16,069 0002005YearData Source: U.S. Census Bureau. Historical Income Tables F-5, H-5, and P-4 @ cal/index.html.201020152020
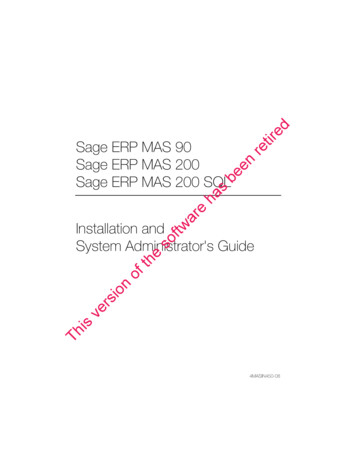
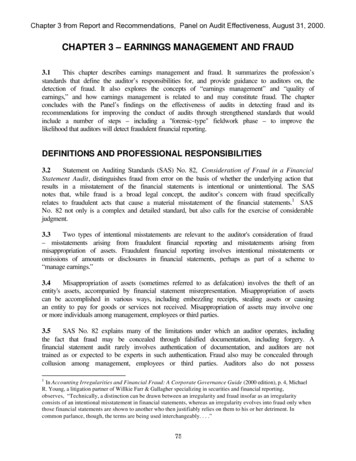
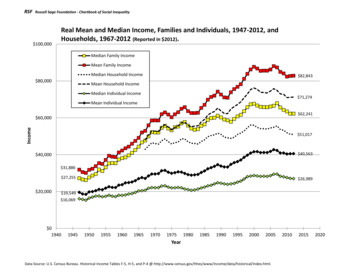
RSFRussell Sage Foundation - Chartbook of Social InequalityReal Household Income at Selected Percentiles, 1967-2012 (Reported in 2012 ). 250,00010th Percentile20th Percentile50th (Median) 200,00080th Percentile 191,15690th Percentile95th PercentileIncome 150,000 146,000 114,203 100,000 104,096 90,401 71,167 51,017 50,000 42,934 19,220 20,599 12,236 9,797 020YearData Source: DeNavas-Walt, C., B. D. Proctor, and J. C. Smith. Sept. 2013. U.S. Census Bureau, Current Population Reports, P60-245, Income, Poverty, and Health Insurance Coverage in theUnited States: 2012 [Table A-2].
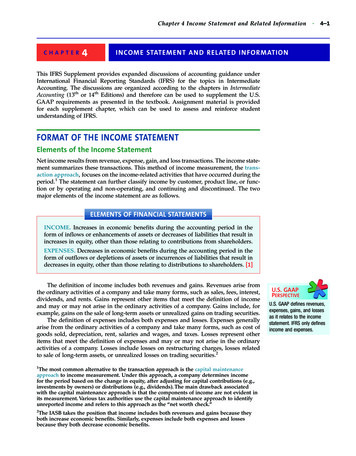
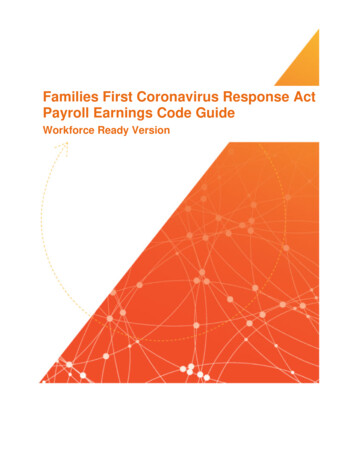
RSFRussell Sage Foundation - Chartbook of Social InequalityMean Household Income of Quintiles, 1967-2012 (Reported in 2012 ). 350,000Bottom 20% 318,052Second 20% 300,000Middle 20%Fourth 20%Top 20% 250,000Household IncomeTop 5% 200,000 181,905 168,959 150,000 107,112 100,000 82,098 59,519 50,000 01960 51,179 42,540 26,643 29,696 9,615 2020YearData Source: DeNavas-Walt, C., B. Proctor, and J. C. Smith. Sept. 2013. U.S. Census Bureau, Current Population Reports, P60-245, Income, Poverty, and Health Insurance Coverage in theUnited States: 2012 [Table A-2].
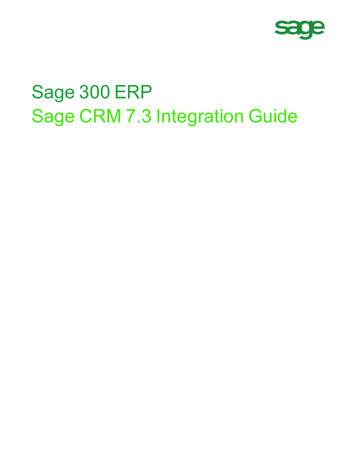
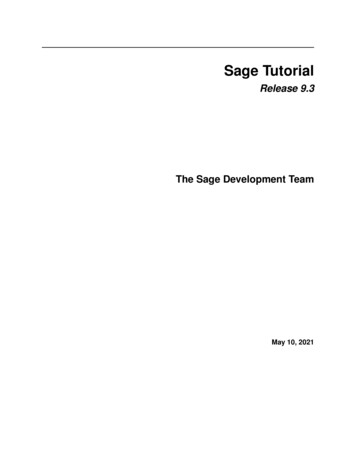
RSFRussell Sage Foundation - Chartbook of Social InequalityAverage After-Tax Household Income of Quintiles, 1979-2010 (Reported in 2010). 250,000Lowest QuintileSecond QuintileMiddle Quintile 200,000Fourth Quintile 181,600Average After-tax IncomeHighest Quintile 150,000 100,000 98,100 80,100 55,700 57,000 50,000 42,600 39,100 29,900 19,200 14,800 0197519801985199019952000200520102015YearData Source: Congressional Budget Office. 2013. The Distribution of Household Income and Federal Taxes, 2010. [http://www.cbo.gov/publications/44604; Table 13].2020
RSFRussell Sage Foundation - Chartbook of Social InequalityPercentage Change in Average After-Tax Household Income between 1979 and2010 by Quintiles and Top Percentiles (Reported in 2010 ).202%% Change in Average After-tax intileHighestQuintileAll Quintiles81st - 90th 91st - 95th 96th - 99thPercentiles Percentiles PercentilesQuintiles and PercentilesData Source: Congressional Budget Office. 2013. The Distribution of Household Income and Federal Taxes, 2010 . [http://www.cbo.gov/publications/44604; Table 13].Top 1Percent
RSFRussell Sage Foundation - Chartbook of Social Inequality 250,000Trends in Family Income - Upper Limit of Bottom Four Income Quintiles andLower Limit of Top 5 Percent, 1947 - 2012 (Reported in 2012 ).Bottom 20%Second 20% 200,000 210,000Third 20%Fourth 20%Lower Limit of Top 5%Income 150,000 119,001 100,000 76,538 72,583 50,000 49,788 44,223 31,166 27,794 22,984 14,243 earData Source: U.S. Census Bureau. Table F-1. Income Limits for Each Fifth and Top 5 Percent of Families, from Historical Income historical/index.html].20002005201020152020
RSFRussell Sage Foundation - Chartbook of Social InequalityPercentage Change in Family Income, 1947-1979 and 1979-2012(Reported in 2012 ).140%117.3%120%Bottom 20%110.8%108.0%106.1%104.1%Second 20%% Change in Family Income100%Third 20%Fourth 20%80%Lower Limit of Top 5%60%40.4%40%27.6%20%13.0%4.2%0%1947 - 1979-4.4%1979 - 2012-20%YearsData Source: U.S. Census Bureau. Table F-1. Income Limits for Each Fifth and Top 5 Percent of Families, from Historical Income historical/index.html].
RSFRussell Sage Foundation - Chartbook of Social Inequality 175,000Real Median Household Income by Educational Attainment of Household Head,1991-2012 (Reported in 2012 ). 150,0009-12 Yrs, no HS degreeHSDiplomaBachelor's DegreeMaster'sDoctorate 125,000 116,983 115,605Median Income 100,000 90,709 92,362 80,075 80,549 75,000 50,000 46,835 25,000 39,845 23,347 28,829 01990199520002005YearData Source: U.S. Census Bureau. Table H-13, Educational Attainment of Householder, from Historical Income historical/index.html].201020152020
RSFRussell Sage Foundation - Chartbook of Social InequalityReal Median Individual Income by Educational Attainment - People Age 25 and older, 19912012 (Reported in 2012 ). 120,0009-12 Yrs, noHS degreeHSDiploma 90,000 91,742Bachelor'sDegree 85,237Master'sMedian Income 70,901 71,364Doctorate 60,000 59,297 56,656 30,000 35,423 31,064 24,227 19,780 019901995200020052010Survey YearData Source: U.S. Census Bureau. Table P-16, from Historical Income Tables ical/index.html].20152020
RSFRussell Sage Foundation - Chartbook of Social InequalityReal Median Individual Income by Sex, and M/F Income Ratio, All Races, 19472012 (Reported in 2012 ). 40,0004 35,000 33,9043Income 25,000 21,520 20,0002 20,052 15,000 10,000Men 9,145WomenM/F Ratio 5,000 52000YearData Source: U.S. Census Bureau. Table P-2. Race and Hispanic Origin of People by Median Income and Sex, from Historical Income historical/index.html].2005201020152020M/F Income Ratio 30,000
RSFRussell Sage Foundation - Chartbook of Social InequalityReal Median Individual Income by Race/Ethnic Origin, 1947-2012(Reported in 2012 ). 40,000White 35,000Black 30,000Asian/PI 30,893Hispanic 27,999 25,000Income 23,818 20,000 21,644 20,856 19,228 16,852 15,000 10,000 7,635 5,000 000YearData Source: U.S. Census Bureau. Table P-4, Race and Hispanic Origin of People by Median and Mean Income, from Historical Income historical/index.html].2005201020152020
RSF Russell Sage Foundation - Chartbook of Social Inequality Data Source: DeNavas-Walt, C., B. Proctor, and