Transcription
SPC & FMEA: Integrating SystemsThinking Into Your QualityArchitecture to Drive ImprovementNicole M. Radziwill, PhD, MBAASQ Fellow & Editor, Software Quality ProfessionalQuality Practice Leader
Image Credit: D. Wells (1998)
2000:16300 km roadways1 hr 30 min average commute2010:70000 km roadways1 hr 55 min average commuteFrom Beck, M. (2015). Do more roads really mean less congestion for commuters? World Economic Forum, April roads-really-mean-less-congestion-for-commuters/
“In isolation, building more roads can certainly improve trafficconditions but these effects may only be local and only in the shortrun. Congestion may become worse in other parts of the networkand experience shows that spare road capacity is quickly filled up withnew cars.Even without the extra road users that new roads create, if the newroads are built in the wrong locations congestion may actually becomeworse simply because of the way people behave. Roads alone do notsolve congestion in the long term; they are only one (problematic) toolin a transport management toolkit.”From Beck, M. (2015). Do more roads really mean less congestion for commuters? World Economic Forum, April roads-really-mean-less-congestion-for-commuters/
Markus, M. L. (1983). Power, politics, and MISimplementation. Communications of the ACM, 26(6),430-444.Brooks Jr, F. P. (1995). The Mythical Man-Month:Essays on Software Engineering, Anniversary Edition,2/E. Pearson Education India.
peopleprocessproductpower
Objectives1. Describe how FMEA can be used to identifycorrective and preventive actions, launchimprovement plans, and address risk2. Explain SPC terminology, basic concepts, and howto apply it -- particularly beyond manufacturing3. Explain how QMS components work together,including NCR, CAPA, FMEA, SPC, DMAIC,APQP/PPAP, document management, trainingmanagement, audit management, design controls,material controls, equipment and facility controls,and change control.To help your organization:1. Avoid disconnected (and inefficient)management of quality events2. Identify quality issues faster/more effectively3. Capture opportunities for improvement
MotivationIntelex released a Process FMEAmodule designed for collaborationbetween business and engineeringNew partnership with InfinityQS forStatistical Process Control (SPC)
Nicole RadziwillQuality Practice Lead, IntelexFellow, American Society for Quality (ASQ)CSSBB #11962 & CMQ/OE #9583Ph.D. Quality Systems, Indiana StateEditor, Software Quality ProfessionalPreviously: Project Manager, Solution Architect,Engagement Manager in MeteorologicalResearch, Telecom, Manufacturing, Software,High Tech 1995-2002 Division Head (Director), Software, Green BankObservatory, 2002-2006 Assistant Director (VP) End to End Operations,National Radio Astronomy Observatory, 20062009 Associate Professor of Data Science &Production Systems, James Madison University,2009-2018
1: Systems Thinkinghow quality management tackles wicked problems
4/05/rehmann rover LCTT 2013.pdf
4/05/rehmann rover LCTT 2013.pdf
Ridwan, A., & Tasikmalaya, I. (2016). SixSigma Model to Improve the Lean SupplyChain in Ports by System DynamicsApproach. Doctoral Dissertation.
DependenciesConnectionsCausal LinksFeedbackComplexity Learn about complex problems that change Design for system performance, notsubsystem performance Communicate across functional boundaries Incorporate social, ethical, political context Incorporate environment, health, safety
Baldrige Criteriafor PerformanceExcellence (US)From: Baldrige Criteria for Performance Excellence (2017).
2: Failure Mode Effects Analysis (FMEA)figuring out what can go wrong, and fixing or anticipating it
Why do FMEA? The sooner you solve a potentialquality or safety problem, the lessit will cost – in and reputation.To do this, you have to identify risksand hazards and take actions toaddress them, so that failures do notoccur.It’s one step towards “zero defects”production.FMEA is also used to identify Criticalto Quality (CTQ) characteristics andSpecial Characteristics (SC)
FMEA Components:Failure Mode Effect Cause Control Failure Mode: What bad thing might happen Effect: What problems or issues will that bad thing lead to Cause: What’s the root cause of the bad thing/what will make it go away Control: Prevention: Can we prevent the thing from happening? Detection: Can we provide early awareness that the thing might happen?Include controls that exist as well as controls that don’t exist -- but maybe should.
From -fmea/
From Lockton, D., Harrison, D., & Stanton, N. A. (2010). The Design with Intent Method: A design tool forinfluencing user behaviour. Applied ergonomics, 41(3), 382‐392.
“ a ‘card-returned-then-cash-dispensed’ ATM dialoguedesign was at least 22% more efficient (in withdrawal time)and resulted in 100% fewer lost cards (i.e. none) comparedwith a ‘cash-dispensed-then-card-returned’ dialogue design.”Zimmermann, C. M., & Bridger, R. S. (2000). Effects of dialogue design on automatic teller machine(ATM) usability: transaction times and card loss. Behaviour & Information Technology, 19(6), 441-449.
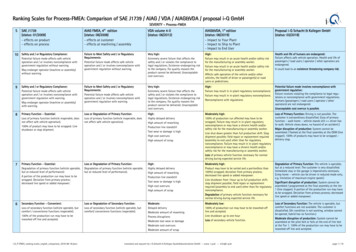
Tailored FMEASpecific solution approaches tailored to the needs of the businessSystem FMEASoftware FMEAGlobal Systems FunctionDesign FMEAServices FMEAComponents & SubsystemsSoftware FunctionsServices FunctionsProcess FMEAProduction & AssemblyA new method has been added in automotive with AIAG-VDA-5: FMEA for Monitoring and System Response (FMEA-MSR) which“is intended to maintain a safe state (i.e. safety) or state of regulatory (i.e. environmental) compliance during customer operation.”
Why IncorporateRisk-BasedThinking withFMEA?To make better decisions in uncertain environments: Reduce frequency of losses Reduce likelihood of losses Reduce costs of losses Improve response time Reduce stress Increase communication Enhance learning Capture opportunities for improvementFrom Willumsen, P., Oehmen, J., Rossi, M., & Welo, T. (2017). Applying leanthinking to risk management in product development. In Proc. 21st Intl. Conf. onEngr. Design (ICED 17), Vancouver, 269-278.“ in the end it is all about how organizationalinsights and knowledge are turned intostrategic insights and advantage.”Harry Hertz, Director Emeritus Baldrige Performance Excellence Program
3: Statistical Process Control (SPC)finding process problems before they impact the product
The earlier problems are detected, the less theycontribute to Cost of Quality (CoQ).Catching a process-related problem early meansyou can minimize problems with products or services: Prevent defects/recallsValue Reduce waste/rework Improve productivity Improve response timeSPC can provide other benefits like addedengagement in continuous improvement, and shiftingperceptions in the organization from reactive toproactive.
What Can Happen?There really wasa problemI detected aproblemI found noproblem at allIs the variation I’m observingOK, or is there a problem?There was noproblemGreat!FalseAlarmNondetectionGreat!
Is the process under control?ASK CONTINUOUSLY DURING PRODUCTIONIs the process capable ofmeeting customerrequirements?ASK DURING PROCESS DESIGN & CONTINUOUSIMPROVEMENT ACTIVITIESChart Source: InfinityQS
EXAMPLE: HUMAN BODY TEMPERATURE37 C or 98.6 FIs the process under control?THAT IS, NOT CREEPING UP OR DOWNIN A SYSTEMATIC WAYIs the process capable ofmeeting customerrequirements?YOUR CUSTOMER REQUIREMENT AVOID DEATH35 C40 C95 F105.8 F35.58 C96.05 F40.25 C100.45 F
Distributions are Not AlwaysNormal (Bell tical thinking lutions.com/histogram-examples.html
Non-Normal Data?No Problem: Take theaverage or sum of a batchof measurements andvoila bell-shaped(*)Chart Source: Radziwill (2017). Statistics (The Easier Way)With R, 2nd Ed.
1.SPC Preparation2.SPC in Operations
SPC Preparation1.2.Start with flow chart for producing “part”Figure out what’s important to measureo FMEA, CTQ Trees, Design of Experiments (DOE), Principal Component Analysis (PCA)3.Figure out what instrument will be used to measure ito Is the instrument calibrated? Make sure you have documentation that it is!o MSA-I (Gage Capability)4.Determine which people will measure which partso MSA-II (Gage R&R) can call out whether there are training or technique issues5.6.Pick rational subgroups and devise a sampling planRecord this control strategy in the control plan
12/control-plan-complete3.png
VariableDataNumbers that can be measured on acontinuous scale (1.2, 8.3, 4.5, 2.3) or asdiscrete values (1, 2, 3, 4): Height, width, thickness Temperature Weight, density Force, torque Time, cycle time, interarrival time
Categories that describe a process. Recordthe # or % of items in a category, or the rate(# or % divided by a period of time):AttributeData Number of defects Defects per unit, box, pallet, etc. Defects per shift, day, week, month, etc. Quality Good/Quality Bad Pass/Fail Go/No-Go Audit pointsOften there are only two categories.
7 heads 200 ml pouches(manually affixed) Produce 6 groups(42 pouches) perhour Two 8-hour shifts 672 juice pouchesper day 20 machines justlike this one
7 types of cookies Cookie plateconsists of 50cookies, nearlyevenly distributedacross cookietypes How could youassess the qualityof these cookies?http://www.gaylesbakery.com
Days between “Never Events” inhealthcare, such as wrong site surgeries Days between infection outbreaksAttributeData forRare Events Product liability lawsuits over threshold Production line stoppagesCrosses boundaries into safety management: Patient falls (healthcare) Days between safety incidents Days since last accident Accidental deaths or severe injuries
SPC in OperationsNow that you know what to measure for a particular part:1.Select an appropriate control chart2.Take 20-30 groups of observations and calculate control limits3.Continuously monitor the process4.If something deviates from those limits, take action
Common CauseVariation(Do Nothing!)The measurements typically bounce around alittle bit, but it’s OK because we expect to see: Variability in materials Variability in environmental conditions (e.g.temperature, humidity) Variability between machines Variability between operators Machine wear
The production process needs help!Special CauseVariation(Do Something!) Supplier materials are out of spec and youracceptance sampling didn’t catch it A machine is failing or about to break down The operator is doing something wrong(either inappropriate technique, insufficienttraining, or just having a very bad day) There has been a change in the way themeasurements are being made A “process shift” has occurred: operator,materials, methods, tools, machines, orenvironment has changed(*)
OCAPs (Out-of-Control Action Plans)provide work instructions for “specialcause” events:ReactionPlans(OCAP)1.Continue process but monitor closely2.Discontinue automation, run process manuallywith close observation3.Follow alternative instructions4.Stop process, make (and log) specifiedadjustments, resume5.Stop, launch corrective action/ root causeanalysis process, and resumeOCAPs should be linked to what specificrule was violated, e.g. an out-of-controlpoint or a trend violation.
Often referenced on Control Plan:OCAPFrom Kemper, B. P., Koning, S., Luijben, T. C., & Does, R. J. (2011). Qualityquandaries: Cost and quality in postal service. Quality Engineering, 23(3), 302-308.
4: Quality Architecturesystems, interactions, connections
Baldrige Criteriafor PerformanceExcellence (US)From: Baldrige Criteria for Performance Excellence (2017).
Quality Planning Establish quality goalsUnderstand organizationalcontext (mission, vision,values, strategy, position,capabilities)Understand businessenvironmentIdentify customer &stakeholder needs – Voiceof Customer (VoC)Design products/servicesto meet needsDesign processes forconsistent production &related controlsQuality Assurance/ QualityControl Evaluate processperformanceCompare performancewith quality goals Manage quality events,update controls AuditsManagement reviewsNonconformancesIncidents/near missesComplaintsQuality Improvement Build capabilities (peopleand technical)Build infrastructureIdentify and justify needsand gapsConduct improvementactivities and establishcontrols to maintain them Out-of-control productionAct to close the gaps Integrate lessons learned intoQuality Planning Quick wins (PDCA)Process improvement(DMAIC, Lean)Process design or redesign(DMADV)Business process mgmt(BPM) or Robotic ProcessAutomation (RPA)Confirm/Validate changes
Quality Eventsindicate that quality goalsare not being met andaction is needed Nonconforming productIncidents/near missesCustomer complaintsRecalls/warranty callsDeviations (from SOP)Out-of-control Action PlansIndustry-specific events (e.g. MDRs)Serious orsystematic?not reallycontainmentyesCAPA
QualityControlsto prevent or correct unwantedor unexpected change addstability and consistency CalibrationsMaintenanceInspectionsSampling incoming partsProcess validationMistake-proofingIn-situ process monitoringEnvironment monitoringProfessional testing/ competencyassessmentTraining programs and remindersCorrective actions takenInformation security/ network security
The FDA Model for QMS ComponentsCAPAConcurrentEngineering, DFMEASPC Supplier qualitymanagementTrainingAudits/MRPolicy/People
SOFTWAREAPQP/PPAPSystem FMEAcauses become failure modes5 WhyINPUTSCORE OBJECTSuses8DRCADesign FMEAFishbonecauses become failure modesProcess FMEASIPOCinput toProcessFlowChartLSSProjectinput toValueStreamMaptells uswhat tomeasureMSA I& RSinformsprovides controls toused to isk)OCAP(ReduceFailures)triggersSPCControl PlanmightinformWorkInstructionsstored/tracked inQuality Events:AuditsComplaintsMgmt ReviewSupplier MgmtDocument Controluses up-to-date docsTraining MgmtQMS REFERENCE ARCHITECTURE
Process Design:we don’t have a processyet, but we need todevelop one that meetsspecifications andachieves quality goalsRoot Cause Analysis/Corrective Actions:we need to fix a problemto restore our ability tosatisfy quality goalsProcess Improvement:everything is going OKbut it could be better
Value is in the integrationpoints: Keeping track of Reaction Plans/OCAPsand when they change Managing linkage between FMEA andSPC monitor points Keeping records for when ReactionPlans/OCAPs are triggered Traceability through problem-solvingprocess (e.g. RCA, 8D), correctiveaction(s), and observed outcomes Updating FMEAs after corrective actions,and flowing that down to SPC Control plan
itigating-risk-fmea-quality-management-software
Nicole RadziwillCONTACTQuality Practice tps://www.linkedin.com/in/nicoleradziwill/
Supplemental Slides
From Cross, J. (2017). ISO 31010 Riskassessment techniques and open systems. SixthWorkshop on Open Systems Dependability,Tokyo, October 21. PEST/PESTILE SWOTFor more methods, consult the text of ISO/IEC31010 Risk management methods
SubgroupSizeChartType(s)1I-MRChoose this when VariableCharts Small (2-10)Xbar-R Xbar-S CUSUM,EMWA and does notchangeLarge ( 10)Data is difficult or expensive to collect (e.g.in a blast furnace, destructive testing)Production is in small-volume productionruns or runs that take a lot of time (e.g.brewing lager or kombucha)Measurements can’t be taken in groups (e.g.temperature of a tank)Measurements tend to cluster around amean (normally distributed) with consistentvariabilityInspection process doesn’t change oftenand changesAnyTiny variations in the process need to bedetected
AttributeChartsSubgroupSizeChartType(s)Choose this when Any, but staysthe samenp Monitoring number of defects nonconforming (failed) items in a batchAny, and canchangep Monitoring proportion of defects nonconforming (failed) items in a batch dividedby batch sizeAny, but staysthe samec Monitoring total number of defects in eachunit/product, or total number of some eventthat occurs per unit timeAny, and canchangeu Monitoring average number of defects perunit/product, or rate of occurrence of someevent that occurs per unit timeN/Ag Monitoring number of events between rarelyoccurring errors or nonconforming incidentsN/AT Monitoring passage of time between rarelyoccurring errors or nonconforming incidents
SPC & FMEA: Integrating Systems Thinking Into Your Quality Architecture to Drive Improvement Nicole M. Radziwill, PhD, MBA ASQ Fellow & Edit