Transcription
Core Tools: The Alphabet Soup ofAPQP, PPAP, FMEA, SPC and MSAJd Marhevko – Accuride Corporation, SVP QLMSShainin Medalist, ASQ Fellow, CSSBB, CMQ/OE, CQE, STEP AwardeeASQ World Conference – Session T12 – May 1, 2018
The FIVE Core Tools1. APQP: Advance Product Quality Planning:Guidelines for a product quality plan to develop a product orservice that satisfies the customer2. FMEA: Failure Modes and Effect Analysis: Methodology used toensure potential problems have been considered and addressedthroughout the product and process development process (Ex.APQP). Traditionally includes the Control Plan (CP)3. PPAP: Production Part Approval Process: Ensures productconsistently meets customer engineering specificationrequirements during production run at the quoted production rate4. MSA: Measurement Systems Analysis: Guidelines for assessingthe quality of a measurement system where readings arereplicated5. SPC: Statistical Process Control: Basic graphing statistical toolsthat enable process control and capability for continualimprovement
Other Sample Manuals
Core Tool inferences in ISO/IATF 16949:2016CoreToolISO 9001:2015(Core Tools NOT Specified)IATF 16949:2016(Core Tool Inferred/Referenced)APQP8.1 Operational Planningand Control8.2 Requirements forProducts and Services8.3 Design and Developmentof Products and Services8.4 Control of ExternallyProvided Processes,Products and Services8.1.1 Operational Planning and Control8.2 Requirements for Products and Services8.3 Design and Development of Products and Services8.4 Control of Externally Provided Processes, Productsand ServicesFMEA6.1 Actions to Address Risksand Opportunities8.3.5 Design andDevelopment Output9.1. Monitoring,Measurement, Analysis andEvaluation General4.4.1.2 Product Safety6.1 Actions to Address Risks and Opportunities8.3 Design and Develop of Products and Services[8.3.3.3, 8.3.5.1, 8.3.5.2]8.5 Production and Service Provision [8.5.1.1, 8.5.6.1.1]8.7 Control of Non-Conforming Outputs [8.7.1.4, 8.7.1.5]9.1 Monitoring, Measurement, Analysis and EvaluationGeneral9.2.3 Manufacturing Process Audit10.2 Non-Conformity and Corrective Action [10.2.3,10.2.4]10.3.1 Continual Improvement
Core Tool inferences in ISO/IATF 16949:2016CoreToolISO 9001:2015(Core Tools NOT Specified)IATF 16949:2016(Core Tool Inferred/Referenced)CP*8.3.5 Design and DevelopmentOutputs8.5.1 Control of Production andService Provision8.6 Release of Products andServices8.7 Control of Non-ConformingOutputs8.3.5.2 Manufacturing Process Design Output8.5 Production and Service Provision [8.5.1.1,8.5.1.3, 8.5.6.1.1]8.6 Release of Products and Services8.7 Control of Non-Conforming Outputs9.1.1.2 Identification of Statistical Tools9.2.2.3 Manufacturing Process Audit10.2.3 Problem SolvingAnnex A. Control PlanPPAP8.3.4 Design and DevelopmentControl8.3.4.3 Prototype Program8.3.4.4 Product Approval Process*The Control Plan is not considered a “stand alone” Core Tool. Usually paired with the P-FMEA
Core Tool inferences in ISO/IATF 16949:2016CoreToolISO 9001:2015(Core Tools NOT Specified)IATF 16949:2016(Core Tool Inferred/Referenced)SPC9.1 Monitoring, Measurement,Analysis and Evaluation8.3.5.2 Manufacturing Process Design Output8.6.4 Verification & Acceptance of Conformity 9.1 Monitoring, Measurement, Analysis andEvaluationMSA7.1.5 Monitoring and MeasurementResources7.1.5 Monitoring and Measuring Resources7.1.5.1.1 MSA7.1.5.2.1 Calibration/Verification Records7.1.5.3 Laboratory Requirements8.6.3 Appearance Items (inference)
APQPAdvanced Product Quality PlanningDFSSDMAIC
APQPWhat is it: The management of Product DevelopmentWhy do we need it: To understand what our customerwants and to fulfill those wantsHow is it done: Across a prescriptive “Five-Stage”, “Gated”or “Phased” approach. Other iterations exist and are alsoused so long as the foundational five are in place. Theprocess is required to be cross-functional in its developmentand execution
The Typical APQP OVALPROTOTYPEPILOTLAUNCHPLANNINGPLANNINGPRODUCT DESIGN AND DEV.PROCESS DESIGN AND DEVELOPMENTPRODUCT & PROCESS VALIDATIONPRODUCTIONFEEDBACK ASSESSMENT AND CORRECTIVE ACTIONPlanningINPUTSProduct Design &DevelopmentINPUTSProcess Design &DevelopmentINPUTSProduct & ProcessValidationINPUTSFeedback,Assessment &CAPA INPUTSPlanningOUTPUTSProduct Design &DevelopmentOUTPUTSProcess Design &DevelopmentOUTPUTSProduct & ProcessValidationOUTPUTSFeedback,Assessment &CAPA OUTPUTS
APQP Plan & Define PhaseTypical InputsTypical OutputsVOC DataMarketing StrategyDesign goalsReliability/Quality GoalsProduct/ProcessAssumptionsCustomer InputsPreliminary CriticalCharacteristicsPreliminary Process FlowCompliance CriteriaEtc.Preliminary BOMEtc.
APQP Product Design & Development PhaseProgram ApprovalDesign OutputsAPQP OutputsDFMEADesign for Mfg/AsmDesign VerificationNew Equipment/ToolingNew Facility NeedsGage/Test RequirementsPrototype BuiltEng Drawings/SpecsEtc.Final Critical CharacteristicsEtc.
APQP Product Design & Development PhasePrototype OutputsPkg Standards/SpecsProduct/Process ReviewProcess Flow ChartMSA/AAAManagement SupportCp/Cpk PlanFloor PlanPFMEA/DCPWork InstructionsEtc.
APQP Product & Process ValidationPhasePilot. Sample OutputsSignificant Production RunMSA/AAAPackaging/PreservationProduction ControlCp/Cpk StudiesPPAP CompletionProduct Validation TestingQuality Sign-OffsManagement SupportEtc.
APQP Feedback, Assessment & CAPAPhaseLaunch OutputsReduced VariationImproved Customer SatisfactionImproved Delivery/ServiceLessons LearnedStandard Work UpdatesEtc.
Design FMEADesign Failure Mode Effects Analysis
ALL Products & Processes FailFailure is ALWAYS a Design Requirement/CriteriaDetermining HOW the design will fail, WHEN it will fail, andWHY it will fail will allow a designer to incorporate failure asan acceptable design constraintFailure as an ACCEPTABLE design constraint Customer Satisfaction Design QualityPlanning for Failure
FMEA: Design (D) & Process (P)What is it: A risk analysis of a part or processWhy do we need it: To identify the functions of a process andthe associated potential failure modes, effects and potentialcauses. The vision is to prevent problems from occurring so thatdefects are not incurred and no one gets hurt. It is used toevaluate if the current planned actions are sufficient and effectiveHow is it done: Via the utilization of a cross-functional teamapproach. Multiple iterations exist across industry. Within IATF,the process is required to be cross-functional in its developmentand execution. It is considered a “Risk-Based Thinking” (RBT)tool. It often incorporates results from other methods such asSPC, MSA, Fault Tree Analysis, etc.
FMEAS for Products & ProcessesThere are three (3) basic cases in which an FMEA is applied:1. New designs, new technology or new process2. New application of existing design or process3. Changes to an existing design or process Design FMEA: A technique which analyzes systemfunctions within a defined boundary to address possibledesign weakness and potential risks of failure. DFMEAdata is used in the creation of the PFMEA Process FMEA: A technique which analyzes processesthat can impact quality. These processes may be:Receiving, Handling, Manufacturing, Assembly, Storage,Transportation, Maintenance, Repair and Communication
Six (6) Steps of an FMEA (D or AnalysisRiskAnalysisOptimiza-tion1. Define Scope. Identify what is to included in theevaluation. (System, Sub-system, Component). Includerelevant Lessons Learned (LL) and reference materials.Manage the five (5) T’s:1. Team: Who will constitute the core team2. Timing: When is it due. Gantt, lay-out timing plan3. inTent: Why is the team there; Ensure skills/training4. Tool: What reporting methodology will be used? Excel,Software, etc5. Task: What work needs to be done across the six steps.Consider inclusion of effective documentation forauditing and customer review
alysisRiskAnalysisOptimiza-tion2. Conduct System Analysis: Define the customer(s) wrtEnd Users, Assembly, Manufacturing, etc.1. Identify and break down the design into system,sub-system, component and parts for functional riskanalysis. Note: A component FMEA is a subset of asystem FMEA. Ex. A brake pad is a component of abrake assembly which is a sub-system of the chassis2. Visualize the system via block (boundary) and/orstructure tree diagramsChassisStructureBlock
alysisRiskAnalysisOptimiza-tion3. Conduct Function Analysis: Insures that the specifiedand required functions are appropriately allocated to thesystem elements. A function describes WHAT the item/system element is intended to do.1. Associates functions with the pertinent system elements2. Overviews the functionality of the product3. May describe functions in detail. May need to considerinterfaces and clearances wrt physical connections,material exchange, energy transfer and data exchange4. Allocates requirements/characteristics to individualfunctions5. Cascades internal/external customer functions withassociated requirements for intended use
alysisRiskAnalysisOptimiza-tion4. Conduct Failure Analysis: Identify failure causes,modes, and effects, and show their relationships toenable risk assessment.Failure effects are the consequence of a failure mode1. Identification of potential failures assigned to functionsin structural elements2. Visualize failure relationships (FMEA spreadsheet)3. Collaborate between the customer and suppler oneffectsConsider “Failure Chain”approach. AKA theGolden CircleWHATFailureEffect (FE)HOWFailureMode (FM)WHYFailureCause (FC)Marker dried outCap Fell OffBarrel ID too Small
alysisRiskAnalysisOptimiza-tion5. Conduct Risk Analysis. Prioritize the risks by evaluatingSeverity (how bad), Occurrence (how often) andDetection (how well can we find it). Aka SOD. Each is ona scale of 1-10. The multiplication of S x O x D is the RPN1. A Risk Priority Number (RPN) is determined2. Based on the RPN, assign preventive controls whichprovide information/guidance as an input to the design3. Assign detective controls to verify and validateprocedures previously demonstrated to detect thefailure4. Completed SOD assessment5. Collaboration between customer and supplier onSeverity
RPN, Criticality or PrioritizationEach method of evaluation has pros and cons. There is achange in process towards an “Action Prioritization” (AP)matrix which may incorporate Criticality (S*O). RPN will beeliminated as a method of risk evaluation (AIAG, 2018)AIAG currently references the SOD tables found in theFMEA “Blue Book”. Many organizations have evolved totheir own form of prioritization tablesbased on their own logic
4th Ed SOD Summary for Design FMEANOTE: OEs & Other businesses often use their own SOD tables. This is a MODEL#Severity CriteriaOccurrence CriteriaOpportunity for Detection10Failure to meet safety and/or regulatory requirements.Potential failure mode affects safe vehicle operationand/or involves non-compliance with governmentregulation without warningVery high. New technology/new design with nohistory. 1 per 10No detection opportunity: No current design control. Cannot detector is not analyzed. Detection is almost impossible9Failure to meet safety and/or regulatory requirements.Potential failure mode affects safe vehicle operationand/or involves non-compliance with governmentregulation with warningHigh. Failure is inevitable with new design, newapplication or change in duty cycle/operatingconditions. 1 in 20Not likely to detect at any stage. Design analysis/detection controlshave a weak detection capability. Virtual analysis is not correlatedto expected actual operating conditions. Detection is very remote8Loss or degradation of primary function. Loss ofprimary function7Loss or degradation of primary function. Degradationof primary function6Loss or degradation of secondary function. Loss ofsecondary function5Loss or degradation of secondary function.Degradation of secondary function4Annoyance. Appearance or audible noise, vehicleoperable, item does not conform and noticed by mostcustomers ( 75%)High. Failure is likely with new design, newapplication or change in duty cycle/operatingconditions. 1 in 50High. Failure is uncertain with new design, newapplication or change in duty cycle/operatingconditions. 1 in 100Moderate. Frequent failures associated withsimilar designs or in design simulation andtesting. 1 in 500Moderate. Occasional failures associated withsimilar designs or in design simulation andtesting. 1 in 2,000Moderate. Isolated failures associated withsimilar designs or in design simulation andtesting. 1 in 10,000Post design freeze and prior to launch. Productverification/validation after design freeze and prior to launch withpass/fail testing. Detection is remotePost design freeze and prior to launch. Productverification/validation after design freeze and prior to launch withtest to failure testing. Detection is very lowPost design freeze and prior to launch. Productverification/validation after design freeze and prior to launch withdegradation testing. Detection is lowPrior to design freeze. Product verification/validation after designfreeze and prior to launch with pass/fail testing. Detection ismoderatePrior to design freeze. Product verification/validation after designfreeze and prior to launch with test to failure testing. Detection ismoderately high3Annoyance. Appearance or audible noise, vehicleoperable, item does not conform and noticed by manycustomers ( 50%)Low. Only isolated failures associated with almostidentical design or in design simulation testing. 1in 100,000Prior to design freeze. Product verification/validation after designfreeze and prior to launch with degradation testing. Detection ishigh2Annoyance. Appearance or audible noise, vehicleoperable, item does not conform and noticed bydiscriminating customers ( 25%)Low. No observed failures associated with almostidentical design or in design simulation testing. 1in 100,000,0001No discernable affectVery low. Failure is eliminated through preventivecontrolVirtual analysis correlated. Design analysis/detection controls havea strong detection capability. Virtual analysis is highly correlatedwith actual or expected operating conditions prior to design freeze.Detection is very highDetection not applicable; failure prevention. Failure cause or failuremode can not occur because it is fully prevented through designsolutions. Detection is almost certainPFMEA 4th Edition. 2008. Chrysler LLC, Ford Motor Company, General Motors Corporation
alysisRiskAnalysisOptimiza-tion6. Evaluate for Optimization. The planning and execution ofactions to mitigate risk and assess the effectiveness ofthose actions1.2.3.4.Identify necessary actionsAssign responsibilities and timingConfirmation of effectiveness of the actions takenContinuous improvement of the designMultiple other types of FMEA applications: System,Concept, Environmental/Safety, Machinery, Software, etc.
DFMEA Sample FormatDFMEA formats vary widely based on OE criteria andindependent company expectations Even though the AIAGwill add 8-10 more columns to the current standard, thegeneral approach and intent will be the same; mitigate riskthrough failure analysisN/AMarkerWrite1,000 ft ofcontinuousdrawingCap Falls OffMarker dries outBarrel ID toosmall4N/A Cap ID too largeN/AFelt insert toolongSpec forinterference fitUse felt materialwith low CTE42Instron pull testABCInstron pull testABCCTE lab testXYZ232None at this time20None at this time30None at this timeResponsibility & Actions TakenTarget DateCompletion DateRPN4RecommendedActionDetection (D)Spec forinterference fitControls(Detection)Ooccurrence (O)Controls(Prevention)Severity (S)PotentialCauses ofFailureRPNPotentialEffect(s) ofFailure6. OPTIMIZATIONDetection (D)Potential Failure ModeRequirement5. RISK ANALYSISOccurrence (O)Function4. FAILURE ANALYSISClass3. FUNCTION ANALYSISSeverity (S)Item2. SYSTEM ANALYSIS
Other DFMEA Sources http://quality-one.com/fmea/design-fmea/ http://www.isixsigma.com/dictionary/dfmea/ http://www.qmii.com/LT133%20ISO%209001 2015%20Risk%20Based%20Thinking.pdf http://www.iso.org/iso/home/standards/iso31000.htm (ISO RiskManagement) 86 Minute Video very esign-of-experimentsdoe/mark-kiemele-interview/ AIAG APQP for DFMEA Checklist (2nd ed)
Process FMEA & CPPFMEA Control Plan Dynamic ControlPlanDynamic Control Plan
What is a DCPA DCP is a blended format of a PFMEAand CP. It leverages the common columnsin both tools and enables “linear” thinkingacross the analysis of an individual process stepIt saves time and increases the security of the system A PFMEA defines, identifies, prioritizes, and eliminates knownand/or potential process failures from reaching the customer. Thegoal is to eliminate Failure Modes and reduce their risks A CP follows the PFMEA steps and provides details on how the"potential issues" are checked for in the process A DCP is a living document which helps to prevent problems It saves time and increases process security
A DCPA DCP lists a sequence of tasks used to produce a product orprovide a service by combining the PFMEA and CP. It:1. Identifies process related Failure Modes before they occur2. Determines the Effect & Severity of these failure modes3. Identifies the Causes and probability of Occurrence of thefailure modes4. Identifies the Controls and their Effectiveness5. Quantifies the Risks associated with the failure modes6. Develops and documents Action Plans to reduce the risks7. Identifies the Type & Effectiveness of the Gaging system8. Determines the necessary Inspection Frequency
FMEA & CP in One FormatPlantPart/Produc t NameCustomer PNSite AddressSite AddressSite AddressXXXXXXProc essPN:Flow Chart #PN/Revision/DateXXXXXXXXXNo.AXXXPrototype (X)Product/Process CharacteristicsChar. or ProcessDescCharacteristicBCSCClassDPre-Launch (X)Potential Failures and EffectsFailureEffects ofModeFailureECustomer PN/Revision/DateXXX01/01/0001/01/00Production (X)Causes of FailureSEVCauseOCCGHIFCurrent ControlsControl - DetectControl Method toFailure ModePrevent CauseJKCP “Side” P - AAThe format is completedlinearly from A – AA. Thisensures inclusion of a gagingsystem review and eliminatesthe need to manage 2 forms** ** ****Many sites modifythe format to fit theirown needsDynamic Control Plan (DCP) Revision/DateCore Team:"C""B""A"XXXXXXXXXDCP File Number:01/01/0001/01/0001/01/00(Rolling top 3 ETOWI#ToolFxt sign EngMfg EngProd MgrXXXGage Desc/Gage No.00000000QRPN000000000000000000MXXX OtherXXX OtherXXX OtherGRR &DateInspFreq**WXCpk &DateReactionPlans**YZAA
A Practice DCPThe fit of a marker cap 1. Look at the cap and barrel of a writing marker2. Review the step of assembling the cap onto the barrel3. Complete relevant lines of the DCP wrt assembly4. There can be two general failure modes:a. The cap fits with an audible “click” and stays firmly inplace. It does NOT easily pull offb. The cap does not stay secure and falls off5. Each failure mode will have its own “DCP Stream” ofinformation6. Follow across the format and complete the information7. Work in teams across the format
4th Ed SOD Summary for Process FMEANOTE: OEs & Other businesses often use their own SOD tables. This is a MODEL#Severity Criteria (Customer Effect)OccurrenceOpportunity for Detection10Failure to meet safety and/or regulatory requirements. Potentialfailure mode affects safe vehicle operation and/or involves noncompliance with government regulation without warningVery high. 1 per 10No detection opportunity: No current process control. Cannot detect or is not analyzed.Detection is almost impossible9Failure to meet safety and/or regulatory requirements. Potentialfailure mode affects safe vehicle operation and/or involves noncompliance with government regulation with warningHigh.1 in 20Not likely to detect at any stage. Failure mode and/or Cause is not easily detected.Detection is very remote8Loss or degradation of primary function. Does not affect safevehicle operationHigh.1 in 50Problem detection post processing. Failure mode detection post processing by operatorthrough visual, tactile, or audible means. Detection is remote7Loss or degradation of primary function. Degradation of primaryfunction. Vehicle operable at reduced level of performanceHigh.1 in 1006Loss or degradation of secondary function. Vehicle operable butconvenience/comfort functions inoperableModerate.1 in 5005Loss or degradation of secondary function. Vehicle operable butconvenience/comfort functions at reduced levels of performanceModerate.1 in 2,0004Annoyance. Appearance or audible noise, vehicle operable, itemdoes not conform and noticed by most customers ( 75%)Moderate.1 in 10,000Problem detection at source. Failure mode detection in-station by operator throughvisual, tactile, or audible means or post-processing through attribute gaging. Detectionis very lowProblem detection post processing. Failure mode detection post-processing byoperator through use of variable gaging or in-station by operator through use ofattribute gaging. Detection is lowProblem detection at source. Failure mode or error detection in-station by operatorthrough use of variable gaging or by automated controls in–station that will detectstissue and notify operator. Gaging performed on setup and 1 pc check. Detection ismoderateProblem detected post processing. Failure mode detection post-processing byautomated controls that will detect discrepant part and lock part to prevent furtherprocessing. Detection is moderately high3Annoyance. Appearance or audible noise, vehicle operable, itemdoes not conform and noticed by many customers ( 50%)Low.1 in 100,0002Annoyance. Appearance or audible noise, vehicle operable, itemdoes not conform and noticed by discriminating customers ( 25%)Low. 1 in100,000,0001No discernable affectVery low. Failure iseliminated throughpreventive controlProblem detection at source. Failure mode detection in-station by automated controlsthat will detect discrepant part and automatically lock part in station to prevent furtherprocessing. Detection is highError detection and/or problem prevention. Error cause detection in station byautomated controls that will detect error and prevent discrepant part from being made.Detection is very highDetection not applicable; error prevention. Error cause prevention as a result offixture/machine/part design. Discrepant parts cannot be made due to error proofing.Detection is almost certainPFMEA 4th Edition. 2008. Chrysler LLC, Ford Motor Company, General Motors Corporation
For Want of A HorseSKF USA Inc, Reprinted with permission 10/6/14
DCP or Fire-Fight?Planning vs Fire-FightingWhen Planning is Secondary to rcesMany SurprisesWhen Fire-Fighting is Secondary to PlanningSignificantly FewerSurprisesPlanningthrough ProductionProject TimingPlanningLaunchProductionProject TimingTotal time is area under the curve Estimated monies are7:1 with OT, Freight, Material/Equipment changes, T&E,etc. Leverage the DCP to minimize fire-fighting afterrelease. Partner with functional teams
Case Study: Before/After DCPInitial release and after DCP implementation of 3 products.Was planning secondary to firefighting? What kinds of losseswere likely incurred? Was it worth it? June: Before DCP Sept: After DCP December:Current Performance
PPAPProduction Part Approval Process
PPAPWhat is it: Requirements for approval of production partsWhy do we need it: To make sure that we understand all ofthe customer requirements, and that we can meet themunder actual production conditionsHow is it done: Based on customer direction, there are 5levels of PPAP to secure product approval. An application“cover sheet” is called a Product Sample Warrant (PSW)which lists 18-20 different types of evidence that may berequired for submission. These can be customer and/orproduct/process dependent. It is typical for a customer towitness a launch and review PPAP records when on-site
PPAP Levels per AIAG 4th ed.1. Warrant only for appearance items2. Warrant with product samples and limited supporting data3. Warrant with product samples and complete supportingdata4. Warrant with other requirements specified by the customer5. Warrant with product samples and complete supportingdata reviewing at the supplier’s manufacturing locationPPAP level details are typically arranged in advance with thesupplier and customer and will often depend on whether theproduct is a new design or another revision of a tried and trueprocess
PPAP Components1. Design records2. Authorized EngineeringChange documents3. Customer engineeringapproval4. Design FMEA5. Process flow diagrams6. Process FMEA7. Control Plan8. MSA Studies9. Dimensional results10. Material/performance testresults11. Initial process study12. Qualified lab documentation13. Appearance approval report14. Sample production parts15. Master samples16. Checking aids17. Customer specificrequirements (CSR) records18. PSW19. Bulk material requirementschecklist20. Special process auditresults
PPAP Prep All Hands on Deck1. TAKES TIME and attention to DETAIL2. Requires a cross-functional team3. Insure a good understanding of the Customer SpecificRequirements (CSRs) in advance4. Do WELL on the Appearance Approval Reports (AARs). Whilethe easiest “up front”, these are often the most expensivelater on. Take the time to develop boundary samples andconduct Attribute Agreement Analysis (AAAs) to ensure skill5. Attend to the full Measurement System Analysis (MSA) onvariables metrics. Include calibration, resolution and GRR6. Enable sufficient lead time for the DFMEA, FMEA and CP7. Insure statistical control of significant characteristics8. Etc.
How to Organize1. Many customers will dictate submission formats2. Some companies establish binders/books3. Some use formal organizing softwareIt is critical that:1. More than 1 person has access/passwords2. Proper security is enabled across those individuals3. Proper revisions are sustained/maintained
Cp/Cpk/Pp/PpkProcess Capability Primer
Process Capability 101 Cp/Cpk: Also called “short term” capabilitywhich is used to reliably determine if aprocess is yielding good initial results bytaking a representative sample size. Cp is based on the whole breadth of the process Cpk is based on “half” of the process Pp/Ppk: Also known as “long term” processcapability. The key difference is that there ismuch more data on hand for Pp/Ppk. AIAGnotes “90 shifts, 90 days”
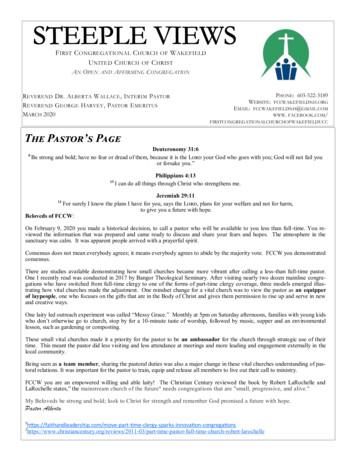
Dissecting the BellLower Spec LimitUpper Spec Limit6s ( /- 3 on each side of the average)When thereis ROOMfor 6sigma’s onEACH sideof theaveragebefore theclosesttarget ishit 34.2% 34.2%654321113.6%245613.6%2.1%0.15%32.1% /- 1s 68.4% /- 2s 95.6% /- 3s 99.70% /- 4s 99.994% /- 5s 99.9994% /- 6s 99.9997%0.15%THEN youhave “6squality!”
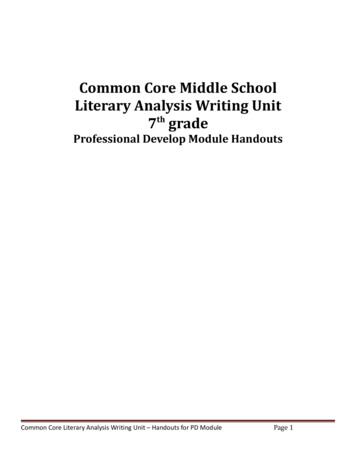
Calculating CapabilityCp (Pp). Measures the ability ofthe WHOLE bell to fit within thetarget limitsIf the whole bell (6 sigmas) fitwithin the target limits a total of 1time, then the Cp 1.Ideally, 2 is preferred.Cp (USL – LSL) / (6 x s)USL 6, LSL 0, s 1036Cpk (Ppk). Measures the ability ofHALF of a bell (3 sigmas) to fit withinthe average and the closest targetlimitCpkU (USL – Average) / (3 x s)CpkL (Average – LSL) / (3 x s)USL 6, LSL 0, s 1Cp (6 – 0) / (6 x s) 1CpkU (6 – 5) / (3 x s) 1/3 (0.33)CpkL (5 – 0) / (3 x s) 1 2/3 (1.67)012345678
Cpk WorksheetDetermine the Cp and Cpk for each situation Remember, if the process is NOTshaped like a bell, then sigma cannot be used (without special consideration)and the Cp/Cpk cannot be properly determinedIn each case either theaverage or sigma mayor may not change only the specificationsremain the CpkUCpkL35100%Non-Conf457.5100510
Shift HappensCpk of 2 is desired for initial capabilityLong term capability is Ppk. This is the capabilityafter the process experiences “life” via multiplematerial lot changes, set up and operatorvariation, seasonality, etc. Ppk is usuallycalculated after “90 days” (or with a significantquantity) of process data. It is the type of productresults that the long term process will representIt is estimated that a process will “shift” by /1.5s in response to those changes. As such, if aprocess started ideally with a Cpk of 2.00, then itis estimated that the resultant Ppk would be 1.33to accommodate these types of affectsBeforeCpkCpk 2.0AfterPpk /- 1.5sPpk 1.33
MSA (GRR & AAA)Measurement Systems Analysis
Measurement System AnalysisWhen we measure or make an assessmentof the goodness of an item, we need to besure that our result is correct. If it is notcorrect, we take two risks: Alpha a Risk: We may inadvertently discard orrework a good item (Aw, darn) Beta b Risk: We may inadvertently pass on abad item (Boy, that was Bad)
Why Do We Need to Know?We need to know how much error there is in ourmeasurement processes for several reasons: Prevent a and b errors Reduce scrap/rework Understand what process Cp/Cpk weneed our processes to have It is our JOB to ensure that our peopleare enabled to make the right pass/faildecision EVERY time And of course it is an inherent part of PPAP NOTE: EVERY item called out for measure or inspection ona control plan is REQUIRED to have an MSA analysisconducted.
MSA Types: Varia
APQP, PPAP, FMEA, SPC and MSA Jd Marhevko –Accuride Corporation, SVP QLMS Shainin Medalist, ASQ Fellow, CSSBB, CMQ/OE, CQE, STEP Awardee ASQ World Conference –Session T12 –May 1, 2018. 1. APQP: Advance Product Quality Planning: Guid