Transcription
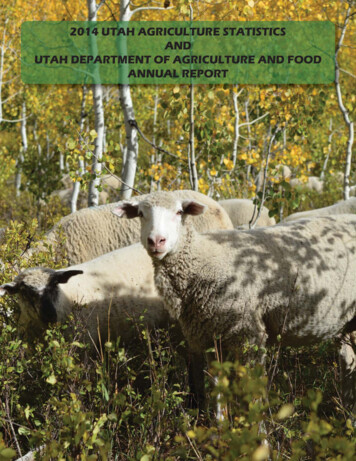
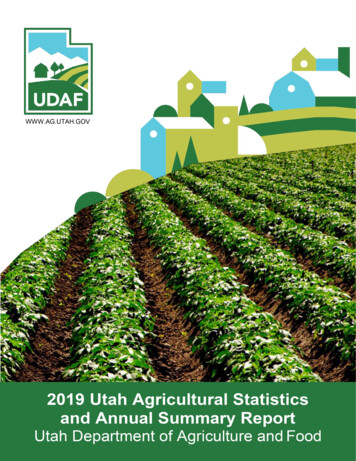
UTAH AGRICULTURAL STATISTICSANDUTAH DEPARTMENT OF AGRICULTURE AND FOOD2019 ANNUAL REPORTCompiled by theUnited States Department of AgricultureNational Agricultural Statistics ServiceMountain Region, Utah Field OfficeJohn Hilton, State StatisticianJoel Gentillon, Survey Coordinator350 S Main St, Suite 100Salt Lake City, Utah 84101801-524-5003Fax: 866-314-4029http://www.nass.usda.gov/Statistics by State/Utah/E-mail: nass-ut@nass.usda.govIssued cooperatively byUtah Department of Agriculture and FoodKerry Gibson, CommissionerSasha Clark, PIO350 N Redwood RoadP.O. Box 146500Salt Lake City, Utah 84114-6500801-538-7100Fax: 801-538-7126Web Page: http://ag.utah.govE-mail: larrylewis@utah.govPhotos – provided by Utah’s Own and UDAF employeesand purchased stock photography.ISSN: 0276-0193Hubert Hamer, AdministratorTroy Joshua, Director, Western Field OperationsWilliam Meyer, Regional Director, Mountain Region
IntroductionThe Utah Field Office of the Mountain Region of USDA’s National Agricultural Statistics Service (NASS) and the UtahDepartment of Agriculture and Food (UDAF) are proud to present the 45th edition of this publication. Copies of thepublication are only available on both organizations’ Internet sites. This publication is provided to help inform farmers,ranchers, and the public about activities within UDAF and provide a detailed look at Utah's agricultural production. Alsoincluded are budgets for helping farmers and ranchers evaluate the potential profitability of various agricultural commodities.Cooperation from farmers, ranchers, and agribusinesses responding to various survey questionnaires is essential for qualityestimates; their cooperation make this publication possible. We thank them for their help and willingness to provide thedata needed to produce these statistics.This report would not be possible without the dedicated effort of our field and telephone enumerators who collect this data.We thank them for their diligence and professionalism.Estimates presented are current for 2018 production and January 1, 2019 inventories. Data users that need 2019 productioninformation, or additional historic data, should contact the Utah Field Office at 801-524-5003 or toll free at 1-800-747-8522.State and U.S. statistics are available on the NASS Web page at http://www.nass.usda.gov/. Use the “Quick Stats” utilityto search for current or historic data by clicking the Data and Statistics tab.Prior year estimates are subject to revision and may have been revised in this publication. Data users should use thispublication for previous years’ data and not go back to earlier publications for those data.The following agricultural Web pages may interest you.OrganizationU. S. Department of Agriculture (Includes links to all USDA Agencies)USDA – NASSUSDA - NASS Census of AgricultureUSDA - Utah Agricultural StatisticsUtah Department of Agriculture and FoodNational Association of State Departments of Agriculture (NASDA)Food and Agricultural Policy Research InstituteCME GroupSalt Lake City National Weather ServiceWestern Regional Climate CenterUtah Climate CenterUSU Extension ServiceUtah Agriculture in the ClassroomUtah Farmers UnionUtah Farm BureauUtah Cattlemen’s AssociationUtah Wool Growers AssociationUtah Dairy CouncilWeb Page on presented in this publication may be reproduced with the proper credit and no written approval is necessary.Sincerely,John Hilton, State StatisticianMountain Region, Utah Agricultural StatisticsUtah Annual Bulletin, 2019USDA, National Agricultural Statistics Service1
Table of ContentsIntroduction. 1Table of Contents .2-3Utah Department of Agriculture and Food 2019 Annual Summary Report . 4Message from the Commissioner . 5About the Utah Department of Agriculture and Food . 6UDAF Divisions . 7Animal Industry .8-9Plant Industry . 10-11Food and Produce Safety . 12-14Chemistry Laboratory . 15Conservation . 16Office of the Commissioner . 17-18Utah Rankings & RecordsRank & Quantity Produced, Selected Commodities – Utah, Leading State, & United States: 2018 . 20Record Highs & Lows: Acreage, Yield, & Production of Crops – Utah . 21Record Highs & Lows: Livestock, Poultry, Honey, & Mink – Utah . 22Census of AgricultureCensus of Agriculture: Producer & Farm Characteristics of Veterans, Young Producers, & New & Beginning Producers – Utah: 2017 . 23Census of Agriculture: Producer Demographics – Utah: 2017 . 24Farmland DataNumber of Farms, Land in Farms, & Average Farm Size – Utah & United States: 2009-2018 . 25Number of Farms by Economic Sales Class – Utah: 2009-2018 . 25Farms: Acres by Economic Sales Class – Utah: 2009-2018 . 25Farm Income: Cash Receipts by Commodity – Utah: 2013-2018 . 26Farm Income Indicators – Utah: 2013-2018 . 27Agricultural Exports: Estimated Value by Commodity Group – Utah: 2013-2018. 28Crop DataAnnual Crop Summary . 29Usual Planting & Harvesting Dates . 29Barley: Area Planted & Harvested, Yield, Production, Price, & Value – Utah: 2009-2018. 30Corn for Grain: Area Planted & Harvested, Yield, Production, Price, & Value – Utah: 2009-2018. 30Corn for Silage: Area Harvested, Yield, & Production – Utah: 2009-2018 . 30Alfalfa Hay: Area Harvested, Yield, Production, Price, & Value – Utah: 2009-2018 . 31Other Hay: Area Harvested, Yield, Production, Price, & Value – Utah: 2009-2018 . 31All Hay: Area Harvested, Yield, Production, Price, & Value – Utah: 2009-2018 . 31Hay Stocks: Position & Month – Utah: 2009-2018. 32Alfalfa Hay: Production & Price – Utah: 2009-2018 . 32Oats: Area Planted & Harvested, Yield, Production, Price, & Value – Utah: 2009-2018 . 32Safflower: Area Planted & Harvested, Yield, Production, Price, & Value – Utah: 2009-2018 . 32Winter Wheat: Area Planted & Harvested, Yield, Production, Price, & Value – Utah: 2009-2018 . 33Other Spring Wheat: Area Planted & Harvested, Yield, Production, Price, & Value – Utah: 2009-2018 . 33All Wheat: Area Planted & Harvested, Yield, Production, Price, & Value – Utah: 2009-2018 . 33Barley Stocks: Located Off Farm by Quarter – Utah: 2010-2019. 34Corn Stocks: Located Off Farm by Quarter – Utah: 2010-2019 . 34Oat Stocks: Located Off Farm by Quarter – Utah: 2010-2019 . 34Wheat Stocks: Located Off Farm by Quarter – Utah: 2010-2019 . 34Fruit & Vegetable DataApples: Acreage, Yield, Production, Price, & Value – Utah: 2009-2018 . 35Apricot: Acreage, Yield, Production, Price, & Value – Utah: 2010-2018 . 35Sweet Cherry: Acreage, Yield, Production, Price, & Value – Utah: 2010-2018 . 35Tart Cherries: Acreage, Yield, Production, Price, & Value – Utah: 2010-2018 . 36Peaches: Acreage, Yield, Production, Price, & Value – Utah: 2009-2018 . 362Utah Annual Bulletin, 2019USDA, National Agricultural Statistics Service
Table of Contents (Continued)Livestock DataOperations: All Cattle & Calves – Utah: 2007, 2012, & 2017 . 37Operations with Beef Cows – Utah: 2007, 2012, & 2017. 37Operations with Milk Cows – Utah: 2007, 2012, & 2017 . 37Operations with Sheep or Lambs – Utah: 2007, 2012, & 2017 . 37Operations with Hogs & Pigs – Utah: 2007, 2012, & 2017 . 37Cattle & Calves: Number by Class & Calf Crop – Utah: January 1, 2015-2019 . 38Cattle & Calves: Balance Sheet – Utah: 2014-2018 . 38Cattle & Calves: Production, Marketings, & Income – Utah: 2014-2018 . 38Dairy: Milk Production & Milkfat – Utah: 2014-2018 . 39Milk & Cream: Marketings, Used on Farm, Income, & Value – Utah: 2014-2018 . 39Manufactured Dairy Products – Utah: 2014-2018 . 39Milk Cows: Production by Month – Utah: 2016-2018 . 40Commercial Cattle Slaughter – Utah: Monthly 2017 & 2018. 40Hogs & Pigs: Total Breeding & Market Inventory, Farrowings, Pigs per Litter, Pig Crop, & Marketings – Utah: December 1, 2009-2018 . 41Hogs & Pigs: Balance Sheet – Utah: 2014-2018 . 41Market Hogs & Pigs: Inventory by Weight Group – Utah: December 1, 2009-2018 . 41Hogs & Pigs: Production, Marketings, & Income – Utah: 2009-2018. 42Commercial Hog Slaughter – Utah: Monthly 2017 & 2018 . 42Sheep & Lambs: Inventory by Class & Lamb Crop – Utah: January 1, 2015-2019 . 43Wool: Production & Value – Utah: 2014-2018 . 43Sheep & Lamb: Lamb Crop, Farm Slaughter, & Death Loss – Utah: 2010-2019. 43Sheep & Lamb Losses – Utah: 2013-2018 . 44-47Layers & Eggs – Utah: 2014-2018 . 48Turkey: Production & Value – Utah: 2012-2018 . 48Mink: Pelts Produced, Females Bred, Average Price, & Value – Utah & United States: 2009-2018 . 49Pelts Produced in 2018 & Females Bred for 2019, by Type – Utah & United States: . 49Honey: Number of Colonies, Yield, Production, Stocks, Price, & Value – Utah: 2009-2018 . 50Trout: Total Value of Fish Sold & Foodsize Sales – Utah: 2009-2018 . 50Prices ReceivedMarketing Year Average Prices, by Commodity – Utah: 2010-2018 . 51Prices Received: Monthly Averages by Selected Commodities – Utah: 2009-2018 . 52-53Farm Labor: Number Hired, Wage Rates, & Hours Worked – Mountain II Region: July 2018, October 2018, January 2019, & April 2019 . 54Grazing Fees: Annual Average Rates – Utah: 2009-2018 . 54County EstimatesCounty Estimates: Select Items & Years – Utah . 55-56County Estimates: Alfalfa & Alfalfa Mixtures for Hay, All Cropping Practices – Utah: 2017 & 2018 . 57County Estimates: Cattle – Utah: January 1, 2018 & 2019. 58County Estimates: Sheep – Utah: January 1, 2018 & 2019 . 59County Estimates: Cash Rent per Acre – Utah: 2018 & 2019 . 60Enterprise BudgetsSouthern Utah 110 Head Cow/Calf Budget with Winter Feeding . 61Southern Utah 110 Head Cow/Calf Budget with Winter Grazing . 62Southern Utah Alfalfa Budget-100 Acres . 63Northern Utah Roundup Ready Corn Grain Budget-250 Acres . 64Northern Utah Alfalfa Budget-100 Acres . 65Central Utah Cow/Calf Budget-96 Head . 66Northern Utah Cow/Calf Budget-100 Head. 67Peony Cut Flower Budget for One High Tunnel . 68Enterprise Budget Peony Cut Flower, in High Tunnel (Years 4-20) . 69Enterprise Budget Red Peppers with Shade. 70Red Bell Pepper with Shade Enterprise Budget for 1 Acre . 71Red Bell Pepper with Shade Enterprise Budget for 100 ft. Row . 72Utah Counties and Districts Map . 73Utah Annual Bulletin, 2019USDA, National Agricultural Statistics Service3
4Utah Annual Bulletin, 2019USDA, National Agricultural Statistics Service
Utah Annual Bulletin, 2019USDA, National Agricultural Statistics Service5
Place Holder!6Utah Annual Bulletin, 2019USDA, National Agricultural Statistics Service
Utah Annual Bulletin, 2019USDA, National Agricultural Statistics Service7
Place Holder!8Utah Annual Bulletin, 2019USDA, National Agricultural Statistics Service
Place Holder!Utah Annual Bulletin, 2019USDA, National Agricultural Statistics Service9
10Utah Annual Bulletin, 2019USDA, National Agricultural Statistics Service
Place Holder!Utah Annual Bulletin, 2019USDA, National Agricultural Statistics Service11
Place Holder!12Utah Annual Bulletin, 2019USDA, National Agricultural Statistics Service
Place Holder!Utah Annual Bulletin, 2019USDA, National Agricultural Statistics Service13
14Utah Annual Bulletin, 2019USDA, National Agricultural Statistics Service
Utah Annual Bulletin, 2019USDA, National Agricultural Statistics Service15
16Utah Annual Bulletin, 2019USDA, National Agricultural Statistics Service
Utah Annual Bulletin, 2019USDA, National Agricultural Statistics Service17
Place Holder!18Utah Annual Bulletin, 2019USDA, National Agricultural Statistics Service
Utah Annual Bulletin, 2019USDA, National Agricultural Statistics Service19
Rank & Quantity Produced, Selected Commodities – Utah, Leading State, & United States: 2018CommodityUtahUnitField CropsBarley .(1,000 Bu)Corn, Grain .(1,000 Bu)Corn, Silage . (1,000 Tons)Hay, All . (1,000 Tons)Hay, Alfalfa. (1,000 Tons)Hay, Other . (1,000 Tons)Safflower Production . (1,000 Lbs)Wheat, All 1 .(1,000 Bu)Wheat, Other Spring .(1,000 Bu)Wheat, Winter .(1,000 Bu)FruitsPeach Production . (Tons)Tart Cherry Production . (Mil Lbs)Livestock 2RankLeading North DakotaNorth 732,050353All Cattle & Calves . (1,000 Head)All Cows 3. (1,000 Head)Calf Crop . (1,000 Head)Beef Cows 3 . (1,000 Head)Milk Cows 3 . (1,000 Head)Milk Production . (Mil Lbs)All Chickens (Excl Broilers) . (1,000 Head)Layers on Hand Dec. 1 . (1,000 Head)Egg Production 4 . (Mil Eggs)All Hogs & Pigs . (1,000 Head)Breeding Hogs & Pigs . (1,000 Head)Pig Crop 4 . (1,000 Head)Market Hogs & Pigs . (1,000 Head)Honey Production . (1,000 Lbs)All Sheep & Lambs . (1,000 Head)Breeding Sheep & Lambs(1,000 Lambs)Lamb Crop . (1,000 Head)Market Sheep & Lambs . (1,000 Head)Wool Production . (1,000 Lbs)Trout Sold . (1,000 a80Iowa1,334Iowa630Iowa1,066North Dakota290Texas260Texas235Texas30California2,220 California, 2,3485,2303,8203,2351,41024,40099,969Farms . (Number)Land in Farms . (1,000 Acres)Average Size of Farm . 8,800 070,966142,800236,380363,483 1,884,458318,010623,232277,400 1,183,9391Excludes Durum wheat for Utah.Inventory January 1, 2019 for cattle & sheep; December 1, 2018 for hogs & chickens.3Cows & heifers that have calved.4Pig crop & egg production for the marketing Year December 1, 2017-November 30, 2018.220Utah Annual Bulletin, 2019USDA, National Agricultural Statistics Service
Record Highs & Lows: Acreage, Yield, & Production of Crops – UtahUnitsRecord High(Quantity)Corn for GrainHarvested . (1,000 Acres)Yield . (Bushels/Acre)Production .(1,000 Bushels)Corn for SilageHarvested . (1,000 Acres)Yield . (Tons/Acre)Production . (1,000 Tons)BarleyHarvested . (1,000 Acres)Yield . (Bushels/Acre)Production .(1,000 Bushels)OatsHarvested . (1,000 Acres)Yield . (Bushels/Acre)Production .(1,000 Bushels)All WheatHarvested . (1,000 Acres)Yield . (Bushels/Acre)Production .(1,000 Bushels)Other Spring WheatHarvested . (1,000 Acres)Yield . (Bushels/Acre)Production .(1,000 Bushels)Winter WheatHarvested . (1,000 Acres)Yield . (Bushels/Acre)Production .(1,000 Bushels)All HayHarvested . (1,000 Acres)Yield . (Tons/Acre)Production . (1,000 Tons)Alfalfa HayHarvested . (1,000 Acres)Yield . (Tons/Acre)Production . (1,000 Tons)Other HayHarvested . (1,000 Acres)Yield . (Tons/Acre)Production . (1,000 Tons)SafflowerHarvested . (1,000 Acres)Yield . (Tons/Acre)Production . (1,000 Tons)ApplesUtilized Prod. . (Million Lbs)ApricotsUtilized Prod. . (Tons)Peaches (Freestone)Utilized Prod. . (Tons)Sweet CherriesUtilized Prod. . (Tons)Tart CherriesUtilized Prod. . (Million Lbs)Utah Annual Bulletin, 2019USDA, National Agricultural Statistics ServiceRecord Low(Year)(Quantity)Record 63, 1966188919341882188218828025.01,5011975, 19762011, 8285.03,33819102002, 20151914225.017020151882, 1,1391880, 18811919188218791879187911965.03,3661919, 909190919095804.402,42020111993, 1998, 2,94020102014
20 Utah Annual Bulletin, 2019 USDA, National Agricultural Statistics Service Rank & Quantity Produced, Selected Commodities - Utah, Leading State, & United States: 2018 Commodity Unit

