Transcription
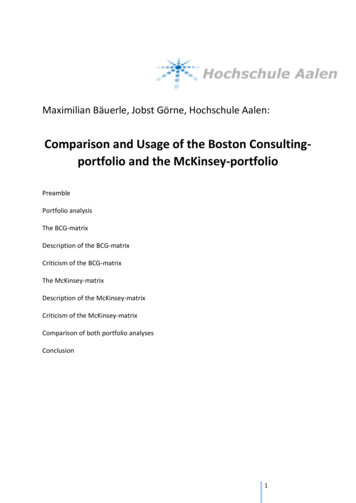
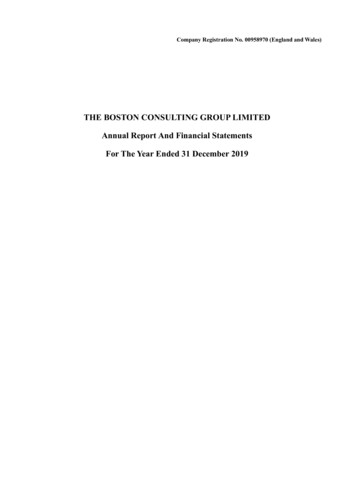
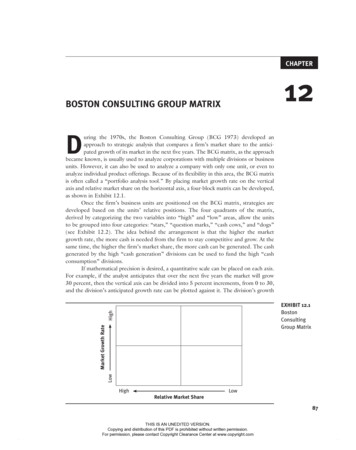
CHAPTER12BOSTON CONSULTING GROUP MATRIXDuring the 1970s, the Boston Consulting Group (BCG 1973) developed anapproach to strategic analysis that compares a firm’s market share to the anticipated growth of its market in the next five years. The BCG matrix, as the approachbecame known, is usually used to analyze corporations with multiple divisions or businessunits. However, it can also be used to analyze a company with only one unit, or even toanalyze individual product offerings. Because of its flexibility in this area, the BCG matrixis often called a “portfolio analysis tool.” By placing market growth rate on the verticalaxis and relative market share on the horizontal axis, a four-block matrix can be developed,as shown in Exhibit 12.1.Once the firm’s business units are positioned on the BCG matrix, strategies aredeveloped based on the units’ relative positions. The four quadrants of the matrix,derived by categorizing the two variables into “high” and “low” areas, allow the unitsto be grouped into four categories: “stars,” “question marks,” “cash cows,” and “dogs”(see Exhibit 12.2). The idea behind the arrangement is that the higher the marketgrowth rate, the more cash is needed from the firm to stay competitive and grow. At thesame time, the higher the firm’s market share, the more cash can be generated. The cashgenerated by the high “cash generation” divisions can be used to fund the high “cashconsumption” divisions.If mathematical precision is desired, a quantitative scale can be placed on each axis.For example, if the analyst anticipates that over the next five years the market will grow30 percent, then the vertical axis can be divided into 5 percent increments, from 0 to 30,and the division’s anticipated growth rate can be plotted against it. The division’s growthLowMarket Growth RateHighEXHIBIT 12.1BostonConsultingGroup MatrixHighLowRelative Market Share87THIS IS AN UNEDITED VERSION.Copying and distribution of this PDF is prohibited without written permission.For permission, please contact Copyright Clearance Center at www.copyright.comMcDonaldWayland.indd 879/2/15 12:20 AM
88Strategic Analysis for HealthcareStarsHighEXHIBIT 12.2Four Quadrantsof the BCGMatrixQuestion MarksMarket Growth Rate? ?LowCash CowsHighDogs?LowRelative Market Sharerate would be presented as the division exists today, before any strategic intervention.The market share axis would be shown as a logarithmic scale. This scale would indicatethe market share of a division relative to the market share of the largest competitor in itsmarket. For example, Company A may have a 5 percent market share, and the leadingcompetitor, Company B, has a 20 percent market share. Company A’s market share relative to Company B’s market share is 25 percent, or .25 . Alternatively, if Company A hasa 20 percent market share and Company B has a 5 percent market share, Company A’smarket share relative to Company B’s is 400 percent, or 4.0 .The ideal movement for a company, division, or product is to move from dog toquestion mark to star to cash cow. A dysfunctional movement would go in the reversedirection. New products often start in the question mark box. They are introduced intowhat is anticipated to be a high-growth market but have not generated much cash yet.Time will tell if they move into the star box or the dog box.A health-related example can be seen in the eye care industry, in the optical dispensary that sells specific products to consumers. Imagine a provider seeks to increasesales in sports vision, which is currently in the dog category. The provider sees a specificneed in the community, due to recent sports-related ocular injuries, and starts to educatethe public on the need to wear sports eyewear. A combined marketing approach helpsmove sports vision from dog to question mark, and the unit then shows movement intothe star category.The following sections examine dogs, question marks, stars, and cash cows ingreater detail.DogsDogs are divisions that are not doing well. They have low market share in markets thathave low growth. Generally, they tend to neither draw much cash from the parent company nor generate much cash—although sometimes they will require a corporation’s cashTHIS IS AN UNEDITED VERSION.Copying and distribution of this PDF is prohibited without written permission.For permission, please contact Copyright Clearance Center at www.copyright.comMcDonaldWayland.indd 889/2/15 12:20 AM
C hap ter 12: Boston C onsulting G rou p M a t ri x89in order to remain in business. At best, dogs are not adding significant value; at worst,they are drawing off cash and management’s time and attention. Therefore, the typicalstrategies for dogs seek to turn them around and move them toward the question markbox, to divest them, or to shut them down. However, a firm may have strategic reasonsfor keeping a dog. In the eyewear example above, a niche exists for sports protection; evenif positive movement is not seen, the firm may be wise to continue to offer products in,although not focus on, this category.Question MarksQuestion marks are divisions that have low market share in markets that are growing.Because the market is growing, question marks tend to require cash for continued competition. Rather than being net cash generators, question marks tend to draw off a corporation’s cash. In these cases, the strategic approach is not clear—hence the term questionmark. If the strategist sees potential to grow the division’s market share and move the division into the star box, strategies may include product development, market penetration,market development, and other growth strategies. If the analyst does not see the potentialto improve the division, or if the company does not have the cash to invest in the unit,divestiture may be an option.StarsStars are divisions that have high market share in markets that are growing rapidly. Thesebusinesses generate excitement. They also generate a lot of cash due to their high marketshare. At the same time, they require significant cash to fuel their continued growth inthe rapidly expanding market and to fend off competitors who wish to take away theirmarket share. The cash the stars generate usually tends to net out. In that sense, theyare similar to dogs, but they continue to have huge upside. Strategic approaches includecontinuing to fuel the growth and expand market share through market penetrationand market development, product development, integration strategies, and even jointventures. Defensive moves intended to maintain the large market share are also considered. If a star maintains its dominant market share as the market life cycle matures, itmoves into the cash cow category; at this point, other competitors drop out and the starrequires less cash to fuel the strong financial results. However, if a star fails to maintainits share, it degrades into a dog.Cash CowsCash cows have a dominant market share in markets that are not growing significantly.Because market domination tends to correlate with pricing power, they have significantprofit margins. In addition, they require only limited cash investment due to the market’s lower growth, meaning they generate significantly more cash than they consume.Strategies for cash cows involve continuing to support the division without having toTHIS IS AN UNEDITED VERSION.Copying and distribution of this PDF is prohibited without written permission.For permission, please contact Copyright Clearance Center at www.copyright.comMcDonaldWayland.indd 899/2/15 12:20 AM
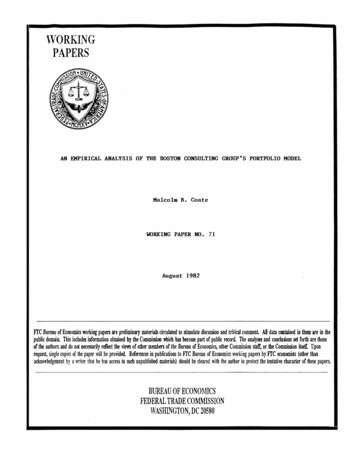
90Strategic Analysis for HealthcareStarsHighEXHIBIT 12.3BCG Matrix forCompany XQuestion MarksMarket Growth RateDivision2Division 1LowDivision 3Cash CowsHighDogsLowRelative Market Shareinvest significant cash, then using the cash generated to reinvest in turning around dogsor moving question marks into stars.When divisions are placed on the BCG matrix, they are indicated by a circle. Usually, the size of each circle indicates the relative significance of each business unit to theorganization in terms of cash generated (see Exhibit 12.3). Alternatively, the circles couldbe the same size but with pie slices in each. The pie slice would be shaded to show therelationship between the cash generated by that division (the slice) and the whole.The BCG matrix allows a quick visualization of a company’s portfolio relative tomarket share, market growth, size of cash contribution, and relative strength or weakness. The matrix can also be used to show a target company and its position relative toits competitors, by placing the company on the matrix and then placing the competitorsappropriately. The BCG matrix is the first analysis tool we have seen that begins to suggeststrategy in addition to simple analysis.ReferenceBoston Consulting Group (BCG). 1973. “The Experience Curve—Reviewed.” Accessed August17, 2015. www.bcg.com/documents/file13904.pdf.THIS IS AN UNEDITED VERSION.Copying and distribution of this PDF is prohibited without written permission.For permission, please contact Copyright Clearance Center at www.copyright.comMcDonaldWayland.indd 909/2/15 12:20 AM
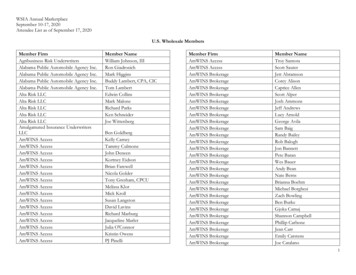
C hap ter 12: Boston C onsulting G rou p M a t ri xFor your project company, review the previous analyses and develop a BCG matrix. Plot all thedivisions or business units of your organization.EXERCISELowMarket Growth RateHighBCG Matrix for91HighLowRelative Market ShareTHIS IS AN UNEDITED VERSION.Copying and distribution of this PDF is prohibited without written permission.For permission, please contact Copyright Clearance Center at www.copyright.comMcDonaldWayland.indd 919/2/15 12:20 AM
BOSTON CONSULTING GROUP MATRIX . D. uring the 1970s, the Boston Consulting Group (BCG 1973) developed an approach to strategic analysis that compares a firm’s market share to the antici-pated growth of its marke