Transcription
Variable Decelerations: How tointerpret them and what to doabout themM. Sean Esplin, MD and Alexandra Eller, MDMaternal Fetal MedicineIntermountain HealthcareUniversity of Utah Health Sciences Center
Goals Describe the process of interpretingvariable decelerations in the clinical setting Review appropriate interventions Apply this knowledge to difficult tracings
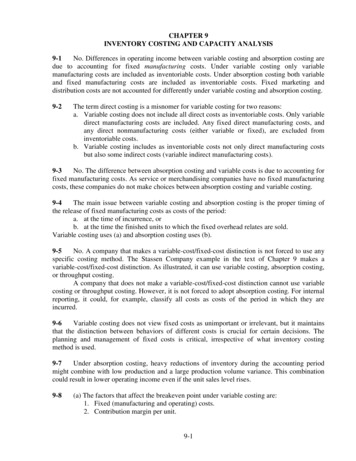
Most CommonFHR TracingCombinationsMaking UpCategory IIHolmgren et. al, Abstract 669, SMFM 2010
Definition of Variable Decelerations Visually apparent abrupt decrease Onset of deceleration to low point 30 seconds in the fetalheart rate below baseline at least 15 beats lasting between 15 seconds to 2 minutes. The timing of onset and return to baseline in relationto the contraction is variable Timing with respect to contractions is also variable Early position With contractions Ate position or not associated with contractions
Variable DecelerationsCauses Cord prolapse Oligohydramnios True knot or short cordNuchal cordUnspiraled cordDecreased Wharton’sjellyThin cord Second stage of labor Maternal position Fetal position – cordaround body Monoamnioticmultiple gestation
Keys for Interpretation ofVariable Decelerations What is the clinical setting Some babies may be starting fromrelative hypoxia
Hypoxemia affecting the arterial blood Initial phase of oxygen deficiency Oxygen saturation of arterial blood decreases Cell and organ functions remain intact Enhanced uptake of oxygen from circulating blood Reduced level of activity Decreases energy requirement and need for oxygen May Continue for extended time Results in growth restrictionOxygenHypoxemiaDays and WeeksTime
Hypoxia affecting peripheral tissues More defense mechanisms to maintain balance Oxygen saturation of tissues decreases Surge in stress hormones and decreased peripheral flow Redistribution of blood to brain, heart and adrenals Anaerobic metabolism is initiated in peripheral tissues Fetus can tolerate if oxygen maintained in centralorgans May Continue for only hoursOxygenHypoxemiaHypoxiaDays and WeeksHoursTime
Asphyxia affecting the central organs Fetal adaptations to hypoxia fail Maximal activation of sympathetic nervous system Stress hormones Anaerobic metabolism begins in central organs Fetus uses glycogen stores from liver and heart Metabolic acidosis occurs in central organs Major organ failure/damage Tolerated for only minutesOxygenHypoxemiaHypoxiaAsphyxiaDays and WeeksHoursMinutesTime
Keys for Interpretation ofVariable Decelerations What is the clinical setting Some babies may be starting from relativehypoxia IUGR Oligohydramnios Preeclampsia Hypertension IDDM Infection
Keys for Interpretation ofVariable Decelerations Clinical setting Presence of other concerning features –especially features that suggest thepresence of hypoxia Tachycardia Minimal or absent variability Absence of accelerations
Keys for Interpretation ofVariable Decelerations Clinical setting Evidence of hypoxia Concerning characteristics about the variable itself Are there some types of variables that are moreconcerning than others? Atypical shape Depth Duration
Variable Decelerations Reassuring characteristics Duration 60 seconds Rapid return to baseline Normal baseline rate and variability Non-reassuring characteristics Prolonged return to baseline Presence of overshoots 20 BPM above the baseline for 20 seconds Tachycardia Absence of baseline variability Persistent to 60 bpm and lasting 60 secondsKrebs et al. 1983
Variable DecelerationsDo Size and Shape Matter? Last 4 hours of tracing compared for 3groups Normal (N) – 3,320 babies with normal BD Metabolic acidemia (MA) – 316 with BD 12 mmol/L Abnormal (Ab) – 59 babies with abnormalgas and neonatal courseHamilton, et al. J Matern Fetal Neonatal Med. 2012 Jun;25(6):648-53
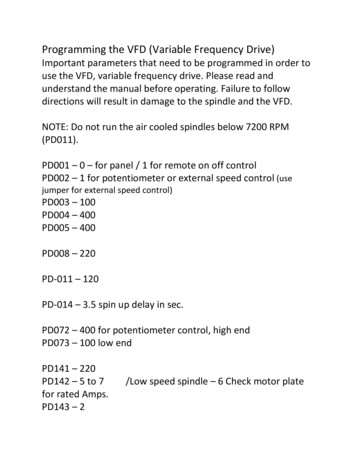
Lower baselineafter thedecelerationSixtiesBaseline value after thedeceleration is at least 15 bpmlower than the baseline valueimmediately preceding it.The deceleration meets two of thefollowing:-Duration is 60 seconds or longer-Lowest value is 60 bpm or lower-Depth is 60 or more bpm
ProlongedBiphasic shapeThe deceleration lasts 120 secondsThe deceleration demonstrates atrough-peak-trough sequencewhere the peak is prominent,lasting at least 10 seconds ormore than 20% of thedeceleration duration.
Prolonged secondaryriseOvershootSlow return tobaselineThe first 20 seconds after adeceleration contains a smoothrise greater than 10 secondsover the baseline.The time to return fromnadir is twice the time tofall to the nadir and lasts60 seconds or more.
Loss of internalvariabilityBoth the size and number ofoscillations of the fetal heartrate within a deceleration issmall given the length of thedeceleration outline.Loss of rise inheart ratebefore and afterdecelerationAbsent fetal heart rateincreases before and after thedeceleration region, consideringexpected variations givenambient baseline variability.
Atypical variables including the sixties, loss of internal variability and prolonged durationWere associated with Metabolic Acidemia and Abnormal neonatal outcomes
Variable DecelerationsSignificance of Atypical Features Goal - estimate the incidence of atypical FHRdeceleration characteristics in term labor and theirassociation with acidemia 5-year retrospective cohort study All singleton, Non-anomalous gestations 37 weeks gestation Last 30 minutes of monitoring interpreted by twoformally trained research nursesCahill, et al. OB GYN vol 120(6) Dec 2012
Variable Decelerations Features analyzed Overshoot – gradual acceleration after adeceleration Gradual, smooth shape lasting 60-90seconds Usually increase 10-20 bpmCahill, et al. OB GYN vol 120(6) Dec 2012
Variable Decelerations Features analyzed Shoulders – acceleration before or afterdeceleration 20 bpm and lasts 20 secondsCahill, et al. OB GYN vol 120(6) Dec 2012
Variable Decelerations Slow return - any recovery fromnadir to baseline that was 30seconds or greater longer thanduration of onset to nadirCahill, et al. OB GYN vol 120(6) Dec 2012
Variable Decelerations Features analyzed Presence of variability within the decelerationCahill, et al. OB GYN vol 120(6) Dec 2012
Variable Decelerations 5,388 tracings were evaluated 50 had acidemia (pH 7.10 and BD -8.0) 5,063 had no acidemiaCahill, et al. OB GYN vol 120(6) Dec 2012
Variable DecelerationsCahill, et al. OB GYN vol 120(6) Dec 2012
Variable Decelerations 5,388 tracings were evaluated 50 had acidemia (pH 7.10 and BD -8.0) 5,063 had no acidemia No association between variable features andacidemia Shoulders (adjusted odds ratio [OR] 1.06, 95% confidenceinterval [CI] 0.63-1.81) Slow returns (adjusted OR 0.91, 95% CI 0.54-1.53) Minimal variability (adjusted OR 0.82, 95% CI 0.43-1.55) nor Marked Variability(adjusted OR 0.65, 95% CI 0.27-1.55)Cahill, et al. OB GYN vol 120(6) Dec 2012
Variable Decelerations What is the significance of depth and duration of variabledecelerations? NICHD Consensus states undetermined One study compared depth and duration to fetal pulseoxygenation data 620 infants with variable decelerations and concomitant fetalpulse ox Compared the 2 minutes before, deepest point, recoveryphase and 2 minutes after deceleration Significantly lower levels of fetal oxygenation at the momentof greatest decrease in heart rate and during recovery phasePuertas et al. Int J Gyn OB 2004
Variable DecelerationsSeverityDuration ofdeceleration 30 seconds 60 secondsAny durationAbsolute depth of nadirModerate30-60 seconds 60 seconds 70 bpm nadir70-80 bpm nadirSevere 60 seconds 70 bpm nadirMildAny depth70-80 bpm nadir 80 bpm nadir
Variable decelerationsDepth of variables Baseline does not drop below 55-60 bpmduring variable Full activation of the parasympatheticnervous system is similar to complete fetalheart block 50-60 bpm is the typical rate of ventricularrate set by the AV node If the heart rate is below 50 bpm thinkhypoxia
Diagnostic Accuracy of EFM Retrospective study Cases (39) had HIE Controls (78) normal pH 3 reviewers read last hour of tracing Assigned characteristics and categories Calculated the debt 30 and debt 60 ½(width x depth of variables) essentiallyhow long and severe are the variablesGraham, et al. Obstet Gynecol 2014 Sept
Oxygen Debt½ x height x duration Oxygen debt
Evolving Fetal CompromiseRecurrent variable/late decelerationsProgressively deeper decelerationsReflexive fetal tachycardia ( /-)Progressive reduction in variability moderateto minimal to absentTerminal bradycardiaParer JT Matern Fetal Neonatal Med 2006; 19:289-94
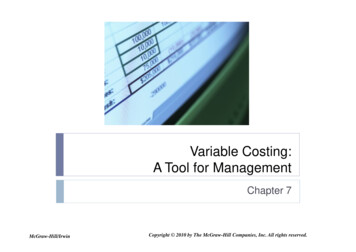
Repetitive Cord OcclusionFrequency of Decelerations Near term fetal sheep – exposed to cordocclusion Mild – 1 minute occlusion every 5 minutes Moderate – 1 minute occlusion every 3minutes Severe – 1 minute of occlusion every 2minutes Continuous measurement of base deficit (BD)as a marker of metabolic acidosisFrasch, MG, et al. AJOG 2009;200:200
Deceleration Fetal sheep cord occlusion studies 1:5 occlusion series – 1 minutes occlusion every 5minutes Onset of each occlusion was accompanied by avariable FHR deceleration, with rapid return tobaseline levels Small fall in pH and a rise in BD and lactate occurredin the first 30 minutes of occlusions (pH, 7.34 0.07; BD, 1.3 3.9 mmol/L; lactate, 4.5 1.3 mmol/L) Values remained stable, despite a further 3.5 hours ofocclusions
Deceleration 1:2.5 occlusion series – 1 minutes occlusionevery 2.5 minutes Rapid occlusion frequency provided only abrief period of recovery between occlusions After 1 hour All animals had a severe metabolicacidosis, with pH 6.92 0.03; BD, 19.2 1.5 mmol/L, and lactate 14.6 0.8 mmol/Lby the end of the occlusions
1:5 Occlusion Group1:2.5 Occlusion Group
Repetitive Cord Occlusion The rate of BD decline was similar for mild,moderate and severe occlusion periods BD drops at rate of 0.56 mmol/L for everyminute of cord occlusion Recovery is much slower 0.09 mmol/L per minute over the first 2hours of recovery
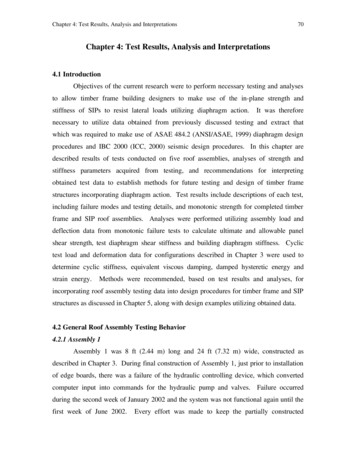
Repetitive Cord OcclusionDepth of Decelerations Near term fetal sheep – exposed to cord occlusion Mild – 30 bpm decrease in FHR Moderate – 60 bpm decrease in FHR Severe – 90 bpm decrease to baseline 70 bpm 1:2.5 occlusion series – 1 minutes occlusion every 2.5minutes for 1 hour at each severity Continuous measurement of base deficit (BD) as amarker of metabolic acidosisRoss, MG, et al. AJOG 2013;208:285
Repetitive Cord OcclusionDepth of DecelerationRoss, MG, et al. AJOG 2013;208:285
Repetitive Cord OcclusionDepth of Deceleration Increase in fetal base deficit Mild – 0.21 0.03 mEq/L per minute Moderate – 0.27 0.03 mEq/L per minute Severe – 0.54 0.09 mEq/L per minute During recovery fetal base deficit cleared ata rate of 0.12 0.03 mEq/L per minuteRoss, MG, et al. AJOG 2013;208:285
Repetitive Cord OcclusionDepth of DecelerationRoss, MG, et al. AJOG 2013;208:285
Repetitive Cord OcclusionHypoxic Fetuses Near term fetal sheep Normal fetus – normal SaO2 55% Hypoxic fetuses – SaO2 55% Exposed to cord occlusion Mild – 30 bpm decrease in FHR Moderate – 60 bpm decrease in FHR Severe – 90 bpm decrease to baseline 70 bpm 1:2.5 occlusion series – 1 minutes occlusion every 2.5 minutes for 1hour at each severity Continuous measurement of base deficit (BD) as a marker of metabolicacidosisAmaya, KE et al. AJOG 2016;214:270
Repetitive Cord OcclusionHypoxic FetusesDuring recovery, hypoxic fetuses cleared fetalbase deficit at a slower rate compared tonormal fetuses (0.12 0.03 mEq/L per minuteversus 0.08 0.03\2 mEq/L per minute)Amaya, KE et al. AJOG 2016;214:270
Timecourse to Acidemia With minimal/absent variability and recurrentdecelerations, acidemia evolves over 60’ In the setting of a previously normal tracing Can occur more quickly with acute events Abruption, uterine rupture, cord prolapse Sudden and profound fetal bradycardiaParer JT Matern Fetal Neonatal Med 2006; 19:289-94Low JA Obstet Gynecol 1999;93:85-91Williams KP Am J Obstet Gynecol 2003;188:820-3Eilimian A Obstet Gynecol 1997;89:373-6Clark S Am J Obstet Gynecol 1982
Interventions for VariableDecelerations Reposition the patient Perform a cervical exam Cord prolapse Rapid labor progress Consider internal monitors Slow the contractions Reposition Fluid bolus Stop or decrease the pitocin Stop pushing
Interventions for VariableDecelerations Contact the attending provider Risk factors – infection, VBAC Recurrent Severe Unresponsive to interventions Consider amnioinfusion
Amnioinfusion for VariableDecelerations Meta-analysis of 12 randomized controlledtrials Amnioinfusion vs. expectant management Rate of decelerations – RR 0.54; 95%CI 0.43-0.68 Rate of cesarean for distress - RR 0.35; 95%CI 0.24-0.52
Conclusion In order to appropriately interpret variablesyou must consider: Clinical setting Presence of concerning findings Tachycardia or minimal/absent variability Frequency - 3 minutes apart if too much Depth and duration – 60x60 How long until delivery Will they resolve?
Variable Decelerations What is the significance of depth and duration of variable decelerations? NICHD Consensus states undetermined One study compared depth and duration to fetal pulse oxygenation data 620 infants with variable decelerations and concomitant fetal pulse ox Compared the 2 minu