Transcription
Acta Psychologica 160 (2015) 58–68Contents lists available at ScienceDirectActa Psychologicajournal homepage: www.elsevier.com/ locate/actpsyFrom junior to senior Pinocchio: A cross-sectional lifespan investigationof deceptionEvelyne Debey a, Maarten De Schryver a, Gordon D. Logan b, Kristina Suchotzki a, Bruno Verschuere a,c,d,⁎aFaculty of Psychology and Educational Sciences, Department of Experimental–Clinical and Health Psychology, Ghent University, Ghent, BelgiumDepartment of Psychology, Vanderbilt University, Nashville, USAFaculty of Social and Behavioural Sciences, Department of Clinical Psychology, University of Amsterdam, Amsterdam, The NetherlandsdFaculty of Psychology and Neuroscience, Maastricht University, Maastricht, The Netherlandsbca r t i c l ei n f oArticle history:Received 14 January 2015Received in revised form 23 June 2015Accepted 29 June 2015Available online 13 July 2015Keywords:DeceptionLifespanExecutive controlResponse inhibitionDevelopmentReaction timesa b s t r a c tWe present the first study to map deception across the entire lifespan. Specifically, we investigated age-relateddifference in lying proficiency and lying frequency. A large community sample (n 1005) aged between 6and 77 were surveyed on their lying frequency, and performed a reaction-time (RT) based deception task to assess their lying proficiency. Consistent with the inverted U-shaped pattern of age-related changes in inhibitorycontrol that we observed in a stop signal task, we found that lying proficiency improved during childhood (in accuracy, not RTs), excelled in young adulthood (in accuracy and RTs), and worsened throughout adulthood (in accuracy and RTs). Likewise, lying frequency increased in childhood, peaked in adolescence, and decreased duringadulthood. In sum, we observed important age-related difference in deception that generally fit with the Ushaped pattern of age-related changes observed in inhibitory control. Theoretical and practical implications arediscussed from a cognitive view of deception. 2015 Elsevier B.V. All rights reserved.1. Introduction1.1. Executive control and lyingThe ubiquity of lies in everyday life does not imply that lying ischild's play. Research has shown that lying considerably challengesour cognitive capacities (Vrij & Granhag, 2012; Walczyk, Igou, Dixon,& Tcholakian, 2013). The cognitive load that accompanies lying is, forinstance, reflected in slower response times and a higher number oferrors, compared to truth telling (i.e., lie effects; e.g., Van Bockstaeleet al., 2012; Williams, Bott, Patrick, & Lewis, 2013; but see Suchotzki,Verschuere, Crombez, & De Houwer, 2013). Furthermore, lying evokesmore activity in the prefrontal cortex, a brain region that is cruciallylinked to cognitive or executive control (Abe, 2011; Christ, Van Essen,Watson, Brubaker, & McDermott, 2009; Farah, Hutchinson, Phelps, &Wagner, 2014). Miyake and colleagues distinguished responseinhibition, working memory updating, and shifting as the three mainexecutive functions (Miyake et al., 2000), and several lines of researchsupport the involvement of these functions in lying. Evidence hasbeen found for the notion that the truth response is activated first,thereby inducing response conflict and an increased need for response⁎ Corresponding author at: Faculty of Social and Behavioural Sciences, Department ofClinical Psychology, University of Amsterdam, Amsterdam, The Netherlands.E-mail address: B.J.Verschuere@uva.nl (B. 5.06.0070001-6918/ 2015 Elsevier B.V. All rights reserved.inhibition to prevent the truth from slipping out (Debey, Ridderinkhof,De Houwer, & Verschuere, submitted for publication; Duran, Dale, &McNamara, 2010; Hadar, Makris, & Yarrow, 2012; Vartanian et al.,2013). However, the truth may initially also be kept active in workingmemory to help the formulation of an alternative, deceptive response(Ambach, Stark, & Vaitl, 2011; Debey, De Houwer, & Verschuere, 2014;Visu-Petra, Miclea, & Visu-Petra, 2012). Finally, shifting may help toflexibly shift between the mental sets associated with truthful anddeceptive responses (Visu-Petra, Varga, Miclea, & Visu-Petra, 2013;Visu-Petra et al., 2012).Apart from a few developmental studies in children (b17 years),deception research has largely neglected that executive control issubject to changes throughout life that may give rise to age-relatedchanges in deception skills. The present study addressed this issue bypursuing a first attempt to depict lying proficiency and lying frequencyacross the near entire lifespan (targeted age range: 6–82).1.2. Executive control across lifeThe relationship between age and executive control ability is bestdescribed as an inverted U-curve: Executive control increases acrosschildhood, peaks in late adolescence or young adulthood, and declinesthereafter (for reviews, see Craik & Bialystok, 2006; Jurado & Rosselli,2007; Zelazo, Craik, & Booth, 2004). Several theories have beenproposed to explain the cognitive differences at both ends of life. Thefrontal lobe hypothesis (West, 1996), attributes lifespan differences in
E. Debey et al. / Acta Psychologica 160 (2015) 58–68executive control to specific age-related changes in the frontal lobe, abrain region that is the last to mature and among the first regions todeteriorate during aging (Raz et al., 2005). The global speed hypothesis(Salthouse, 1996), however, states that a general factor — globalprocessing speed — determines the performance levels that can bereached on most cognitive tasks (Bashore & Smulders, 1995). It istherefore imperative to control for global processing speed whenexamining age-related changes in executive control (e.g., Span,Ridderinkhof, & van der Molen, 2004; Williams, Ponesse, Schachar,Logan, & Tannock, 1999).1.3. Response inhibition across lifeResponse inhibition has been proposed to be the executive function that may be at the heart of deception (Spence et al., 2001;Vartanian et al., 2013). We therefore looked more closely intostudies that examined age-related differences in inhibitory control.This literature is characterized by three main limitations. First,whereas some studies controlled for processing speed or — moregeneral — baseline performance (e.g., Rush, Barch, & Braver, 2006;Troyer, Leach, & Strauss, 2006; Van der Elst, Van Boxtel, VanBreukelen, & Jolles, 2006; Williams et al., 1999), others did not(Collette, Germain, Hogge, & Van der Linden, 2009; Davidson,Amso, Anderson, & Diamond, 2006; Schroeter, Zysset, Wahl, & vonCramon, 2004). Second, most studies only examined inhibitory control in a restricted age range (e.g., Bub, Masson, & Lalonde, 2006;Bunge, Dudukovic, Thomason, Vaidya, & Gabrieli, 2002), or investigated lifespan changes in a discontinuous manner by reducing thelifespan to a group of children, young adults, and older adults(e.g., Christ, White, Mandernach, & Keys, 2001; van de Laar, vanden Wildenberg, van Boxtel, & van der Molen, 2011). Third, ashighlighted by Band, van der Molen, and Logan (2003), many studiesare underpowered.A limited number of studies addressed these main limitations. Vander Elst et al. (2006; n 1856; age range: 24–81) and Troyer et al.(2006; n 272; age range: 18–94), administered the Stroop taskthroughout adulthood. In the Stroop task, participants name the inkcolor in which color words are presented. Because naming the word isthe prepotent response, response inhibition is needed on trials wherethe ink color is incongruent with the word name (e.g., GREEN inred; MacLeod, 1991). Both studies showed that the Stroop effects(i.e., incongruent minus congruent) in errors and reaction times (RTs)systematically increased with age. Also in an adult sample (n 304;age range: 20–86), Borella, Carretti, and De Beni (2008) administeredthe Hayling sentence completion test (Burgess & Shallice, 1997), inwhich participants complete high-closed sentences, either with anexpected word (initiation condition) or with a word that is unrelatedto the sentence content (inhibition condition). A comparison of bothconditions showed that with age, participants had more difficulty toinhibit expected words. Williams et al. (1999) administered a globalstop-signal task to 275 participants that were between 6 and 81 yearsold. The stop-signal task requires participants to perform a visual choicereaction-time task, but to withhold their response on an infrequentnumber of trials (e.g., 25%) in which a stop signal occurs shortlyafter presentation of the stimulus (Verbruggen & Logan, 2008). Stopsignal reaction time (SSRT; an estimated time to stop responses)decreased between early childhood and adolescence, and increasedagain thereafter. However, the loss during adulthood was lesspronounced than the gain during childhood. Bedard et al. (2002),examining 317 participants aged 6 to 82, found a more symmetric Ushaped pattern with a modified stop-signal task that required participants to suppress their response in the presence of one signal, but notin the presence of another.In sum, there is some evidence for an age-related inverted U-courseof inhibitory control, yet studies remain restricted in sample size, agerange, and efforts to correct for baseline performance.591.4. Lying ability across lifeFrom the idea that lying depends on executive control, one couldinfer the hypothesis that deception ability will change with age in asimilar vein as the executive functions it relies on. So far, the relationship between age and lying has been primarily examined in studiesthat focused on the development of lying in the age range between 2and 16 years. A common used paradigm to assess children's lying abilityis the temptation resistance paradigm (Lewis, Stanger, & Sullivan, 1989;Talwar & Lee, 2002). In this paradigm, an experimenter asks childrennot to peek at or play with a toy when left alone. Because the situationis very tempting, many children transgress the instruction. Uponreturning, the experimenter asks whether the child has peeked at orplayed with the toy. If the child denies transgression, follow-upquestions (e.g., “What do you think the toy is?”) are asked to assessstrategic lying, that is, the ability to make statements that are consistentwith the initial lie. Performance on the Stroop task predicts the decisionto lie in children between 2 and 8 years, and the sophistication of strategic lies told between 3 and 16 years (Talwar & Lee, 2008).Of interest with regard to the impact of aging on lying skills is a studyof Abe et al. (2009) in which participants with Parkinson's disease andhealthy controls were instructed to lie or tell the truth about recognizing certain items. It was found that patients had more difficulty to lierelative to healthy controls. The finding that this poorer performancein patients was correlated with their prefrontal hypometabolism, pointsto the possibility that the typical deterioration of the frontal lobe in oldage may also hamper lying skills.The observation that executive control ability predicts lying fromthe very first appearances of lies substantiates the idea that executivecontrol is a core component of lying. It is therefore striking thatno research has yet examined lying proficiency across the entirelifespan.1.5. Lying frequency across lifeWe also explored how lying frequency evolves over life. Severalstudies found that people lie on average one to two times a day(DePaulo, Kashy, Kirkenol, Wyer, & Epstein, 1996; Vrij, 2008). Some ofthese studies reported upon how age impacts on lying frequency.Serota, Levine, and Boster (2010; Study 1) surveyed 1000 U.S. adults(aged 18–65 ) how many times they had lied in the past 24 h.Participants lied on average 1.65 a day, and lying frequency decreasedwith aging. The diary study of DePaulo et al. (1996) also found thatyoung adults lie more often than older adults. Levine and colleagues further found an increased lying frequency in adolescents (aged 14–17;Levine, Serota, Carey, & Messer, 2013) as compared to the lying frequency reported by adults in other studies. It is, however, important to notethat Serota et al. (2010) (see also Halevy, Shalvi, & Verschuere, 2014)showed that the mean may provide a biased statistic in lying frequencyresearch: Many people reported not to lie, and a very small proportionof the surveyed samples (i.e., ‘prolific liars’) appeared responsible formost of the lies.Although lying frequency has never been systematically investigatedunder the age of 14, developmental studies have shown that withincreasing age, children become more inclined to lie (Chandler, Fritz,& Hala, 1989; Talwar & Lee, 2002; Talwar, Murphy, & Lee, 2007;Wilson, Smith, & Ross, 2003).2. Current studyOur primary goal was to investigate age-related changes in lyingproficiency and lying frequency. We predicted an age-related invertedU-course for both lying proficiency and lying frequency. This predictionwas based upon the previously observed age-related inverted U-coursefor response inhibition capacity. As those studies were restricted insample size, age range, or efforts to correct for baseline performance,
60E. Debey et al. / Acta Psychologica 160 (2015) 58–68we also sought to replicate the age-related inverted U-course forresponse inhibition capacity. Finally, we explored whether the effectof age on lying proficiency and lying frequency would be related tochanges in response inhibition capacity. This study was run in a sciencemuseum, as a convenient means to assess a large sample that hassubstantial variation in age.We assessed inhibitory control by means of a global stop-signal taskthat was similar to the one used in the lifespan study of Williams et al.(1999). While participants make speeded classification judgements oftwo letters (X or O?), this tasks requires one to withhold respondingwhen an auditory stop signal is presented, allowing to estimate thetime to stop (SSRT; Verbruggen & Logan, 2008). Lying proficiency wasmeasured by means of the Sheffield lie test (Spence et al., 2001) thatrequires speeded yes/no responses to questions (e.g., “Are you inAfrica?”). A color cue on the screen instructs when to lie or tell thetruth. This paradigm has been successfully used with children (Otgaar,Verschuere, Meijer, & Van Oorsouw, 2012), adolescents (Verschuere,Spruyt, Meijer, & Otgaar, 2011), and adults (Fullam, McKie, & Dolan,2009; Kaylor-Hughes et al., 2011). In this task, one typically observessignificant lie effects in error rates and RTs, indicating that lying istypically slower and more error-prone than truth telling (Spence et al.,2001; Van Bockstaele et al., 2012). Lying frequency was assessed withthe Serota self-report measure that asks for number of lies told in thepast 24 h. Due to the expected non-normal distribution of lyingfrequency, we will report mean frequencies, but focus on unbiasedstatistics (i.e., the median), and examine whether the number of prolificliars changes with age.3. Method3.1. ParticipantsIn August 2012, 1005 visitors of Science Center NEMO (Amsterdam,the Netherlands), aged between 6 and 77 years were recruited in thestudy.1 From this original sample, outlying participants were removedseparately for the stop-signal task, the Sheffield lie test, and the Serotaquestionnaire (see below for details).3.2. ApparatusThe stop-signal task and Sheffield lie test were run on Delllatitude E5510 laptops (2.4 GHz Core i3 M730 processor; 15.6-inchcolor monitor). Closed headphones were used to present the stopsignals in the stop-signal task and the questions in the Sheffieldlie test. The stop-signal task was programmed and presented using theTscope library for C/C programming (Stevens, Lammertyn,Verbruggen, & Vandierendonck, 2006). Stop-signal functions wereadapted from STOP-IT software (Verbruggen, Logan, & Stevens, 2008).The Sheffield lie test was programmed and presented using Inquisitversion 1.33 software. Participants sat approximately 40 cm from thescreen.3.3. QuestionnairesA demographic questionnaire assessed gender, date of birth, motherlanguage, and education/profession.Lying frequency was assessed with the Serota et al. (2010) selfreport lying frequency questionnaire. Participants were asked howmany times they had lied in the past 24 h. They had to specify the lierate for five different receivers (family members, friends, work/schoolrelated contacts, acquaintances, and strangers) along two deceptions1This research was part of Science Live, the innovative research program of ScienceCenter NEMO that enables scientists to carry out real, publishable, peer-reviewed researchusing NEMO visitors as volunteers.modes (face-to-face, and other forms of deception [e.g., internet, telephone]). A sum score of the 10 mode-receiver combinations was calculated as an estimate of lying frequency.23.4. Tasks3.4.1. Stop-signal taskThe stimuli used in the stop-signal task were the uppercase letters“X” and “O” (Courier, 48 pt., bold). They were presented in white inthe middle of a black screen. Depending on the response mapping thatwas counterbalanced across participants, the letter X required a leftresponse (“z” key) on a QWERTY keyboard and the letter O a rightresponse (“/” key), or vice versa. The stimuli remained on the screenfor the maximum response time of 2000 ms, followed by a blank screenof 300 ms. On a random selection of 25% of the trials, a stop signal(750 Hz, 75 ms) was presented shortly after the stimulus onset. Thestop-signal delay (SSD; the time interval between the presentation ofthe stimulus and the stop signal) was initially set at 250 ms and continuously adjusted according to a staircase tracking algorithm (Levitt,1970): The SSD decreased with 50 ms when inhibition was unsuccessful, and increased with 50 ms after successful inhibition. This procedureallows obtaining an approximate .50 probability of stopping.The task started with two practice phases. The first practice phase(8 trials; 2 stop-signal trials) focused on the go task. Participants wereasked to respond to the letters as quickly and accurately as possible.They were told that occasionally they would hear an auditorysignal, but were instructed to ignore it in this phase. In the secondphase (16 trials; 4 stop-signal trials), the actual stop-signal task wasexplained. Participants were told that they would have to try to stoptheir response when they heard the signal. They were also told thatsometimes it would be fairly easy to stop their response, whereasother times stopping would be hard. To prevent participants fromapplying a waiting strategy, it was stressed that the computer woulddelay the presentation of the stop signal when they started waiting forit. After each practice phase, performance feedback was provided.When necessary, the practice phases could be run again until the participants understood the task. After practicing, participants performed thetest phase with 160 trials (i.e., four blocks of 40 trials; 40 stop-signaltrials in total). In the middle of the task, a self-paced break was provided.In each block, the letters X and O were presented equally often andfollowed equally often by a stop signal. The task took approximately10 min.3.4.2. Sheffield lie testThirty general knowledge questions served as stimuli (see AppendixA). Half of the questions could be truthfully answered with a “yes”response (e.g., “Is grass green?”), whereas the other half required atruthful “no” response (e.g., “Can pigs fly?”; note that we provide theEnglish translation here, whereas the stimuli were presented inDutch). The questions were matched for length, and tested for understandability in a pilot study. On each trial, a single prerecorded question(always produced by the same male Dutch speaker) was presentedthrough the headphones. At the same time, the “YES” and “NO”response labels were presented on the screen according to the response2For exploratory reasons, we also assessed subjective lying proficiency and difficultyusing 10-point Likert scales: “How good do you think you are at lying?” (1 definitelynot good, 10 very good), and “How difficult is lying to you?” (1 not at all difficult,10 very difficult). Also emotionality of lying was assessed by asking participants howthey generally feel when they lie by means of the 9-point Self-Assessment Manniken(SAM; Bradley & Lang, 1994) rating scales for valence (1 very sad, 9 very happy)and arousal (1 very calm, 9 very aroused). With age, lying was rated as being moredifficult, more arousing, and more negative. Participants who lied more often rated themselves as relatively good liars, found lying more easy, and experienced less negative andaroused feelings during lying compared to participants who lied less. Interestingly, participants who lied faster in the Sheffield lie test also rated themselves as better liars, foundlying less difficult, and/or rated lying less negatively. However, these correlations weresmall (full results can be obtained on request).
E. Debey et al. / Acta Psychologica 160 (2015) 58–6861Table 1Variables of interest from the stop-signal task.Age (years)Descriptionn% femaleSSRT M (SD)SSD (ms)p(r s)GoRT (ms)GoAcc –77Early childhoodMidchildhoodAdolescenceYoung adulthoodMidadulthoodOlder 8506758299 (105)257 (86)229 (66)196 (54)203 (56)211 (60)215 (66)228 (77)536 (170)500 (215)461 (260)473 (238)475 (217)562 (238)578 (229)503 (227).46 (.06).46 (.07).45 (.08).46 (.07).45 (.07).43 (.08).43 (.09).45 (.08)910 (163)827 (227)761 (284)718 (265)733 (238)841 (276)858 (248)796 (251)95.15 (2.89)97.12 (2.58)97.23 (2.70)98.86 (1.74)98.78 (1.75)98.68 (1.80)98.82 (1.33)97.91 (2.42)Note. SSRT stop-signal reaction time (ms); SSD stop-signal delay (ms); p(r s) proportion of responses given a stop signal; GoRT reaction time on Go trials (ms); GoAcc accuracy on Go trials as a percentage of correct Go trials.mapping (YES left, NO right, or vice versa). Both labels were presented in a blue or yellow color, and a color rule (counterbalancedacross participants) designated when to lie or tell the truth (blue lying, yellow truth telling, or vice versa). From the start of the question, participants had 6 s to give a response, and the RT reflects thetime between the onset of the question and the response. When noanswer was given within the response deadline, the next questionwas automatically presented. After a response, or after 6 s without aresponse, a blank screen of 200 ms was inserted before the next question was presented.Before the start of the task, the experimenterprovided the instructions that were also presented on the screen. Participants first completed two practice phases. In the first practice phase,6 questions (3 yes- and 3 no-questions) that were not used in thetest phase were presented twice in a fixed order of increasingdifficulty (truth/yes-questions, lie/yes-questions, truth/no-questions,lie/no-questions). In the second practice phase, the same questionswere randomly presented. In both practice phases, a picture of anupward thumb, downward thumb, or a clock were presented asfeedback to a correct, incorrect, or too late response, respectively.After each practice phase, a performance feedback screen enabled theexperimenters to see if the participant understood the task. If necessary,the task was explained again and participants completed the practicephases a second time. The test phase consisted of three blocks of 40trials, so that each question required twice a truthful response, andtwice a deceptive response. Feedback was no longer provided aftereach trial. The intertrial interval was set at 300 ms. Blocks were separated by a self-paced break. At the end of the task, participants receivedfeedback based on their RT lie effect (i.e., RTTRUTH–RTLIE), classifyingthem as a good, mediocre, or bad liar. The task lasted approximately10 min.4. ProcedureIndividuals who did not speak Dutch, who were younger than 6, orolder than 82 were not eligible to participate. Volunteers were shortlybriefed about the experiment and signed an informed consent. If participants were younger than 18, the informed consent was signed by anaccompanying parent. Participants were first asked to fill out the demographic and lying questionnaires. Next, they entered a research room,where they performed the stop-signal task, followed by the Sheffieldlie test. Up to four participants could be tested simultaneously. Aftercompleting the tasks, an oral and written debriefing was provided.Overall, the experiment took approximately 30 min.5. ResultsOf 11 participants, day of birth were missing and hence their datacould not be used in the analyses. To allow for comparisons withprevious lifespan studies on the stop-signal task (Bedard et al., 2002;Williams et al., 1999), we divided participants into seven age groups(see Table 1 for a description of the age groups).For ANOVAs and hierarchical regressions, we calculated Cohen'sf as an effect size, using the following formula: f [η2p/(1 η2p)]. According to Cohen (1992), fs from 0.10, 0.25, and 0.40 represent small,medium, and large effects, respectively. For t-tests, we used Cohen's das an effect size, with d values from 0.20, 0.50, and 0.80 representingsmall, medium, and large effects, respectively (Cohen, 1988). WhenLevene's test for equal variances was significant, degrees of freedomwere adjusted.In preliminary analyses, we also investigated the impact of gender.However, as gender differences were not our primary focus, these analyses are only briefly described in Footnote 3.5.1. Stop-signal task5.1.1. Data analysisBecause it takes a number of trials for the tracking algorithm toadjust the SSD to the point where participants can successfully inhibittheir responses on approximately 50% of the stop-signal trials, wediscarded the first presentation block from the analyses. The SSRT wasestimated using the integration method (Logan, 1981; Verbruggen,Chambers, & Logan, 2013). We removed RTs below 200 ms (1.40%)and trials with RT recording errors (0.02%). Too late responses (1.34%)were set at the maximum response time of 2000 ms. Spearman–Brown split-half reliability (i.e., odd vs. even) was high for RT on go trials(i.e., GoRT; ρ .99), and low for SSRT (ρ .45). The low reliability ofSSRT may be attributed to a slowing strategy that some participantsdeveloped during the task, despite clear instructions not to do so.Indeed, a repeated measures ANOVA on GoRT revealed a main effectof Block, F(2, 1662) 92.06, p b .001, f 0.33, showing a gradualincrease of GoRT across blocks (ps b .001 in follow-up t-tests). Thisslowing strategy may also explain why the proportion of respondinggiven a stop signal (p[r s]) was overall rather low (see Table 1). Thefinding that p(r s) reached .50 in another study in which participantscompleted the same task (Suchotzki, Crombez, Debey, van Oorsouw, &Verschuere, 2014), supports the notion that not task parameters,but strategy use accounts for our results. By means of simulations,Verbruggen et al. (2013) showed that in case of strategic slowing inthe stop-signal task, reliable and unbiased SSRTs can be obtained byestimating the SSRT for smaller blocks using the integration methodand then taking the average across blocks. Accordingly, our estimation3To examine potential gender differences in the stop-signal task, we performed univariate ANOVAs on GoRT and SSRT with Age (7 age groups) and Sex (Male vs. Female) as predictors. In the GoRT analysis, the main effect of Sex proved significant, F(1, 818) 4.29,p .04, f 0.07, indicating that male participants were slower to respond(M 829 ms, SD 268) than female participants (M 772 ms, SD 235). No effectsof Sex were found for SSRT, Fs b 1.For the Sheffield lie test, we performed repeated measures ANOVAs on error rates andmean RTs with Deception (Truth vs. Lie), Age, and Sex as predictors. In the error analysis,no effects of Sex were found, Fs b 1. The RT analysis yielded a main effect of Sex, F(1,859) 10.92, p b .01, f 0.11, indicating that female participants (M 3421 ms,SD 359) were overall slower to respond than male participants (M 3366 ms,SD 336).
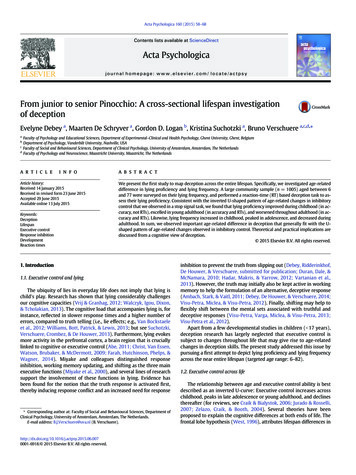
62E. Debey et al. / Acta Psychologica 160 (2015) 58–68of the SSRT equals the average of the SSRTs calculated for each of thethree presentation blocks using the integration method.We removed the data of three participants who did not (entirely)complete the stop-signal task. Hundred forty participants were definedas outlying and excluded from the analyses because they met at leastone of the following lenient outlier criteria proposed by Congdon et al.(2012): (1) a p(r s) less than .25 or greater than .75, (2) no responseon more than 40% of the go trials, (3) more than 10% errors on go trials,and (4) an SSRT that was negative or smaller than 50 ms. From theremaining sample, we additionally discarded 16 participants whoseSSRT was 2.5 standard deviations (SDs) removed from the mean SSRTof the age group they belonged to. Table 1 displays the remaining sample across the age groups. Following Williams et al. (1999), we not onlyanalyzed SSRT, but also GoRT as a measure of global speed processing.5.1.2. Response execution (GoRT)A one-way ANOVA on GoRT with Age (7 age groups) as predictorrevealed a main effect of Age, F(6, 825) 7.33, p b .001, f 0.23. Tofurther examine the effect of age on GoRT, we conducted a hierarchicalpolynomial regression on GoRT, where we subsequently entered thelinear, quadric, and cubic functions of Age as predictors (see Table 2,Analysis A). The quadratic function of Age proved to be a significant predictor of GoRT. In line with this quadratic term, visual inspection of Fig. 1(and Table 1) shows that GoRT decreased during childhood andgradually increased again during the course of adulthood. Plannedcomparisons of subsequent age groups revealed significant decreasesbetween early childhood and adolescence, ts 1.99, ps b .05,0.27 ds 0.38. Further, older adults were significantly slower thanmid
deception research has largely neglected that executive control is subject to changes throughout life that may give rise to age-related changes in deception skills. The present study addressed this issue by pursuing a first attempt to depict lying pro ficiency and lying frequency across the near entire l