Transcription
SKU LEUVENFACULTEIT ECONOMIE ENBEDRIJFSWETENSCHAPPENBusiness-Oriented DataAnalytics: Theory andCase StudiesProefschrift voorgedragen tothet behalen van de graad vanDoctor in de ToegepasteEconomische WetenschappendoorThomas VERBRAKENNummer 4272013
iiiCommitteeSupervisorProf. dr. Bart BaesensProf. dr. Marnik DekimpeProf. dr. Theodoros EvgeniouProf. dr. ir. David MartensProf. dr. Martina VandebroekDr. Bram VanschoenwinkelKU LeuvenTilburg UniversityINSEADUniversiteit AntwerpenKU LeuvenAEDaar de proefschriften in de reeks van de Faculteit Economie enBedrijfswetenschappen het persoonlijk werk zijn van hun auteurs,zijn alleen deze laatsten daarvoor verantwoordelijk.
To Évi and my parents,For their loving support.
viiAcknowledgmentsFirst and foremost, I want to thank my promoter, prof. dr. BartBaesens, for his excellent advice and the opportunities he offeredme throughout my PhD. He guided me towards promising researchtopics, while giving me the freedom to pursue those ideas whichlooked interesting to me. Furthermore, I know few people who areable to enthuse their employees the way he does, and I very muchenjoyed working with him.Likewise, I am thankful to prof. dr. David Martens for his intelligent and involved advice, for his encouragement, and for theinterest he always showed. I also appreciate the amusing and pleasantconversations we had, during a coffee break at work or with a beerafter work.I am grateful to prof. dr. Marnik Dekimpe, prof. dr. TheodorosEvgeniou, prof. dr. Martina Vandebroek, and dr. Bram Vanschoenwinkel, for being part of my PhD committee and for their valuableinsights and suggestions during my doctoral seminars. I also wouldlike to thank prof. Ben Immers and prof. dr. Chris Tampère for theirrole in my early academic career at the Traffic and InfrastructureCentre at KU Leuven. Prof. dr. Frank Goethals, prof. dr. StefanLessmann, prof. dr. Richard Weber, prof. dr. Sebastián Maldonado, and dr. Cristián Bravo deserve my gratitude for the fruitfulresearch collaborations which have been an important part of myPhD research.Although being a PhD student is a rather individual job, theimportance of colleagues cannot be underestimated. I would like tothank all of them for the interesting conversations, the occasionalbeer, and their support, both moral and technical. I especially want
viiito thank prof. dr. Wouter Verbeke, a former colleague but most ofall a very good friend, for his enthusiastic help – without him, myacademic career would have looked completely different.Without question, I very much appreciate the unconditional andeverlasting support of my parents, brothers, sister and my soon tobe parents-in-law and brother-in-law. Thank you for always beingthere, in good and bad times. And finally, last but not least, I wantto thank the woman who makes me smile every day again, my fiancéeI am lucky to marry in nine days, Évi.Leuven, September 12, 2013.
ixContentsCommitteeiiiAcknowledgmentsviiTable of ContentsixPrefaceIxiiiProfit-driven data analytics11 Introduction1.1 Predictive analytics in the industry . . . . . . . . . .1.2 Profit-driven classification . . . . . . . . . . . . . . .2 The2.12.22.32.42.5EMP frameworkIntroduction to classification . . . . . .Business context – costs and benefits . .Classification performance measurement2.3.1 Traditional performance metrics2.3.2 ROC curves and AUC . . . . . .2.3.3 The H measure . . . . . . . . . .A profit-based performance measure . .2.4.1 Deterministic approach: MP . . .2.4.2 Probabilistic approach: EMP . .2.4.3 EMP and ROC curves . . . . . .Conclusion . . . . . . . . . . . . . . . .335.7710121214151717181922
xCONTENTS3 EMP for customer churn prediction3.1 Introduction . . . . . . . . . . . . . . . . . . . . .3.2 Costs and benefits in CCP . . . . . . . . . . . . .3.3 A profit-based measure for CCP . . . . . . . . .3.3.1 MP for customer churn . . . . . . . . . .3.3.2 EMP for customer churn . . . . . . . . . .3.3.3 Sensitivity of EMP . . . . . . . . . . . . .3.4 EMP in practice . . . . . . . . . . . . . . . . . .3.4.1 Parameter values . . . . . . . . . . . . . .3.4.2 Empirical estimation of EMP . . . . . . .3.5 EMP and the H Measure . . . . . . . . . . . . .3.6 Case Study . . . . . . . . . . . . . . . . . . . . .3.6.1 EMP versus other performance measures3.6.2 Sensitivity analysis . . . . . . . . . . . . .3.7 Conclusion . . . . . . . . . . . . . . . . . . . . .4 EMP for consumer credit scoring4.1 Introduction . . . . . . . . . . . . .4.2 Cost and benefits in credit scoring4.3 A profit-based measure for CS . . .4.4 Empirical estimation of EMP . . .4.5 Case study . . . . . . . . . . . . .4.5.1 Consumer credit data set .4.5.2 Experimental setup . . . . .4.5.3 Parameter tuning . . . . . .4.5.4 Cutoff point determination4.6 Conclusion . . . . . . . . . . . . .25262730303133343435384141474951. 5152. 54. 575960. 6162. 64. 675 Toward profit-driven model building695.1 Introduction . . . . . . . . . . . . . . . . . . . . . . .695.2 Marketing analytics for customer churn management . 715.3 Research questions . . . . . . . . . . . . . . . . . . .735.4 Methodology . . . . . . . . . . . . . . . . . . . . . .755.5 Experimental design . . . . . . . . . . . . . . . . . .765.6 Empirical results . . . . . . . . . . . . . . . . . . . . . 77
xiCONTENTS5.7IIConclusion. . . . . . . . . . . . . . . . . . . . . . .Case studies in data mining80836 Customer churn prediction with Bayesian networkclassifiers856.1 Introduction . . . . . . . . . . . . . . . . . . . . . . .866.2 Customer churn prediction . . . . . . . . . . . . . . .886.3 Bayesian network classifiers . . . . . . . . . . . . . . . 916.3.1 Bayesian Networks . . . . . . . . . . . . . . . . 916.3.2 The Naive Bayes Classifier . . . . . . . . . .936.3.3 Augmented Naive Bayes Classifiers . . . . . . . 946.3.4 General Bayesian Network Classifiers . . . . .986.4 Experimental setup . . . . . . . . . . . . . . . . . . . . 1016.4.1 Data Sets and Preprocessing . . . . . . . . . . 1016.4.2 Markov Blanket Feature Selection . . . . . . . 1046.4.3 Bayesian Network Construction . . . . . . . . 1056.4.4 Measuring Classifier Performance . . . . . . . 1066.4.5 Testing Statistical Significance . . . . . . . . 1106.5 Discussion of results . . . . . . . . . . . . . . . . . . . 1116.5.1 Classification Performance . . . . . . . . . . . . 1146.5.2 Complexity and Interpretability of the BayesianNetworks . . . . . . . . . . . . . . . . . . . . 1166.6 Conclusion . . . . . . . . . . . . . . . . . . . . . . . 1197 Predicting online channel acceptance with social network data1237.1 Introduction . . . . . . . . . . . . . . . . . . . . . . . . 1247.2 Research method . . . . . . . . . . . . . . . . . . . . 1287.2.1 Survey procedure . . . . . . . . . . . . . . . . 1287.2.2 Respondent characteristics . . . . . . . . . . 1307.2.3 Products presented in the survey . . . . . . . . 1317.3 Social network classification . . . . . . . . . . . . . . 1337.3.1 Relational classifiers . . . . . . . . . . . . . . 136
xiiCONTENTS7.47.57.67.3.2 Collective inference procedures . . . . . . . . 1387.3.3 Alternative network classification methods . . 139Empirical case study . . . . . . . . . . . . . . . . . . 1407.4.1 Data preprocessing . . . . . . . . . . . . . . . 1407.4.2 Experimental setup . . . . . . . . . . . . . . . . 141Discussion . . . . . . . . . . . . . . . . . . . . . . . . 1457.5.1 Practical relevance . . . . . . . . . . . . . . . 1457.5.2 Differences across product groups . . . . . . . . 1477.5.3 Impact of relational classifier and link type . 1497.5.4 Limitations and suggestions for future research 152Conclusion . . . . . . . . . . . . . . . . . . . . . . . . 1548 Conclusions and future research8.1 Conclusions . . . . . . . . . . . . .8.1.1 Profit-driven data analytics8.1.2 Case studies in data mining8.2 Future research . . . . . . . . . . .8.2.1 Profit-driven data analytics8.2.2 Case studies in data mining.159. 159. 159. . 161. 162. 162. . 164List of Figures167List of Tables168Bibliography171Publication list189Doctoral Dissertations List193
xiiiPrefaceThe amount of data stored by human beings has experienced anexplosive growth during the past decades. According to Hilbert andLópez (2011), the worldwide data storage capacity amounted to2.9 · 1020 bytes in 2007, and global storage capacity grew at anannual rate of 23% between 1986 and 2007. These astonishing figuresillustrate the increasing importance of data in our modern society.However, mere data would not be valuable without the ability toextract information and knowledge from these vast databases. Theprocess of turning raw data into valuable information is knownunder various names such as knowledge discovery from data (KDD),data mining, or data analytics, and operates on the intersection ofdisciplines such as artificial intelligence, machine learning, statistics,and database systems.Several data mining techniques have been developed in order toanalyze data in a growing number of application fields. Accordingto Fayyad et al. (1996), there are six classes of data mining tasks:anomaly detection, association rule learning, clustering, summarization, regression, and classification. This PhD dissertation focuses onbinary classification, which entails the prediction of a binary targetvariable, based on a number of dependent variables.A myriad of classification techniques has been proposed in theacademic literature, each with their own merits. According to theNo Free Lunch theorem from Wolpert and Macready, there exist nosingle best classifier; the choice of technique rather depends on thecharacteristics of the data set being analyzed (Ali and Smith, 2006).Essentially, when tackling a specific problem, one always needs toselect the optimal classifier for that particular context. Hence, even
xivCONTENTSthough classification techniques have been extensively compared toone another, quality assessment of classification techniques remainsimportant.A full quality assessment of classification techniques consists ofthree dimensions. The main requirements for acceptance of a datamining model, as identified by Martens (2008), are (1) the predictivepower, (2) its comprehensibility, and (3) its justifiability. The majorpart of this thesis focuses on the predictive power of classificationmodels, thereby keeping a strong focus on the business context inwhich the classification model is used. This leads to a new frameworkfor measuring the performance of classification models, the expectedmaximum profit (EMP) measure. Furthermore, two independentcase studies are presented, which demonstrate the usefulness of datamining in a business context. In what follows, the outline of this PhDdissertation and the main contributions are discussed in detail.Outline and contributionsThis dissertation is divided into two main parts: Part I proposesa profit-oriented approach towards classification, whereas Part IIpresents two case studies in data mining.Part I – Profit-driven data analyticsChapter 2 – The EMP frameworkThis chapter proposes a theoretical profit-based framework for classification performance measurement, the EMP framework. A careful and general analysis of the employment of a classification algorithm in a business context is provided, and theinvolved costs and benefits are outlined. The EMP framework is proposed, which is an abstract andgeneral framework for classification performance measurementand can be implemented for different business contexts.
CONTENTSxv Attention is being paid to the link with other performancemetrics, especially the connection with the receiver operatingcharacteristic (ROC) curve is analyzed in detail.Chapter 3 – EMP for customer churn predictionIn this chapter, the EMP framework is implemented for applicationin a customer churn prediction context. The classification costs and benefits in the case of customerchurn prediction are identified, and the EMP measure for customer churn prediction, EMPccp , is proposed. An estimation procedure – based on empirical ROC curves – isprovided. This enables the application of the EMPccp measurein real life settings. The link between the H measure and the EMPccp measure isinvestigated, and it is shown, analytically as well as empirically,that the H measure – with appropriately chosen parameters –is an approximation to the EMPccp measure. An extensive case study shows that the EMPccp measure leadsto other rankings than traditional performance measures, andthat EMPccp -based model selection leads to a higher profit thanAUC-based model selection. It is illustrated that the EMPccp measure provides informationabout the fraction of the customer base which should be targeted in a retention campaign, a feature which is not sharedwith traditional performance measures. Finally, a sensitivity analysis reveals that the EMPccp is robustto variations in the cost and benefit parameters.Chapter 2 (the general EMP framework) and Chapter 3 (its implementation for customer churn prediction) have been publishedin:
xviCONTENTSVerbraken, T., Verbeke, W., Baesens, B., 2013d. A novel profit maximizing metric for measuring classification performance of customerchurn prediction models. IEEE Transactions on Knowledge and DataEngineering 25 (5), 961–973.Chapter 4 – EMP for credit scoringAn implementation of the EMP measure for consumer credit scoringis discussed in Chapter 4. The costs and benefits in the case of consumer credit scoring areanalyzed and EMPcs , an EMP measure tailored to consumercredit scoring, is proposed. A procedure for the empirical estimation of EMPcs – based onROC curves – is established. A real life case study illustrates that EMPcs -based parametertuning leads to other parameter settings than AUC or accuracybased parameter tuning. The EMPccp measure provides information about the optimalcutoff value, which is needed to operationalize the classificationmodel. It is shown that EMPccp -based cutoff determinationleads to higher overall profitability.This chapter has been submitted for publication and is currentlyunder review:Verbraken, T., Bravo, C., Weber, R., Baesens, B., 2013a. Developmentand application of consumer credit scoring models using profit-basedclassification measures. European Journal of Operational Research(under review).Chapter 5 – Toward profit-driven model buildingChapter 5 presents an exploratory study on the usefulness of profitdriven model building.
CONTENTSxvii The EMP framework is combined with ensemble selection (ES),in order to analyze the impact of profit-driven model building. A real life case study in a customer churn prediction settingis carried out, in order to assess four research hypotheses onprofit-driven model selection and model building. The empirical results show that using a profit-based measurein the model building step leads to higher profitability, ascompared to traditional model building.This chapter has been published in:Verbraken, T., Lessmann, S., Baesens, B., 2012b. Toward profitdriven churn modeling with predictive marketing analytics. In: Cloudcomputing and analytics: innovations in e-business services. TheEleventh Workshop on E-Business (WEB2012). Orlando (US), 15December 2012 (accepted).Part II – Case studies in data miningPart II presents two standalone case studies on the application ofdata mining in a business context.Chapter 7 – Customer churn prediction with Bayesian network classifiersThis study investigates the use of a specific type of classificationtechniques, i.e. Bayesian network classifiers, for customer churn prediction. An overview of the several Bayesian network classificationtechniques is given, and a related algorithm for feature selection,Markov blanket feature selection, is discussed. An extensive benchmarking study of Bayesian network classifiers for customer churn prediction has been carried out. Theresults indicate that most Bayesian network classifiers are not
xviiiCONTENTSsignificantly better, neither worse, than traditional logistic regression. Furthermore, the case study illustrates that Markov blanketfeature selection does not negatively impact the classificationperformance, while reducing the number of variables, and thusincreasing interpretability. Finally, an example of a compact Bayesian network is given,which performs well in terms of predictive accuracy and iscomprehensible, thereby fulfilling the requirements for the acceptance of a data mining model.This chapter has been accepted for publication:Verbraken, T., Verbeke, W., Baesens, B., 2013e. Profit optimizing customer churn prediction with Bayesian network classifiers. IntelligentData Analysis (accepted for publication).Chapter 8 – Predicting online channel acceptance with social network dataThe second case study analyzes the use of social network-basedclassification techniques to predict e-commerce acceptance. Information was gathered on the e-commerce acceptance of people and their social network, through a survey. This informationis then used to investigate the use of social network classificationtechniques for the prediction of e-commerce acceptance. The study reveals that knowledge of a person’s social networkis valuable to predict the person’s acceptance of the onlinechannel for buying different products. Hereby, no information is needed about the intensity of the relation. This means that a binary connectivity matrix is sufficientto make meaningful predictions.
CONTENTSxix Finally, the results indicate that socio-demographic data is notnecessarily needed. Hence, social network data only is enough incertain situations, which provides opportunities for companiesto identify potential customers for their online shop.This chapter has been accepted for publication:Verbraken, T., Goethals, F., Verbeke, W., Baesens, B., 2013b. Predicting online channel acceptance with social network data. DecisionSupport Systems (accepted for publication).
xxCONTENTS
1Part IProfit-driven dataanalytics
3Chapter 1IntroductionAs a result of the steep growth in computational power and the evergrowing amount of data available to companies, predictive analyticshas become a popular approach toward managerial decision support.With the increased interest for predictive analytics in the industry,the question arises whether the methods and metrics employed withinpredictive analytics are adequate for a direct application in a businesscontext. The main thread of Part I deals with this question andadvocates the incorporation of profitability into predictive analytics,in order to support companies with one of their important goals,profit maximization.Section 1.1 first explains the role of predictive analytics in theindustry, and how companies can benefit from the adoption of predictive analytics. Section 1.2 briefly introduces the sub domain ofpredictive analytics we will focus on, i.e. binary classification.1.1Predictive analytics in the industryData-driven models for decision support are increasingly being employed in the industry. A recent survey among 212 senior executivesof Fortune 1000 firms, conducted by Germann et al. (2013), indicatesthat a one-unit increase (on a scale of one to seven) in the degreeof deployment of marketing analytics is, on average, associated withan 8% increase in return on assets. This positive impact is morepronounced for firms which are facing a greater level of competition
41.1. PREDICTIVE ANALYTICS IN THE INDUSTRYwithin their industry, and for firms dealing with rapidly changingcustomer preferences (Germann et al., 2013). The beneficial effects ofpredictive analytics on firms’ profitability are further supported byother studies (Hoch and Schkade, 1996; Kannan et al., 2009; Lodishet al., 1988; McIntyre, 1982; Natter et al., 2008; Silva-Risso et al.,1999; Zoltners and Sinha, 2005). However, the survey by Germannet al. (2013) also revealed that few managers are convinced of thebenefits of (marketing) analytics. Furthermore, a study of 587 C-levelexecutives of large international companies, carried out by McKinsey& Co (2009), showed that marketing analytics is only regularly usedby 10% of the firms. This low prevalence suggests that many decisionmakers are not convinced about the positive impact.Lilien et al. confirmed that decision makers relying on a high quality decision support system (DSS) make objectively better decisionsthan those who use less advanced tools (such as Excel). Nevertheless,despite the positive impact of a DSS on the firms’ performance, theusers of a DSS do not perceive its usefulness as such. Hence, weshould ask the question how we can improve the adoption of predictive analytics in the industry, since there appears to be a mismatchbetween the perception of its impact, and the effective impact itself.The lack of recognition of the quality of the DSS can be explainedby the fit-appropriation model (FAM), proposed by Dennis et al.(2001). FAM states that the impact of a DSS is influenced by the fitbetween the task and the DSS, i.e. the task-technology fit (appropriation support, i.e. training to incorporate the new DSS into thedecision process, is another important factor). A recommendation foran increased acceptance of DSS among decision makers, is to designtools which fit well with the decision context, and which providespecific feedback on the likely (market) outcome.Generally, within a business context, profitability is one of themain end goals of the company and its managers. Therefore, we arguethat profitability should be incorporated into predictive analytics, inthe first place to yield better results – in terms of profitability – butalso in order to promote the use of these tools among managers. After
CHAPTER 1. INTRODUCTION5all, profitability is the language all managers speak and understand.1.2Profit-driven classificationUnlike explanatory modeling, which aims at gaining insight intostructural dependencies between variables of interest, the objective ofpredictive analytics is to construct data-driven models that produceoperationally accurate forecasts. Such a predictive analytics toolconsists of two components: (1) data-driven models designed topredict future observations and (2) methods to assess the predictivepower of such models (Shmueli et al. 2011). This dissertation focuseson a sub domain of predictive analytics: binary classification. Hence,two components are of interest: the classification models themselves,and the classification performance measures. We argue that a focuson profitability should be integrated into both components.There has already been some attention for cost-sensitive learning.E.g. Domingos (1999) proposed a general method to produce costsensitive classifiers, Provost and Fawcett (2001) combined ROC curveanalysis with cost distribution information, Bernstein et al. (2005)developed an ontology-based approach for cost-sensitive classification,Zhou and Liu (2006) used over- and undersampling and thresholdmoving (and an ensemble of these methods) for cost-sensitive learningwith neural networks, and more recently, Hand (2009) introduced theH measure, which takes into account misclassification costs. However,as pointed out by Elkan (2001):"Although most recent research in machine learning hasused the terminology of costs, doing accounting in terms ofbenefits is generally preferable, because avoiding mistakesis easier, since there is a natural baseline from which tomeasure all benefits, whether positive or negative."By focusing on benefits (and profit) rather than costs, we are stayingcloser to the business reality, and aid the adoption of classificationtechniques in the industry. Therefore, a profit-based classification
61.2. PROFIT-DRIVEN CLASSIFICATIONperformance measure will be developed and applied to real life business cases. Moreover, an exploratory study on the incorporation ofthe profitability criterion into the model building step is presented.The remainder of Part I is organized as follows. First, a profitoriented framework for classification performance measurement, theExpected Maximum Profit (EMP) measure, will be introduced inChapter 2. This is a general and abstract framework, which needs tobe tailored to specific business environments. Chapter 3 elaborateson the implementation of the EMP framework for a customer churnprediction context, and the benefits hereof are illustrated with a casestudy. Similarly, the EMP framework is implemented for consumercredit scoring in Chapter 4. Finally, the possibilities of profit-basedmodel building are explored in Chapter 5.
7Chapter 2The EMP frameworkThroughout the history of predictive modeling, classification hasbeen an important task, with applications in several industries. Forthe assessment of classification models, a wide variety of statisticallymotivated performance measures has been proposed. In this chapter,we will outline the general context of classification and the use ofa profit-based performance measure for classification performancemeasurement.Section 2.1 first introduces the concept of classification and itsrelated notation. The use of classification models in a business context, and the costs and benefits associated with it, are discussedin Section 2.2. Finally, Section 2.3 outlines a general framework forprofit-based classification performance measurement, which is one ofthe key contributions of this dissertation and will be applied in reallife case studies in the following chapters.2.1Introduction to classificationIn this dissertation, the focus lies on binary classification problems,where each instance has to be assigned a class label, being either 0or 1. Note that we follow the convention that a 0 corresponds to acase (also called event) whereas a 1 corresponds to a non-case. Thisconvention, opposite to what many textbooks follow, has also beenadopted by Hand (2009) because it simplifies notation. The priorprobabilities of class 0 and 1 are π0 and π1 , respectively. Generally,
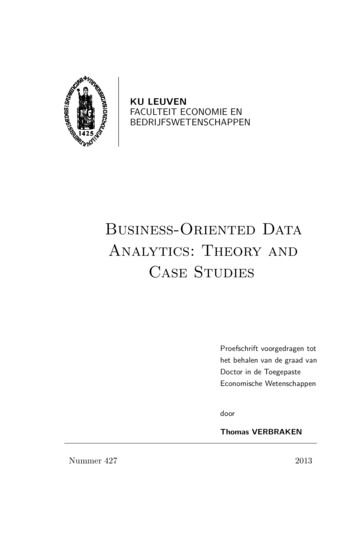
82.1. INTRODUCTION TO CLASSIFICATIONProbability densitys tf0 (s)f1 (s)Score s(x)Figure 2.1: Example of score distributions and the classification process.a classification model provides a continuous score, s (x), which isa function of the attribute vector x of the respective instance, anddiscriminates between the two classes. In this dissertation, it isassumed that the instances from class 0 have a lower score thanthose from class 1 – if not, simply multiply the score by 1. Theactual classification, i.e. the assignment of each instance to one oftwo groups, is achieved by defining a cutoff value t, such that allinstances with s less than t are classified as 0, whereas instances forwhich s is greater than t are classified as 1.Assume that the function F0 (s) is the cumulative density functionof the scores s of the cases, whereas F1 (s) represents the same for thenon-cases. Analogously, f0 (s) and f1 (s) are the probability densityfunctions for the cases and the non-cases, respectively. Note that fkand Fk are connected to a specific classifier, which is producing thescores s(x). The classification process is illustrated by Figure 2.1.Every instance with score s t is classified as a case (class 0).E.g., cases for which s t (i.e. the shaded area under f0 (s)) arecorrectly predicted. On the other hand, non-cases for which s t (i.e.the shaded area under f1 (s)) are incorrectly predicted. Hence, the
9CHAPTER 2. THE EMP FRAMEWORKTrue LabelPredicted LabelCaseNon-CaseCaseπ0 F0 (t)[c(0 0)]π0 (1 F0 (t))[c(1 0)]Non-Caseπ1 F1 (t)[c(0 1)]π1 (1 F1 (t))[c(1 1)]Table 2.1: Confusion matrix and related costs and benefits for a binaryclassification model.less overlap there is between the two score distributions, the betterpredictions the classifier will yield.The outcome of a classification task can also be summarizedin a confusion matrix, as displayed in Table 2.1. The confusionmatrix consists of four quadrants, whereby the diagonal containsthe correct predictions whereas the off-diagonal elements concernincorrect predictions. Each cell displays the number of instances,expressed as a fraction of the total number of instances, N , andthe four cells add up to one. For instance, the upper right cellcontains the cases which are incorrectly classified as non-cases. Thefraction of instances in this category is given by π0 (1 F0 (t)). Itis straightforward to see that the fractions of correct and incorrectpredictions change when varying the cutoff value t – changing thecutoff t corresponds to translating the dashed line in Figure 2.1 tothe left or right.Furthermore, each cell in the confusion matrix has related costsor benefits. In general, the cost or benefit c(k l) of classifying aninstance from class l into class k (with k, l {0, 1}) can be – andusually is – different for each of the four cells of the matrix. Thedistribution of these costs and benefits should be taken into account,and has a significant impact on how classification models shouldbe used within a business context, as will be discussed in the nextsection.
102.22.2. BUSINESS CONTEXT – COSTS AND BENEFITSBusiness context – costs and benefitsUsually, a classification model serves as input for a business decisionwhich has to be taken, and which requires a certain population to bedivided into two groups: cases and non-cases. The main reason fordividing the population into two groups, is to take a certain actiontowards a subgroup of the entire population, because the payoffof the action is different for the two subgroups. As an illustration,consider credit scoring, where a financial institution wants to rejectloan applicants which are going to default. The population is formedby the loan applicants. The cases are
Business-Oriented Data Analytics: Theory and Case Studies Proefschrift voorgedragen tot het behalen van de graad van Doctor in de Toegepaste Economische Wetenschappen door Thomas VERBRAKEN Nummer427 2013. iii Committee Supervisor Prof.dr.Bar