Transcription
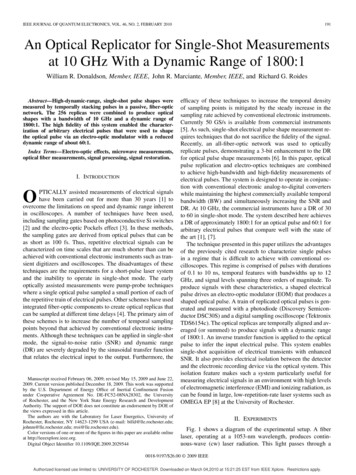
IEEE JOURNAL OF QUANTUM ELECTRONICS, VOL. 46, NO. 2, FEBRUARY 2010191An Optical Replicator for Single-Shot Measurementsat 10 GHz With a Dynamic Range of 1800:1William R. Donaldson, Member, IEEE, John R. Marciante, Member, IEEE, and Richard G. RoidesAbstract—High-dynamic-range, single-shot pulse shapes weremeasured by temporally stacking pulses in a passive, fiber-opticnetwork. The 256 replicas were combined to produce opticalshapes with a bandwidth of 10 GHz and a dynamic range of1800:1. The high fidelity of this system enabled the characterization of arbitrary electrical pulses that were used to shapethe optical pulse via an electro-optic modulator with a reduceddynamic range of about 60:1.Index Terms—Electro-optic effects, microwave measurements,optical fiber measurements, signal processing, signal restoration.I. INTRODUCTIONPTICALLY assisted measurements of electrical signalshave been carried out for more than 30 years [1] toovercome the limitations on speed and dynamic range inherentin oscilloscopes. A number of techniques have been used,including sampling gates based on photoconductive Si switches[2] and the electro-optic Pockels effect [3]. In these methods,the sampling gates are derived from optical pulses that can beas short as 100 fs. Thus, repetitive electrical signals can becharacterized on time scales that are much shorter than can beachieved with conventional electronic instruments such as transient digitizers and oscilloscopes. The disadvantages of thesetechniques are the requirements for a short-pulse laser systemand the inability to operate in single-shot mode. The earlyoptically assisted measurements were pump-probe techniqueswhere a single optical pulse sampled a small portion of each ofthe repetitive train of electrical pulses. Other schemes have usedintegrated fiber-optic components to create optical replicas thatcan be sampled at different time delays [4]. The primary aim ofthese schemes is to increase the number of temporal samplingpoints beyond that achieved by conventional electronic instruments. Although these techniques can be applied in single-shotmode, the signal-to-noise ratio (SNR) and dynamic range(DR) are severely degraded by the sinusoidal transfer functionthat relates the electrical input to the output. Furthermore, theOManuscript received February 06, 2009; revised May 15, 2009 and June 22,2009. Current version published December 18, 2009. This work was supportedby the U.S. Department of Energy Office of Inertial Confinement Fusionunder Cooperative Agreement No. DE-FC52-08NA28302, the Universityof Rochester, and the New York State Energy Research and DevelopmentAuthority. The support of DOE does not constitute an endorsement by DOE ofthe views expressed in this article.The authors are with the Laboratory for Laser Energetics, University ofRochester, Rochester, NY 14623-1299 USA (e-mail: billd@lle.rochester.edu;johnm@lle.rochester.edu; rroi@lle.rochester.edu).Color versions of one or more of the figures in this paper are available onlineat http://ieeexplore.ieee.org.Digital Object Identifier 10.1109/JQE.2009.2029544efficacy of these techniques to increase the temporal densityof sampling points is mitigated by the steady increase in thesampling rate achieved by conventional electronic instruments.Currently 50 GS/s is available from commercial instruments[5]. As such, single-shot electrical pulse shape measurement requires techniques that do not sacrifice the fidelity of the signal.Recently, an all-fiber-optic network was used to opticallyreplicate pulses, demonstrating a 3-bit enhancement to the DRfor optical pulse shape measurements [6]. In this paper, opticalpulse replication and electro-optics techniques are combinedto achieve high-bandwidth and high-fidelity measurements ofelectrical pulses. The system is designed to operate in conjunction with conventional electronic analog-to-digital converterswhile maintaining the highest commercially available temporalbandwidth (BW) and simultaneously increasing the SNR andDR. At 10 GHz, the commercial instruments have a DR of 30to 60 in single-shot mode. The system described here achievesa DR of approximately 1800:1 for an optical pulse and 60:1 forarbitrary electrical pulses that compare well with the state ofthe art [1], [7].The technique presented in this paper utilizes the advantagesof the previously cited research to characterize single pulsesin a regime that is difficult to achieve with conventional oscilloscopes. This regime is comprised of pulses with durationsof 0.1 to 10 ns, temporal features with bandwidths up to 12GHz, and signal levels spanning three orders of magnitude. Toproduce signals with these characteristics, a shaped electricalpulse drives an electro-optic modulator (EOM) that produces ashaped optical pulse. A train of replicated optical pulses is generated and measured with a photodiode (Discovery Semiconductor DSC30S) and a digital sampling oscilloscope (TektronixTDS6154c). The optical replicas are temporally aligned and averaged (or summed) to produce signals with a dynamic rangeof 1800:1. An inverse transfer function is applied to the opticalpulse to infer the input electrical pulse. This system enablessingle-shot acquisition of electrical transients with enhancedSNR. It also provides electrical isolation between the detectorand the electronic recording device via the optical system. Thisisolation feature makes such a system particularly useful formeasuring electrical signals in an environment with high levelsof electromagnetic interference (EMI) and ionizing radiation, ascan be found in large, low-repetition-rate laser systems such asOMEGA EP [8] at the University of Rochester.II. EXPERIMENTSFig. 1 shows a diagram of the experimental setup. A fiberlaser, operating at a 1053-nm wavelength, produces continuous-wave (cw) laser radiation. This light passes through a0018-9197/ 26.00 2009 IEEEAuthorized licensed use limited to: UNIVERSITY OF ROCHESTER. Downloaded on March 04,2010 at 15:21:25 EST from IEEE Xplore. Restrictions apply.
192IEEE JOURNAL OF QUANTUM ELECTRONICS, VOL. 46, NO. 2, FEBRUARY 2010Fig. 1. A cw fiber-optic laser is shaped by an EOM. The modulated pulse is then amplified before being replicated and detected by a photodiode and digitaloscilloscope.Mach–Zehnder integrated electro-optic modulator fabricated. This is a two-stage modulator. A square electricalongate pulse is applied to the first modulator to eliminate any lightoutside of the temporal duration of the electrical pulse. Thisstep is necessary because the optical replicator will supportonly a fixed, 12.5-ns acquisition window. Extraneous lightoutside this temporal window will cause interference amongreplicas. The electrical pulse to be measured is fed into thesecond stage of the modulator. The power transmitted through, is given bythe second modulator,decaying profile. However, the regenerative amplifier is operated as described in [10], where the effective time constant ofthe decay is much greater than the pulse length resulting in alinearly decaying ramp. The ramp has a normalized value of 1at the beginning of the optical pulse and (1.0- ) at the end ofthe pulse, where the parameter is the SPD and is constrainedto be between 0 and 1. For all waveforms shown in this paper. To determine the optical pulse shape that enteredthe regenerative amplifier, for any arbitrary pulse shape ofduration , it is necessary to multiply the output waveform bythe function(1)whereis the optical power entering the modulator,isis the half-wave voltage of the modthe applied voltage, andulator. The phase term has two components: The first component arises from the intrinsic optical-path difference betweenthe two arms of the interferometer; the second component is induced by an applied dc voltage. In these experiments the applieddc voltage was actively controlled ( 10 mV) to maintain zero.is approximately 5 V and a 50-mVtotal phasechange causes a noticeable distortion in the pulse shape. Withthis arrangement, well-characterized electrical pulses are usedto produce stable optical pulses.The optical pulse is amplified to ensure that each of thereplicas has enough photons to overcome shot noise in thedetector. A fiber amplifier [9] and a regenerative amplifier [10]are used to amplify the signal, providing 1 mJ of optical energynm for seeding the OMEGA Laser System [10],atfor our measurement. A stand-alone measuring[11] and 1system would use a much simpler, cheaper, and less-energeticfiber amplifier in place of the regenerative amplifier. Alternatively, the amplifier could be placed in front of the EOM orincorporated as part of the input laser to eliminate the possibility of amplification-induced optical pulse shape distortion.The distortion induced by the regenerative amplifier can becharacterized by a single parameter, the square-pulse distortion(SPD). A square pulse entering the regenerative amplifier will,in the general case, emerge as a pulse with an exponentially(2)where is the time measured from the beginning of the pulse.The point-to-point rms fluctuations of the pulse shape from theregenerative amplifier are less that 1% [10].After amplification, the optical pulse is replicated by dividingits energy among 256 copies using fiber-optic splitters as shownin Fig. 2. A series of nine 2 2 fused-fiber splitters are splicedwithns (where ranges from 1 to 9) differential delay fibers between each stage. Each stage produces twons apart as input to the next stage. Sincepulse setssuccessive combinations use splits from previous combinations,the only place light is forfeited is in the last split. Ideally, allof the replicas should have the same amplitude, but variations2 splitters result in a characteristic distribution ofin the 2replicated amplitudes. The input optical pulse must have sufficient energy to allow all of the replicated pulses to be well abovethe noise in the detection system. It was necessary to keep thelength of optical fiber preceding the replicator less that 30 mto keep the stimulated Raman scattering (SRS) threshold lessin the input fiber. For nanosecond-durationthan 37pulses, this permitted operation at approximately 70% of thephotodiode saturation limit without SRS (sidebands 40 dB).Once the pulse enters the replicator, the intensity immediatelydecreases by a factor of 2 and SRS is no longer a problem. Thepulses are nominally spaced at 12.5 ns, although precise spacingis not critical since the computer software that recombines thepulses can be configured for any set of pulse separations. TheAuthorized licensed use limited to: UNIVERSITY OF ROCHESTER. Downloaded on March 04,2010 at 15:21:25 EST from IEEE Xplore. Restrictions apply.
DONALDSON et al.: AN OPTICAL REPLICATOR FOR SINGLE-SHOT MEASUREMENTS AT 10 GHz WITH A DYNAMIC RANGE OF 1800:12m193Fig. 2. The optical replicator consists of nine 2 2 fiber-optic splitters. At the th stage, the first output is directly connected to the input of the following stage.1) times theThe second output is connected to the second input of the following stage with an optical fiber that has a propagation delay of approximately 2(interpulse spacing.m02Fig. 4. Based on the SNR, the optical pulse emerging from the 256 opticalreplicator has a DR of approximately 1800:1. The vertical lines indicate the SNRfor signal levels that are listed as a percentage of the peak amplitude.Fig. 3. The entire train of 256 pulses (a) produced by the optical replicatorillustrates the characteristic distribution of pulse amplitudes caused by deviationin the splitter ratio from the idea 50/50. (b) Two pulses from the train.256-pulse waveform is acquired from the digitizing oscilloscopewith 25 ps resolution. Fig. 3 shows the raw data acquired fromthe oscilloscope.The individual pulses from the pulse train are separated inpost-processing by temporal binning. The fine temporal alignment between two pulses in the train is measured once, withsubpixel resolution, by determining the peak of the cross-correlation with a parabolic fit. The fixed offsets are stored and usedto reduce all subsequent data acquisitions. Once the alignmenthas been determined, the individual replicas can be combined toproduce a single low-noise composite pulse shape. Normalizingthe energy (area) of each of the replicas, the standard deviationof the pulse optical power at each power level is used to deteris the normalized waveform of the thmine the SNR.replica at sampling time, . The SNR is determined by taking, whereto 256several identical measurements,(identical being defined as occurring at the same time withinthe pulse), and averaging them to get the signal,. Thenoise is the standard deviation of those points about the meandivided by the square root of the number of points. The SNR isthe ratio of those two quantities [12]. This formalism was chosenbecause the users of this data must specify the error bars on theoptical amplitude at each point in time. As shown in Fig. 4, theSNR’s dependence on the signal level is dominated by the noisecharacteristics of the oscilloscope’s input amplifier. At signallevels below 20% of the peak, the SNR depends linearly on thesignal level. The point where the SNR equals 1 (as determinedfrom this linear fit) represents the minimum credible signal thatcan be measured. The DR (defined as the ratio of the peak to thesignal level where the SNR equals 1) is 1769 for the recombinedoptical pulse out of the replicator. The effective number of bitsat a time resolution of 25 ps (ENOB) of this measurement is10.8, where(3)The Tektronix 6154 C oscilloscope used for these measurementshas a true analog of 12 GHz and an ENOB between 4 and 5.5[13], [14]. Thus, the 256 replicator makes it possible to almostdouble the ENOB of this particular oscilloscope.In addition to increasing the SNR of the signal, the opticalreplicator enhances the high-frequency response of the detectedoptical pulse beyond that of a single measurement. The oscilloscope has an analogue BW of 12 GHz, and the photodiodehas a flat response out to 18 GHz and a 3-dB cutoff frequencyAuthorized licensed use limited to: UNIVERSITY OF ROCHESTER. Downloaded on March 04,2010 at 15:21:25 EST from IEEE Xplore. Restrictions apply.
194IEEE JOURNAL OF QUANTUM ELECTRONICS, VOL. 46, NO. 2, FEBRUARY 2010ulator. To remove the distortions caused by the EOM and amplifier and obtain the voltage signal, the inverse of (1) must beused:(4)Fig. 5. The (red) x’s represent the FFT of a single optical pulse. The (black)squares represent the FFT of the combined output of the optical replicator. Thehorizontal lines represent the average of the FFT in the frequency range of15 GHz to 20 GHz—a region where the system has no sensitivity and represents the white-noise limit in the single-pulse case.of 22 GHz [15]. Therefore, the measurement system shouldsupport frequencies as high as 12 GHz. The temporal data canbe converted to a frequency response by using fast Fouriertransforms (FFT’s). Fig. 5 shows the magnitude of the FFT ofa single optical pulse emerging from the replicator (red x’s)and the combined, averaged output (black squares). With asampling window of 25 ps, the FFT algorithm generates a frequency spectrum out to 20 GHz. Beyond the cutoff frequencyof 12 GHz, this measured spectrum should contain only whitenoise. The average of the spectrum over the 15-GHz to 20-GHzBW represents the noise floor limits for each curve, displayedas horizontal lines. The single trace falls below the noise floorat about 8 to 10 GHz, while the averaged trace does not crossthe noise floor until the 12- to 15-GHz range. Ideally the noisefloors should differ by a factor of 16, but the 256 replicas hadamplitudes that varied by a factor of 3, therefore reducing thedifference in the noise floors. The particular single optical tracewas chosen at the mode of the amplitude distribution shownin Fig. 3. In this case the ratio of the noise floors was 11.7.The frequency-dependent signal-to-noise-and-distortion-ratio[16] (SINAD) can be estimated by dividing the replicated andaveraged FFT of the signal [black squares (Fig. 5)] by thehigh-frequency white-noise limit given by the solid black line.Therefore, at approximately 13 GHz, the SINAD would be1, at 10 GHz it would be 3.55, and at DC it would be about4000. This is an approximate measurement because a perfectfunction was not used as the input. Had a temporally narrowerpulse been used as the input to the replicator, the frequencycontent in the 8 to 12-GHz range would be enhanced and thesenumbers would improve slightly.While this replicator was shown to enhance the SNR of optical pulses, it can also be used to characterize any electricalsignal from an arbitrary detector. The signal must be input intothe radio frequency port of the EOM. Ideally, the amplitude ofof the EOM.the electrical signal should be slightly less that.) The formula in (2) can be(For this paper,used to remove the effect of the amplifier saturation from thereplicator-enhanced signal to determine the output of the mod-Fig. 6 shows the input voltage obtained by applying (4) to asingle-shot optical waveform at the output of the modulator. Because of the sinusoidal nature of the modulator response thereis an ambiguity in the sign of the inferred signal. This can beat the expense of losing a factorremoved by setting toof 2 in the dynamic range or 1 ENOB. Also plotted in Fig. 6 isan input voltage waveform measured with a conventional oscilloscope. This electrical signal was stable and repetitive, so theaverage of 256 different traces reproduces the input signal witha low level of noise. The agreement between these two curves isexcellent. At voltage levels above 10% of the peak, the averageof the absolute difference between the two curves is 2.5%. Thereare small discrepancies that can be highlighted by consideringthe SNR of the two cases. For the input voltage, the SNR wascalculated by using the standard deviation, at each point, of theacquired waveforms. The data are plotted by (dark blue) trian.gles in Fig. 7 along with a dotted line fit of the form,This curve represents the single-shot performance of the oscilloscope alone. For this comparison the samples were not averaged, and, correspondingly, the standard deviation was not re, whereis the number of samples.duced by the factorThe direct measurement is compared with the single-shot measurement from the output of the 256 replicator. For the voltage, the SNR was deducedinferred from the optical signal,, whereisby using (4) withthe rms (root-mean-square) variation in the average of thefrom the replicator output. The variation or noise in,andare the voltageswhere. The SNR of this data,,deduced fromis plotted in Fig. 7 as (black) x’s. The SNR of the voltage derivedfrom the non-averaged optical data is always lower than the SNRof the conventionally measured voltage data. The dashed (green)horizontal line indicates an SNR of 1. The DR can be determined for each curve by taking the ratio of the peak voltage tothe voltage where the curve crosses the green line. The DR alsodrops from 81 for the single-shot direct-voltage measurement to14 for the single-shot non-averaged optical measurement. However, when the replicated data are averaged, the SNR increasesby a factor of 16, yielding the curve marked with (red) squares.Over most of the DR of 56.2, the SNR of the averaged opticalsignal, which exceeds 800 at the peak, is higher than that whichcan be achieved with a conventional oscilloscope.The reason that the voltage derived from the non-averaged optical signal performs poorly and the SNR of the voltage derivedfrom the averaged optical signal degrades from the optical-pulsemeasurement can be traced to (4). Taking the derivative of (4)and multiplying bywith respect to the optical poweryieldsAuthorized licensed use limited to: UNIVERSITY OF ROCHESTER. Downloaded on March 04,2010 at 15:21:25 EST from IEEE Xplore. Restrictions apply.(5)
DONALDSON et al.: AN OPTICAL REPLICATOR FOR SINGLE-SHOT MEASUREMENTS AT 10 GHz WITH A DYNAMIC RANGE OF 1800:1Fig. 6. The measured input voltage (black) dashed line is nearly identical tothe input voltage derived from the optical pulse (blue) solid line. The red dottedcurve is the difference between the measured and derived curves multiplied byten.195In this work, an optical replicator has been constructed that acquires single-shot pulses with a dynamic range of 1800:1, extending the capabilities of conventional oscilloscopes. The device can be used to measure optical pulses that have been shapedby an electric pulse in an EOM. The optical signal can be used toinfer the shape of the electrical pulse. The high DR and SNR ofoptical pulse ensures that the inferred electrical pulse shape hasa higher SNR than an electrical pulse directly measured with aconventional electronic oscilloscope. The optical replicator preserves the high bandwidth of the system.To move from a demonstration system to a working device,it will be necessary to move to the telecommunication bandsat either 1.3 m or 1.55 m. These wavelength ranges havea wide range of affordable, off-the-shelf components for theEOM, splitters, and amplified laser. In addition, the availabilityof wavelength-division-multiplexing components means thesystem can be operated at multiple wavelengths simultaneously,thus further increasing the number of replicas that are averaged.REFERENCESFig. 7. The measured SNR of the single-shot input voltage, inferred from theaveraged optical output (red squares) is greater than that of the directly measuredinput voltage (blue triangles). The form of the SNR curve is governed by theideal response of the EOM (solid red line). Without averaging the SNR of theEOM output (light blue x’s) is always less than the directly measured voltageinput. The green horizontal line represents an SNR of 1.This equation relates the variation in the inferred voltage signalto the measured in the optical signal. Using the fitted relation,can be deship of the purely optical SNR to givetermined and used to generate the solid black curve in Fig. 7.This curve closely matches both the form and amplitude of theSNR of the voltage inferred from the optical measurement [(red)squares]. Therefore, the degradation in the SNR can be tracedto the mapping function given by (4).III. CONCLUSIONManufacturers of conventional electronic oscilloscopes havesteadily increased the bandwidth of their machines. However,the analog-to-digital converters have remained fixed at 8 bits,giving a maximum possible dynamic range (DR) of 256:1 forsingle-shot events. In practice, the noise floor limits the DR toabout 32:1 or five ENOB’s. Multi-shot averaging increases theENOB, but that option is not available for single-shot events.[1] G. C. Valley, “Photonic analog-to-digital converters,” Opt. Express, vol.15, pp. 1955–1982, 2007.[2] D. H. Auston, “Picosecond optoelectronic switching and gating in silicon,” Appl. Phys. Lett., vol. 26, pp. 101–103, 1975.[3] J. A. Valdmanis, G. Mourou, and C. W. Gabel, “Picosecond electrooptic sampling system,” Appl. Phys. Lett., vol. 41, pp. 211–212, 1982.[4] A. Johnstone, M. F. Lewis, and J. D. Hares, “Optical replication technique for wideband transient waveform digitization,” in Fabrication,Testing, Reliability, and Applications of Semiconductor Lasers III, M.Fallahi, K. J. Linden, and S. C. Wang, Eds. Bellingham, WA: SPIE,1998, vol. 3285, pp. 209–216.[5] Digital Phosphor Oscilloscopes and Digital Serial Analyzers, Tektronix, Inc., Beaverton, OR.[6] J. R. Marciante, W. R. Donaldson, and R. G. Roides, “Averaging ofreplicated pulses for enhanced-dynamic-range single-shot measurement of nanosecond optical pulses,” IEEE Photon. Technol. Lett., vol.19, pp. 1344–1346, 2007.[7] S. Gupta and B. Jalali, “Time-warp correction and calibration in photonic time-stretch analog-to-digital converter,” Opt. Lett., vol. 33, pp.2674–2676, 2008.[8] J. H. Kelly, L. J. Waxer, V. Bagnoud, I. A. Begishev, J. Bromage, B.E. Kruschwitz, T. J. Kessler, S. J. Loucks, D. N. Maywar, R. L. McCrory, D. D. Meyerhofer, S. F. B. Morse, J. B. Oliver, A. L. Rigatti,A. W. Schmid, C. Stoeckl, S. Dalton, L. Folnsbee, M. J. Guardalben,R. Jungquist, J. Puth, M. J. Shoup, III, D. Weiner, and J. D. Zuegel,“OMEGA EP: High-energy petawatt capability for the OMEGA laserfacility,” J. Phys. IV France, vol. 133, pp. 75–80, 2006.[9] J. R. Marciante and J. D. Zuegel, “High-gain, polarization-preserving,Yb-doped fiber amplifier for low-duty-cycle pulse amplification,” Appl.Opt., vol. 45, pp. 6798–6804, 2006.[10] A. V. Okishev and J. D. Zuegel, “Highly stable, all-solid-state ND:YLFregenerative amplifier,” Appl. Opt., vol. 43, pp. 6180–6186, 2004.[11] T. R. Boehly, R. S. Craxton, T. H. Hinterman, J. H. Kelly, T. J. Kessler,S. A. Kumpan, S. A. Letzring, R. L. McCrory, S. F. B. Morse, W.Seka, S. Skupsky, J. M. Soures, and C. P. Verdon, “The upgrade tothe OMEGA laser system,” Rev. Sci. Instrum., vol. 66, pp. 508–510,1995.[12] A. T. Young, “Photomultipliers: Their cause and cure,” in Methods ofExperimental Physics, N. Carleton, Ed. New York: Academic Press,1974, vol. 12, Astrophysics, Part A: Optical and Infrared, pp. 74–75.[13] Digital Storage Oscilloscope, TDS6000B/C Series, Tektronix, Inc.,Beaverton, OR [Online]. Available: http://www2.tek.com/cmswpt/psdetails.lotr?ct PS&cs psu&ci 13458&lc EN[14] M. P. Tranchemontagne, Tektronix, Inc., private communication, 2008.[15] Wide Bandwidth, High Optical Power, Low Distortion InGaAs PINPhotodiodes, Discovery Semiconductors, Ewing, NJ [Online]. Available: ption.php[16] IEEE Standard for Terminology and Test Methods for Analog-to-Digital Converters, IEEE Std. 1241–2000, 2001, New York.Authorized licensed use limited to: UNIVERSITY OF ROCHESTER. Downloaded on March 04,2010 at 15:21:25 EST from IEEE Xplore. Restrictions apply.
196IEEE JOURNAL OF QUANTUM ELECTRONICS, VOL. 46, NO. 2, FEBRUARY 2010William R. Donaldson (M’80) attended CarnegieMellon University and received the B.S. degree inphysics and mathematics with University Honors in1976. He received the Ph.D. from Cornell Universityin electrical engineering in 1984 on the use of organiccrystals for an optical parametric oscillator.After graduating in 1984, he joined the Laboratoryfor Laser Energetics at the University of Rochesteras a Research Associate. In 1986 he was promoted toStaff Scientist. In 2009 he was appointed Professor ofElectrical and Computer Engineering in the University of Rochester’s ECE Department. His research interests have included thephysics of photoconductive switches, streak-camera development, the opticalresponse of high temperature superconductors, optical semiconductor diagnostics and the florescence of biological molecules. He holds four patents and haspublished several scientific papers.Dr. Donaldson is a member of the American Physical Society, the OpticalSociety of America, and the Institute of Electrical and Electronic Engineers.John R. Marciante (M’00) received the B.S. degreein engineering physics from the University of Illinois at Urbana-Champaign in 1991 and the M.S. andPh.D. degrees, both in optics, from the University ofRochester, in 1992 and 1997, respectively.In 1991, he joined the Air Force ResearchLaboratory, where he worked on high-brightnesssemiconductor lasers and fiber amplifiers, andcoherent beam combination. In 2001, he joinedCorning Rochester Photonics Corporation, wherehe worked on high-index-contrast waveguides,metal-free diffraction gratings, and precision liquid crystal cells. Since 2003,he has been with the University of Rochester, Laboratory for Laser Energetics,where his work is focused on large-mode-area fibers, high-energy fiber amplifiers, single-frequency fiber lasers, all-fiber optical components, and precisionfiber optic systems. In 2006, he earned a joint appointment as AssociateProfessor of Optics at the University of Rochester, Institute of Optics.Prof. Marciante is a member of the Optical Society of America and the IEEELasers and Electro-Optics Society, and has served two terms as Topical Editorfor the Journal of the Optical Society of America B. He has also held positions asAdjunct Professor at the University of New Mexico, Electrical and ComputerEngineering Department, and as Chairman for the IEEE/LEOS AlbuquerqueChapter. He is currently the Chairman of the Fiber Modeling and FabricationTechnical Group of the Optical Society of America.Richard G. Roides has been a Senior Engineer atthe University of Rochester’s Laboratory for LaserEnergetics since 1993. He has over 25 years experience in solid-state and fiber lasers. He had previously worked at Standard Oil of Ohio in early 1979 to1983 in photovoltaic research using anamorphic silicon and excimer lasers. He also worked ten yearsat Hampshire Instruments developing high averagepower and high-repetition-rate laser sources for x-rayproduction for manufacturing integrated circuits. Hiscurrent work is focused on large-mode-area fibers,high-energy fiber amplifiers, and fiber oscillators used for optical pulse shapingand frequency conversion.Authorized licensed use limited to: UNIVERSITY OF ROCHESTER. Downloaded on March 04,2010 at 15:21:25 EST from IEEE Xplore. Restrictions apply.
IEEE JOURNAL OF QUANTUM ELECTRONICS, VOL. 46, NO. 2, FEBRUARY 2010 191 An Optical Replicator for Single-Shot Measurements at 10 GHz With a Dynamic Range of 1800:1 William R. Donaldson, Member, IEEE, John R. Marciante, Member, IEEE, and Richard G. Roides A