Transcription
Journal of Applied Technology and Innovation (e -ISSN: 2600-7304) vol. 4, no. 4, (2020)34Machine Learning Model for PredictingPotential Donors Using Logistic RegressionSeow Wei LingSchool of ComputingAsia Pacific University of Technologyand Innovation (APU)Kuala Lumpur, Malaysiatp057859@mail.apu.edu.myNowshath K BatchaSchool of ComputingAsia Pacific University of Technologyand Innovation (APU)Kuala Lumpur, Malaysianowshath.kb@apu.edu.myAbstract—Natural calamities like hurricanes, tsunami andpandemic are tend to happen so often in today’s world. Underthis scenario, predictive modelling is helpful in terms ofresources allocation to achieve the objective effectively. Thisstudy intends to construct a prediction model based on logisticregression to predict the possible donors who can help in suchtragic situations. Sample dataset is taken from internet source.Initial data exploration being performed to better understandthe variables in dataset. To improve the quality of dataset,missing value treatment and feature engineering are performedbefore the construction of prediction model. During the missingvalue treatment, various methods being applied with meanimputation has the better performance in terms of variablesignificance and standard error. Feature engineering includingone-hot encoding, categorical grouping, multicollinearitytreatment and log transformation being performed. During themodelling phase, normal logistic regression and stepwise logisticregression being performed. The performance of the models wasmeasured by Accuracy, Sensitivity and Specificity of thetraining and testing dataset. The Stepwise Logistic Regressionoutperformed the normal Logistic Regression with modelaccuracy at 58.5% along with sensitivity rate of 54.3% andspecificity rate of 62.6%Keywords—Machine Learning,Recommender System & Feature Extraction.Keywords—machine learning, potential donors, logisticregression, multiple linear regressionI.INTRODUCTIONPrediction modelling is effective to identify possible donorand to allocate manpower in contacting people who are morelikely to donate. Apart from that, predictive model such aslogistic regression, decision tree or neural network can helpanalytical team in understand the relationship betweenvariables in the dataset. As the target variable will be binary,logistic regression will be utilized in this study in predictingthe possible donors.Logistic regression is similar to multiple regressionanalysis as it utilizes one or more independent variable(s) inpredicting a single target variable. Logistic regression isspecialized form of regression used to predict binarycategorical variable by utilizing logit model in predicting theprobability of a particular even existing. Logistic regression isless affected by the heteroscedasticity issue as compared toother multivariate methods such as discriminant analysis. Onthe other hand, empirical results for logistic regression isRajasvaran LogeswaranSchool of Computing,Asia Pacific University of Technologyand Innovation (APU)Kuala Lumpur, Malaysialoges@ieee.orgeasier to interpret as they are parallel with the multipleregression model’s results [1].Before building a model, data pre-processing such as datacleaning, data transformation and dimension reduction isimportant in improving the quality of the raw dataset. A fewmodels based on different data pre-processing methods willbeing built, the model performance is then measure andcompare by several criteria.II.LITERATURE REVIEWEvidences exists to substantiate that many studies are donein understanding the factors influencing donators’ behavior inapplying regression analysis. The study shows that donationseasons such as Ramadan have significant impact on thewillingness to donate. On the other hand, demographic factorssuch as social class, marital status and education level alsoplay important role in affecting the monetary donations. [2]performed Multiple Linear Regression (MLR), SupportVector Regression (SVR) and Artificial Neural Network(ANN) in predicting the amount of charitable giving in thefollowing years. ANN outperformed MLR and SVR withlowest MSE of 0.01 with three most significant independentvariables: population, education level and the charitableamount in previous year. Degasperi & Mainardes [3] hadconducted research to understand donor’s behavious in Brazilthough questionnaire. They utlized exploratory factor analysisand concluded that factors such as environmental influences,personal benefits, future interest, beneficiaries’ characteristicsare important factors that motivate individual moneydonation. Snipes et al [4] concluded that charity reputation isimportant factor in determine the willingness of an individualin donating.Binary classification task involves classifying theobservations into two distinct groups through several differentalgorithms. Some common classification problems includediagnosis of certain disease, fraud detection and responses onevents. There are several algorithms that are widely use whenbuilding prediction model for binary classification such asLogistic Regression, Decision Trees, Support VectorMachine, Naïve Bayes and k-Nearest Neighbours. Theperformance of the algorithm can be varying on differentdataset. Studies often applied several machine learningalgorithms when building the prediction models and further
Journal of Applied Technology and Innovation (e -ISSN: 2600-7304) vol. 4, no. 2, (2020)evaluate the best model based on several criteria such asaccuracy, sensitivity rate and specificity rate.Dwivedi [5] constructed a prediction model for heartdisease dataset by applying Artificial Neural Network (ANN),Support Vector Machine (SVM), Naïve Bayes, LogisticRegression, k-Nearest Neighbour and Classification Tree.Logistic Regression outperform all other models by accuracyof 85% with 89% sensitivity rate and 81% specificity rate.Another study on predictive model for heart disease [6],Decision Tree outperformed Logistic Regression withaccuracy of 84%.35will be plot for better visualization purpose. The MACROfunction is being created in this step to eliminate the repetitivesteps required to run the PROC UNIVARIATE, PROCFREQUENCY PROC SGPLOT and PROC GCHART foreach variable. The metadata of the dataset is given in Table 1.TABLE I.METADATA OF DATASETNo.VariableVariable Type1DonorCategorical2D IDInput3Donor There are several common approaches to improve theperformance of prediction model. At data pre-processingstage, proper handling of missing value and outlier, featureengineering and feature selection enable the elimination ofnoise in the dataset. When building the model, hyperparameters tuning can effectively improve the performance ofthe predictive model. On the other hand, ensemble method iswidely used to improve the predictive results by combiningmultiple algorithms to produce one optimal prediction rete18CallCntCardP1DiscreteThere are several studies done in predicting diabetesdiagnosis based on Pima Indians Diabetes Dataset by logisticregression. Wu et al [9] utilized K-means Algorithm for datapre-processing and able to build logistic prediction model withaccuracy of 95.42%. Zhu et al. [10] further enhanced theprediction model by applying Principal Component Analysis(PCA) for dimensionality reduction purpose. With PCA andK-means clustering, and also they build another logisticregression prediction model on same dataset with higheraccuracy at 97.4%.19CallCntCardAllDiscrete20Donor StatusCategorical21Donor Status Prev meValueContinuous27AreaMedIncomeContinuousOn the other hand, Logistic Regression is often used forcredit card fraud detection along with other binaryclassification algorithms. Patil et al [7] built a predictionmodel for credit card fraud dataset with Random Forest at76% accuracy rate outperformed Decision Tree and LogisticRegression. Similarly, another study based on European bankdata set also resulting in Random Forest performs better with95.5% accuracy by VS & Deepthi Kavila [8]. However toconclude that Logistic Regression model performed better forfraudulent prediction with accuracy of 91.2%.Taslimitehrani et al [11] improve the logistic regressionprediction model for Heart Failure survival rate by combiningthe logistic regression model with loss function. The studysuccessfully improves the prediction accuracy from 89%(Logistic Regression) to 91.4%. On the other hand, Votetechnique by combining Logistic Regression with NaïveBayes in building prediction model for cardiovascular disease.The Vote technique outperform other seven machine learningtechniques with the highest accuracy of 87.4% which is 1.54%higher than the original logistic regression built.III.DATASET & PRE PROCESINGData preprocessing is done using SAS University edition.For continuous variables, univariate analysis will beperformed in SAS Studio by PROC UNIVARIATE. Itprovides complete report on the variables that useful for dataexploration purpose. For categorical variables, PROCFREQUENCY will be utilized to observe the distribution ofeach category for individual variable. Pie chart and bar chartfor the frequency distribution for each categorical variableGenerally, missing values can be categories into 3 maintypes: missingness completely at random (MCR), missingnessat random (MAR), and missingness that depends onunobserved predictors (MNAR). MCAR indicates that themissing value pattern is completely random and unrelated toall the variables including itself. MAR refers to missing valuepattern that is unrelated to the missing variable itself butsomehow related to other variables in the model. On the otherhand, MNAR implies that the missing pattern is related to thevariable itself. It is important to understand the type of missingdata before deciding on the missing value treatment to beimplement.There are several more commonly used missing valuetreatment such as Complete Case (CC), single imputation andmultiple imputation. Complete Case method removesobservations with missing values where single imputationreplace the missing value without defining explicit model.Multiple imputation will be more complex as it is a
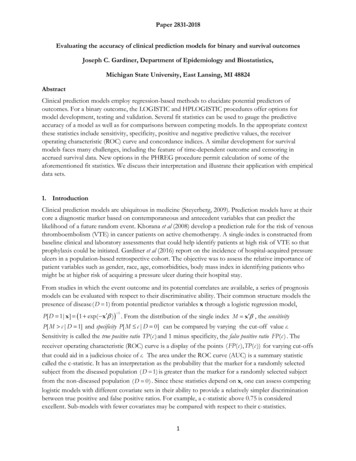
Journal of Applied Technology and Innovation (e -ISSN: 2600-7304) vol. 4, no. 2, (2020)simulation-based process which includes imputation phase,analysis phase and pooling phase. However, the efficiency ofmissing value handling methods might differ for different typeof missing value. The percentage of missing value also servesas another important indicator in deciding the missing valuetreatment options.monotone as shown in Fig 4. Fig 5. show the comparisonbetween the 3 different Multiple Imputation models:Complete case analysis or listwise deletion deleteobservations with missing value(s). This is easy to apply butit might reduce the statistical power of a dataset as theobservations become lesser. Complete Case (CC) should onlybeing applied to missing value with MCAR pattern to avoidbias in the dataset. By applying PROC LOGISTIC, listwisedeletion will automatically being performed before the modelis build.Fig. 2. Before and After Mean ImputationFig. 1. Logistic Regression Output (Complete case)From Fig 1., there are only 3,212 observations being usedfor the logistic regression model after list wise deletion.Overall, the model has 56% of prediction accuracy with 53.1sensitivity and 58.8 specificity. On the other hand, the modelhas c value (area under ROC curve) of 0.636.For the variables AGE AREAHOMEVALUE andAREAMEDINCOME, mean imputation will being use in thissection. New dataset being created and named as “Meanimputation” to capture the data after the mean imputation.Fig. 3. Logistic Regression Output (Mean Imputation)Mean imputation often reduces the variance of the imputedvariables as all the missing value being replaced by the mean.Fig 2. shows the standard deviation of the 3 variables beforeand after mean imputation.Fig 2. and 3, shows the result for the logistic regression onthe Mean imputation dataset. Overall, the model has 56.2%accuracy with 50.7% sensitivity and 61.4% specificity.Multiple imputation (MI) consists of three main phases:imputation phase, analysis phase and pooling phase. Duringimputation phase, the missing value are replaced withestimated values and repeated several times depending on theuser’s configuration. The performance of the imputation willbeing evaluate using any statistical method of interest. Thecoefficients obtained from the imputed dataset being utilizedfor the missing value imputation at pooling phase. Beforeperforming MI, it is important to discover the missing datapattern. By specifying nimpute 0 for proc mi, the missingdata pattern can be obtained. The missing data pattern is non-36Fig. 4. Missing data pattern
Journal of Applied Technology and Innovation (e -ISSN: 2600-7304) vol. 4, no. 2, (2020)37After predicting the results through by the logisticregression on testing dataset, the classification table is beingbuilt by comparing the Donor (target variable) with theI Donor (predicted target variable.For the testing dataset, the accuracy is slightly lower ascompared to the training dataset at 56.4%. This is due to thetesting data is data that unseen by the model and it is normalto have testing accuracy which is lower than training accuracy.Fig. 5. Comparison for Multiple Imputation ModelsIV.EXPERIMENTATIONAfter the data pre-processing, the data is being split intotraining and testing dataset with ratio of 70:30 Training datasetconsists of 3,394 (70%) observations whereas testing datasetconsists of 1,455 (30%) observations. Fig 6. shows the outputfor the stepwise logistic regression model. The model stoppedat stage 6 as there is no additional effects met the 5%significant level for entry. However, Stepwise LogisticRegression performed better at accuracy rate of 58.5% withonly 6 independent variables in the model. The built logisticregression model with 5 independent variables that aresignificant at critical value of 5%. On the other hand, themodel has accuracy of 57.7%, sensitivity of 53.5% andspecificity of 61.8% shown in Fig 7.Fig 8. shows the overall process of data pre-processingand final model building based on Logistic Regression andStepwise Logistic Regression. The stepwise logisticregression performed better in terms of accuracy, sensitivityand specificity for both training and testing dataset. Thus, thestepwise logistic regression model is being utilized to predictthe DONOR variable in the validation datasetFig. 8. Summary for Model BuildingV.Fig. 6. Output for Stepwise Logistic RegressionFig. 7. Logistic Model OutputRESULTSThe study focuses on various method of data preprocessing and dimension reduction to improve the logisticregression performance. Initial data exploration is importantto understand the nature of each variable in the dataset. Forvariable AGE, there are few individuals with age below 8 withhigh values of AreaMedIncome and DONTimeFirst which isconsidered abnormal. For DONAvgCardP1 (average amountdonated with the help of references for last 36 months with thehelp of references), there are 18.42% missing value. Thevariable is then being compared to the donation frequency,DONCntCardP1 and concluded that the missing values are allindicating 0 as with donation frequency 0.The donation dataset with few variables with missing value.Unlike Decision Tree or Neural Network model, LogisticRegression could not take missing value in the regressionequation and thus observations with missing value will beremoved by default. Thus, several common missing valuetechniques such as mean imputation, complete case, multipleimputation and single imputation being applied for themissing value treatment. By comparing the standard error andsignificant of the variable after missing value imputation,mean imputation performs better as compared to othermethods in this dataset.Before building any prediction model, proper featureengineering on the dataset can helps to improve the
Journal of Applied Technology and Innovation (e -ISSN: 2600-7304) vol. 4, no. 2, (2020)performance of the prediction model. In this study, categoricalgrouping is performed for Donor status (consists of 6 classes)and DemArea (consists of 54 classes). The grouping for theclasses depending on their likelihood in donating. After thegrouping, the accuracy of the prediction model increases from56.2% to 58.1%.The study further explores the intercorrelation between theindependent variables. By stepwise removal, 5 variables thatcause the multicollinearity issues being removed. The removalof the variables reduces the model accuracy slightly by 0.6%.The slight decrease in accuracy is acceptable asmulticollinearity issue can lead to imprecise estimates ofcoefficient values for the model. The data pre-processingcontinued with log transformation to transform skewed dataand to reduce the data variability for variable with outliers.The log transformation successfully reduced the skewness andkurtosis for the six variables in the dataset. When comparedbefore and after log transformation, the prediction accuracyslightly increased by 0.2%. This indicates that unlike othermultivariate analysis, Logistic Regression is less affected bythe normality assumption.When building prediction model, the dataset beingpartitioned into training and testing dataset with ratio of 70:30.70% of the data is being allocated for training as it providesmore examples for the algorithms to learn in building theprediction model. The logistic regression model built hasaccuracy of 57.7% on training dataset and 56.4% on testingdataset. However, the model only consists of 5 variables thatare significant at 0.05 critical value in explaining the targetvariables.As parsimony is concern, the most representative variableswere being chosen in Stepwise Logistic Regression. This is toenable the model to be train fast under acceptable range ofmodel’s accuracy. The Stepwise Logistic Regressionconstructed with 58.5% accuracy on training dataset and56.9% on testing dataset. In terms of sensitivity andspecificity, Stepwise Logistic Regression also outperformednormal Logistic Regression on both training and testingdataset. Under Stepwise Logistic Regression, DonCntP1,DonAvgAll, DONTimeLast, Donor status Prev Camp,DEMAREA 1 and DEMAREA 4 have significant impact onthe likelihood of individual in donating. DonAvgAll,DonCntP1 and DemArea 4 have negative relationship onlikelihood of individual in donating while DonCntP1,Donor Status Prev Camp and DemArea 1 have positiverelationship on the likelihood of individual in donating.The accuracy for the final model at 58.5% is relatively lowas compared to other logistic regression model discussed inSection 2. With all the data pre-processing and stepwiseregression, the accuracy of the model merely increased by2.2% from 56.3% (complete case) to 58.5% (stepwise logisticregression). At this point, other machine learning algorithmssuch as decision tree, random forest or neural network can beconsidered as they might provide higher prediction accuracy.VI.CONCLUSIONIn this study, a prediction model to identify possible donoris being built by considering different options for data pre-38processing. Prediction model is effective when comes tomanpower allocation as the organization able to prioritizepossible donor rather than contacting each of them. This alsoenable the organization to achieve their objectives withminimal time and manpower allocated. Thus, a predictionmodel with higher accuracy will be preferred for theorganization.Other than model accuracy, sensitivity and specificity ratealso another concern for the organization. Test sensitivitymeasures the ability of the model in correctly identify donorswhere test specificity measures the ability of the model incorrectly identify non-donors. When Sensitivity rate is low,the model tends to have high number of False Negative, whichis classifying the donors as non-donors. This will cause thereal donor not being prioritize and donation is not obtainedfrom them. On the other hand, low specificity indicates themisclassification of non-donor to donor. This will waste themanpower in contacting them as non-donor are less likely todonate as compared to donor. Both scenarios are equallycostly for this case, thus the final prediction model adoptedalso considering the Specificity and Sensitivity rate.REFERENCES[1]Hair Jr, J. F., William, C., Babin, B. J., & Anderson, R. E. (2014).Multivariate Data Analysis Joseph F . Hair Jr. William C. BlackSeventh Edition. Pearson Education Limited.[2] L. Farrokhvar, A. Ansari, B. Kamali, “ Predictive models for charitablegiving using machine learning techniques,” PLoS ONE. 13 (10). pp. 1–14, 2018.[3] N. C. Degasperi and E. W. Mainardes, “What motivates moneydonation? A study on external motivators,” Rev. Adm., vol. 52, no. 4,pp. 363–373, 2017.[4] R. Snipes and S.Oswald, Charitable giving to not-for-profitorganizations: factors affecting donations to non-profit organizations.Innovative Marketing,vol. 6, pp.73-80, 2010.[5] A. K. Dwivedi, ‘‘Performance evaluation of different machine learningtechniques for prediction of heart disease,’’ Neural Comput. Appl., vol.29, no. 10, pp. 685–693, 2018.[6] J. J. Beunza, E. Puertas, E. García-Ovejero, G. Villalba, E. Condes, G.Koleva, C. Hurtado, and M. F. Landecho, ‘‘Comparison of machinelearning algorithms for clinical event prediction (risk of coronary heartdisease),’’ J. Biomed. Informat., vol. 97, Sep. 2019[7] S. Patil, V. Nemade, and P. Soni, “Predictive Modelling for Credit CardFraud Detection Using Data Analytics,” Procedia Computer Science132, pp. 385-395, 2018[8] S. V. S. S. Lakshmi and S. D. Kavilla, ‘‘Machine learning for creditcard fraud detection system,’’ Int. J. Appl. Eng. Res., vol. 13, no. 24,pp. 16819–16824, 2018.[9] H. Wu, S. Yang, Z. Huang, J. He, and X. Wang, ‘‘Type 2 diabetesmellitus prediction model based on data mining,’’ Inform. Med.Unlocked, vol. 10, pp. 100–107, Aug. 2018.[10] C. Zhu, C. U. Idemudia, and W. Feng, ‘‘Improved logistic regressionmodel for diabetes prediction by integrating PCA and K-meanstechniques,’’ Informat. Med. Unlocked, vol. 17, 2019, Art. no. 100179.[11] V.Taslimitehrani, G. Dong, N. L.Pereira, M. Panahiazar, J. Pathak ., “Developing EHR-driven heart failure risk prediction models usingCPXR(Log) with the probabilistic loss function,” Journal ofBiomedical Informatics. pp.260–269, 2016.Available from: http://dx.doi.org/10.1016/j.jbi.2016.01.009
building prediction model for binary classification such as Logistic Regression, Decision Trees, Support Vector . as another important indicator in deciding the missing value treatment options. Complete case analysis or listwise deletion delete obse