Transcription
futures.io October 30, 2018Patterns onthe OpenAl BrooksHow to Trade Price ActionBrooks Trading CourseBrooksTradingCourse.comBrooksPriceAction.com
Main Points Trends From The Open: 20% of daysSlide2 80% of days have reversal on open (1st 90 min)6 How to enter, place stop, and exit9 4 Patterns: Gap down, Buy Climax15 Gap down, Buy Climax, but fails (bull BO)18 Gap down, Sell Climax20 Gap down, Sell Climax, but fails (bear lide 1
GapGapDownDownandandststBullTrendfromthe1Bull Trend From The 1 BarBar
Gap Down: Bull Trend From The OpenToday, only talking about “Gap Down” opensThis is an open below yesterday’s closeor below the 20 bar EMAGap up is oppositeOnly 20% of days trend up or downall day from the open5/4/18(about once a week)ExitAs long as bull trend,B above bull bar closing near its HFailed BO below yesterday’s TRB above bull bar closing near its HTrend From The Open Bull lide 3
GapGapDownDownandandststBullTrendfromthe1Bear Trend From The 1 BarBar
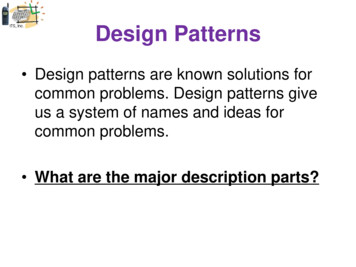
Sell Climax: Usually Bad Follow-Through Next DayGap downTrend from the Open bear trendSell The Close, bear Micro Channel1st 2 bars are bear bars, 2nd bar closing near LBoth have good size bodiesSell the close of 2nd bar or below 2nd barAs long as strong bear trend,sell below bear bars closing near their L9/25/14By close of 2nd bar closing near L,60% chance of MM down from open of 1st barto close of final bar of bear e 5
Downand80% ofGapOpensHaveReversalsstBull Trend from the 1 Bar
BO on Open: 50% Reverse, No Matter How StrongMarket looks for direction early in dayTries one way, but even strong BO fails50% of timeStrong selloff on openBecame low of t of support or resistance can be very strongStill will reverse 50% of timeStrong rally on openBecame high of daySlide 7
Opening Reversal: Early Reversal at Support or Resistance80% of days test support orresistance in 1st 90 minutesReversal often becomeshigh or low of dayOften also some other patternCall it an Opening ReversalParabolic Wedge Top above last week’s highTrend From The Open lasting all dayOnly 20% of daysWedge Bottom below yesterday’s lowWedge Bear Flag at EMAThen, Double Top (DT)Double Bottom (DB) Bull Flag at EMA andyesterday’s closeReversal is usuallyDouble Top, Double Bottom,Wedge Top, or Wedge Slide 8
DownPlaceand Stop,How GapTo Enter,standExitBull Trend from the 1 Bar
Wait for Strong Signal Bar, Use Appropriate Protective StopTraders should enter most trades using stop ordersTo increase the probability of a profit, wait for a strong signal barWhen selling, wait to sell below a bear bar closing near its low5/21/18When buying, wait for a bull bar closing near its high and buy above that bar,not simply above the 1st bar with a bull ide 10
Wait for Strong Signal Bar, Use Appropriate Protective StopPut the protective stop just beyond the reversalFor example, if the buy signal bar is the low, put stop below that bar5/21/18StopIf the buy signal bar is the 2nd or even the 5th or 6th bar of a multi bar reversaland the 1st bar has a Lower Low, put the stop below the lowest de 11
Wait for Strong Signal Bar, Use Appropriate Protective StopStopStopS below bear bar closing on or near its L (often many good choices)Initial protective stop above top of reversalor above major LH, no matter which entry you iceAction.comB above bull bar closing on or near its H(often many good choices)Initial protective stop below bottom of reversal, or belowmajor Higher Low (HL), no matter which entry you takeSlide 12
Wait for Strong Signal Bar, Use Appropriate Protective StopStopStopBeginning traders should only be looking for swing trades,and they should mostly swing tradeThat means that they will typically take 1 – 3 trades a dayStop5/21/18StopOnce they are consistently profitable, they can take 3 – 10 trades a day,and they can add some scalps if they would ide 13
Wait for Strong Signal Bar, Use Appropriate Protective StopStopStopWith that in mind, I created a classification of patterns for swing traders4 versions of each: buy, sell, failed buy, failed sellAbout 100 basic patterns x 4 400 total sectionsStop5/21/18StopIf a trader recognizes what the market is doing,he can look at the examples of that pattern to get an idea of what might Slide 14
GapDownandGapDownstBullthe Climax1 BarandTrendRally fromto a Buy
Buy Climax: Any Strong Open Reverses 50% of Time2nd Leg Bull Trap and Micro Double Top (DT)28/31/181No bear bar in 1st 9 barsStrong Buying Pressure so bear trend unlikelyEither bull trend or TR daySelloff became bear leg in TR dayNo matter how strong an opening trend is,it will reverse 50% of the ide 16
Buy Climax on Open: Failed BO above Yesterday’s High2Buy Climax on openFailed BO above yesterday’s highWedge from yesterdayLow 2S below bear bar closing near its L1Yesterday’s H8/23/18Despite strong selloff,there were many early big bull bars closing near their highsTR more likely than big bear trendBears take profits above bull bars and bulls start to de 17
Gap DownGap Down andand Rally to a Buy Climax,stBull Trend from the 1 Barbut Became Bull Flag
Gap Down: Bull Trend From The OpenNo matter how strong an opening trend is,it will reverse 50% of the timeThen, 50% chance trend will resume!Failed Reversal down at MAbecame bull flag8/2/18Became bull flagB above bull bar closing on its HYesterday’s L8 consecutive bull bars on the open is rareStrong Buying PressureB above bull bars closing near their highsBig gap downBull trend from the openB above bull bar closing near its HBrooksTradingCourse.comBrooksPriceAction.comSlide 19
Gap DownandClimax,Gap Downand SellstBull Trendfrom the Up1 BarThen Reversed
Sell Climax: Reversal Day after ii (Consecutive Inside Bars)OpenExitYesterday’s LHL MTR11/2/17BrooksTradingCourse.comSell ClimaxOpening Reversal upii B signal barsBrooksPriceAction.comBull Reversal DayBear trend, then bull trendReversal day usually does not close far above openif initial selloff was strongIt is type of TR daySlide 21
Sell Climax: Reversal Up after Micro Double Bottom (DB)Exit11/15/17B 2nd failed BObelow yesterday’s de 22
Sell Climax: Reversal Up after 2nd Leg Bear TrapParabolic WedgeExit long, bears S1B HL MTRMicro DB2Last week’s LBrooksTradingCourse.comStrong B signal barB 2nd failed BO below yesterday’s low2nd Leg Bear Trap11/14/17S vacuum test of last week’s lowBrooksPriceAction.comSlide 23
Sell Climax: Failed BO below Yesterday’s Low4 big bear bars, but shrinking bodiesSelloff losing momentum9/4/18Yesterday’s LFailed BO below yesterday’s lowB above bull bar closing near its HBrooksTradingCourse.comBrooksPriceAction.comSlide 24
Sell Climax: Reversal Up from Parabolic Wedge BottomB above bull bar closing near its HBut, strong early selling so minor reversal upand not likely to reach H of day9/6/18ExitLL MTR3 bottom attempts so consecutive bottomsParabolic Wedge Sell Climax (tight channel with at least 3 lide 25
Parabolic Wedge Sell Climax: Micro Double BottomMicro DB9/5/18B above bull bar closing near its H12Bottom of gapon daily chartBrooksTradingCourse.comParabolic Wedge Sell ClimaxSell vacuum test of bottom of gap on daily chartReversed up from 1 tick aboveBig 3rd leg down so wait for Micro DB before buying3BrooksPriceAction.comSlide 26
Trend From The Open Bear Trend: Sell ClimaxTrend From The Open Bear TrendBecame TR DAY1/30/18HL MTRMicro DB, Parabolic WedgeB above neck line of Micro DB or above outside up de 27
Gap Down: Sell Climax5/3/18Higher probability to B above bull barthat closes near its HGap downWedge BottomB reversal e 28
Big Gap Down: Trend From The Open Bear Trend4 big bear bars closing near LTrapped bulls in and bears outBoth will S 1st reversal upAt least small 2nd Leg Down likely15/11/172BrooksTradingCourse.comFailed BO below yesterday’s L,Micro DB and LL DB2nd entry BB reversal up above bull bar closing on HBrooksPriceAction.comSlide 29
Big Gap Down: Sell Climax and Wedge BottomBig gap down andBear Trend From The OpenConsecutive Sell Climaxes8/15/18Failed BO below Wedge Bottom, became bigger WedgeB above bull bar closing near its HBrooksTradingCourse.comBrooksPriceAction.comSlide 30
Gap Down: Sell ClimaxBig reversal upDominant feature of dayso sideways to up likely16/15/182BrooksTradingCourse.comSell Climax and strong reversal upPossible bull reversal or 2nd Leg Bear Trap in TR dayB above bull bar closing near its HBrooksPriceAction.comSlide 31
Gap Down: Consecutive Sell Climaxes6/21/18Strong selloff, but Consecutive Sell ClimaxesFailed BO below Parabolic Wedge BottomB above bull bar closing near its HBrooksTradingCourse.comBrooksPriceAction.comSlide 32
Failed BO Low of Yesterday: 2nd Reversal UpOpening Reversal Down at MAWedge Bear Flag7/18/17BrooksTradingCourse.comFailed BO below yesterday’s L,2nd entry B so DBB reversal up above bull barLL MTR (every MTR is a DB)BrooksPriceAction.comSlide 33
Gap DownandClimax,Gap Downand SellstBullThenTrendBearfromResumedthe 1 Bar
Gap Down: Sell Climaxes, but Continued LowerGap down and consecutive Sell Climaxes1st leg up is likely Minor ReversalS again below bear bar closing near its LMost patterns work 40 – 60% of timeThat means they fail 40 – 60% of time!ParabolicWedge6/25/18Consecutive Wedge BottomsB above strong B signal de 35
Main Points Trends From The Open: 20% of daysSlide2 80% of days have reversal on open (1st 90 min)6 How to enter, place stop, and exit9 4 Patterns: Gap down, Buy Climax15 Gap down, Buy Climax, but fails (bull BO)18 Gap down, Sell Climax20 Gap down, Sell Climax, but fails (bear lide 36
futures.io October 30, 2018Patterns onthe OpenAl BrooksHow to Trade Price ActionBrooks Trading CourseBrooksTradingCourse.comBrooksPriceAction.com
BrooksTradingCourse.com BrooksPriceAction.com Trends From The Open: 20% of days 80% of days have reversal on open (1st 90 min) How to enter, place stop, and exit 4 Patterns: Gap down, Buy Climax Gap down, Buy Climax, but fails (bull BO) Gap down, Sell Climax Gap down, Sell Climax, but fa