Transcription
TABLE OF CONTENTSIntroduction .1Lab Safety.3Biochemical Oxygen Demand.4Coliform Lab .11Jar Test.16Lake Profile.20Noise Pollution .27Settleability of Solids.34Solid Waste.39Solids .43ii
INTRODUCTIONEnvironmental Engineering is a profession directly involved with the identificationand design solutions of environmental problems. Environmental Engineers aredirectly responsible for providing safe drinking water, minimizing and preventingpollution in rivers, lakes and oceans, treating and properly disposing of municipal,industrial and hazardous waste, and the remediation of contaminated soil andwater, among other charges of the profession. Understanding and mastering theart of Environmental Engineering requires the integration of biology, chemistry,physics, mathematics, computer science, laboratory analyses, andcommunication skills.The purpose of these experiments is to introduce you to various aspects ofEnvironmental Engineering through laboratory analysis that integrates hands-oninvestigation, data reduction and interpretation. Experiments include measuringconventional water and wastewater parameters as well as exploring the naturalenvironment. A more detailed description and professional standards for amajority of these experiments can be found in Standard Methods for theExamination of Water and Wastewater. Standard Methods, as this book is oftenreferred to, is a joint publication of the American Public Health Association, theAmerican Water Works Association and the Water Environment Federation.In each experiment, you will find material that relates to both the theory and thepractical application of the laboratory in engineering practice. The supplementalweb site for this manual is ironmental/Environ Frame.htmAt this site additional learning tools such as video clips, photographs, and sampledata sets are continually being added to illustrate key concepts of the laboratory.At this time, we are in the developmental stage of the site and the lab manual.We welcome and encourage the use of this material in your courses. We onlyrequest that you acknowledge us and let us know that you are using it. Feedbackfrom you is both appreciated and invaluable to the development of this project.Please contact us if you have any comments, suggestions or questions.Lizette R. Chevalier, Associate Prof., Department of Civil Engineering,SIUC, cheval@engr.siu.eduJames N. Craddock, Associate Prof., Department of Civil Engineering,SIUC, craddock@ce.siu.edu1
Partial support for this work is provided by the National Science Foundation's Course,Curriculum and Laboratory Improvement Program under grant DUE9952577. Additionalsupport is provided by Southern Illinois University Carbondale College of Engineering,College of Mass Communication and Media Arts and the Materials Technology Center.ENGINEERING
LAB SAFETYA more thorough review of laboratory safety is presented under General Topicfrom the web site. The purpose of this laboratory is to identify the location anduse of the following items in the laboratory. Review these items with your labinstructor prior to conducting any labs. Safety glasses Eye wash station Shower Latex gloves for BOD, Solids, Solid Waste and Coliform Labs Insulated gloves and tongs for muffle furnace Aprons Spill kit Fire extinguisher Material Safety Data Sheet (MSDS) Campus unit responsible for the pickup and disposal of waste; Explain useof request forms for pickup and the need for proper labeling.In this lab, all chemicals must be in labeled containers. The label on purchasedchemicals generally identifies the content adequately. However, when youprepare a reagent for use, it must be labeled as follows: The name of thechemical or reagent, the concentration, the date and your name. You arerequired to label every bottle used longer than one laboratory period.Figure 1: Example of proper labeling.3
BIOCHEMICAL OXYGEN DEMANDIntroductionIn characterizing wastewater and surface water, the amount of biodegradableorganics in the water is an important parameter. When these organics degrade inthe aquatic environment, dissolved oxygen is consumed. Since oxygen is notvery soluble in water (Table 1), a heavy loading of organics may deplete oxygenlevels, which in turn may lead to fish kills and anaerobic conditions. Althoughmost substances can also be degraded under anaerobic conditions, the processis slow and results in foul odors.Biochemical oxygen demand, or BOD, is a test to measure the consumption ofdissolved oxygen due to biological degradation of organic materials and chemicaloxidation of inorganic materials. In fact, BOD is used as an indicator to determinecompliance with wastewater discharge permits, in the design of wastewaterfacilities, to monitor plant performance, and to determine the approximatequantity of oxygen required to biologically stabilize or oxidize organic matter.BOD is also an important parameter in models that estimate the assimilativecapacity of the receiving body of water.The standard measurement is the BOD after five days (BOD5), although BOD7 isalso used to correspond with work schedules, especially at smaller plants. In thisprocedure, dissolved oxygen is measured initially and after a 5 (or 7) dayincubation period. The BOD measured during this period is the carbonaceousBOD, since the bacteria that oxidize nitrogen are not in sufficient numbers toinfluence oxygen consumption until approximately seven days. However, it iscommon practice to use a nitrogen inhibitor. Seeding and dilution of samples arecommonly used to ensure an acceptable change of dissolved oxygen occurs.Bacterial growth requires nutrients, including nitrogen, phosphorus and tracemetals. These nutrients are added to dilution water, which is also buffered toensure that the pH of the sample remains suitable for the bacteria. Oxygenconsumed after 60-90 days of incubation is used to determine the ultimate BOD.Continuous oxygen uptake can be used to determine the kinetics of degradation,utilizing analysis tools such as the Thomas Method.4
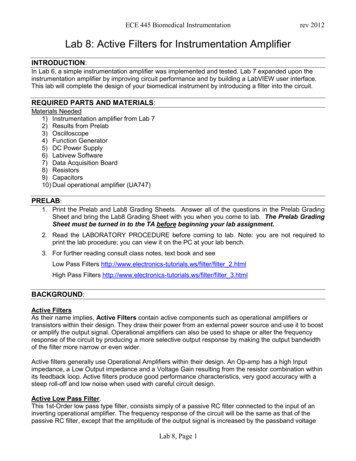
Table 1: Saturation of Dissolved Oxygen in Distilled WaterTemperature ºCSolubility (mg/L)Temperature ºCSolubility 1410.3307.61510.1ApplicationThe following figure shows a basic treatment train found at municipal wastewatertreatment facilities. In this laboratory, you will be measuring the BOD of theinfluent and the effluent. One of the primary objectives of municipal wastewatertreatment is the reduction of BOD in the effluent, which is released into areceiving body of water.5
Figure 1: Generalized schematic of a wastewater treatment facility.Materials and Equipment Standard BOD bottles with ground glass stoppers (300 mL). Paraffin wrap. Dissolved oxygen meter with appropriate DO probe. Wide tipped volumetric pipet. Magnetic stirrer if DO probe does not have a stirrer built in. Incubator: thermostatically controlled with a temperature of 20 C 1 C. Alllight must be excluded form the samples during incubation. Dilution water prepared by instructor. Glucose-glutamic acid solution prepared by instructor. Influent and effluent sample of wastewater from a local municipalwastewater treatment facility. Obtain the effluent sample prior todisinfection so that dechlorination and seeding will not be required in thislaboratory.ProcedureSamples should be used within 48 hours of collection. Samples should be storedat approximately 4 C to ensure that oxygen concentrations remain constant. Inaddition, samples should be incubated in the dark to prevent oxygenreplenishment from photosynthesis. Prior to use, the sample must be brought toroom temperature. The pH of samples must be between 6.5 and 7.5 to ensurebiological growth. The pH of samples can be adjusted with a solution of sulfuricacid (H2SO4) or sodium hydroxide (NaOH). To increase the pH of a sample, youneed to add a base. In Standard Methods, the pH of a BOD sample is increasedby adding sodium hydroxide (NaOH). Dissolve 40 g sodium hydroxide in distilledwater. Dilute to 1 L.6
Since the actual BOD5 is not known, several dilutions must be prepared andtested. Typical municipal influent wastewater has a BOD5 of 150-350 mg/L,whereas the effluent ranges between 10-40 mg/L. For this laboratory, preparethree dilutions of each sample. Use Table 2 to determine the required dilutions.Prepare one dilution in the appropriate range, then one below and above.Using the effluent sample, prepare two BOD bottles at each of the three dilutions.To prepare the dilution, place the required amount of sample in the bottle.Completely fill the remainder of the bottle with dilution water, taking care not toentrap air bubbles. Place the glass stopper on the bottle, allowing for a smallamount of water to spill off the bottle. There should be a water seal remaining inthe lip area. This water seal will prevent oxygen from entering the bottle. As anadditional precaution, wrap a piece of paraffin wrap over the top of the bottle.Repeat this procedure for the influent sample. Use one set of each dilution tomeasure the initial DO, and incubate the other set. Place the remaining sixbottles (three influent and three effluent dilutions) in the incubator. Record thetime and date. As with the samples collected from the treatment facility, theseprepared samples must be kept in the dark to prevent oxygen replenishmentfrom photosynthesis and at a constant temperature of 4 C to ensure that oxygenconcentrations remain constant.Table 2: Dilution ranges for pipetting into 300 mL BOD bottles.Sample Volume(mL)Minimum BOD(mg/L)Maximum 10062420031230028After the required incubation period (5 or 7 days), remove the BOD bottles fromthe incubator and measure the final dissolved oxygen levels.7
Check the dilution water blank to be certain that the DO uptake (DOinitial – DOfinal)was not more than 0.2 mg/L. If the value is above 0.2 mg/L, the results aresuspect. A valid dilution is one that has a final DO greater than or equal to 1mg/L and a DO uptake of at least 2 mg/L.Place 6 ml of the glucose-glutamic acid standard in two BOD bottles. Then add15 mL of wastewater effluent for seed. Fill the remainder of the bottle with dilutionwater. Use one bottle to determine the initial DO. Incubate the second bottle withthe other samples and measure the final BOD after 5 days.Also prepare two blank samples of dilution water. Use one bottle to determine theinitial DO. Incubate the second bottle with the other samples and measure thefinal BOD after 5 (or 7) days.Make sure to properly label all bottles. The label should state what is in thebottle, the concentration, the date, and your name.AnalysisAs stated earlier, a valid dilution is one that has a final DO of at least 1 mg/L, anda DO uptake of at least 2 mg/L. The BOD of the sample is determined from theDO uptake and the fractional dilution (F):BOD DOinitial DO finalFThe fractional dilution of the sample is the volume of sample divided by the BODbottle volume.Because the BOD test is a bioassay, the results can be influenced greatly by thepresence of toxic substances. Distilled waters, which is used to prepare thedilution water, are frequently contaminated with copper. Use the bottles with theglucose-glutamic acid to check for water quality as well as seed effectivenessand the quality of your analytical technique. The BOD5 for this 300 mg/L mixedprimary standard should be 198 30.5 mg/L if a nitrogen inhibitor was used.Elements of ReportWithin your report, you should include the following items specific to yourexperiment: Name, location and general description of wastewater facility Specific equipment (manufacturer and model) used and accuracy Which dilution provided the best estimate of BOD5 for the influent and theeffluent? Identify any BOD samples that should be eliminated based on the final DOor the minimum DO depletion.8
What is BOD5 of the influent and effluent, and how does this valuecompare to typical values reported in the literature? What are the different compounds added to the dilution water? Whatpurpose does each serve? If you conducted a 7 day BOD test, calculate BOD5 and the ultimate BOD(Lo) of the sample assuming k 0.35/day (base e). Generate a graphshowing the change in BOD over time. Extend this graph to at least 0.9Lo. If you conducted a 5 day BOD test, calculate BOD7 and the ultimate BOD(Lo)of the sample assuming k 0.35/day (base e). Generate a graphshowing the change in BOD over time. Extend this graph to at least 0.9Lo.ReferencesStandard Methods for the Examination of Water and Wastewater, 20th Ed.Published jointly by APHA, AWWA and WPCF, 1998.Laboratory Manual for CE 310: Introduction to Environmental Engineering,Spring 2000, Ray, B.T., Southern Illinois University Carbondale.Wastewater Engineering: Treatment, Disposal and Reuse, 3rd Ed., Metcalf andEddy, McGraw-Hill, 1991.Standard Handbook of Environmental Engineering, Corbitt, R.A., McGraw-Hill,1990.9
Biochemical Oxygen Demand Lab Data SheetNameDateLaboratory SectionTreatment FacilityInitial Date and TimeFinal Date and TimeVolumeWWmLSampleDOInitial DO Final DO uptakemg/Lmg/Lmg/L123456DilutionBlankWaterG-GA StandardEQUIPMENT USED (include model numbers):NOTES:10FBODmg/L
COLIFORM LABIntroductionPathogenic organisms present in water and wastewater are difficult to test for,and are often in small numbers. Therefore, the typical approach is to test for thepresence of indicator organisms such as the coliform group. The coliformbacteria are present in the intestinal tract of mammals. Although not pathogenicthemselves, the presence of coliform bacteria in large numbers may indicate thepossibility of contamination of the water supply by fecal matter or insufficienttreatment of a wastewater. One analytical method commonly used by regulatoryagencies and water utilities to test for coliform is the membrane filter technique.The objective of this laboratory is to conduct this experiment, using differentsources of water and wastewater.Materials and Equipment Vacuum System 0.45 m membrane filter Filtration apparatus Pipets Graduated cylinder Petri dishes (pre-sterilized plastic dishes are available commercially) Absorbent pads Tweezers Incubator (35 0.5 C with a relative humidity of at least 60%) M-Endo medium (prepared by lab instructor) Sterilized buffered dilution water (prepared by lab instructor) Water and/or wastewater sample collected in sterilized glass or plasticbottles11
Note: Anything contacting the sample must be sterilized to preventcontamination. This includes, but is not limited to, glassware, filters, pipets andthe filtration apparatus.ProcedureCollect two different water samples from different sources. If collecting from atreatment facility, collect the sample prior to chlorination if possible. Otherwise,the chlorine must be neutralized with sodium thiosulfate immediately aftercollecting. Drinking water samples should also be dechlorinated. Somemanufacturers of sample bottles place sodium thiosulfate in the sample bottlesprior to distribution.Using sterile forceps, place a sterile membrane filter (grid side up) over theporous plate of the flask of the filter device. Place the funnel unit over the flaskand lock it in place. Shake your sample 25 times to assure that it is well mixed.Pipet the required volume of sample into the top of the filter apparatus. Fordrinking water, 100 mL is the standard sample size. Filter the sample under apartial vacuum. A satisfactory filtration time is within five minutes. If this cannotbe obtained, the required volume may be distributed among numerousmembranes (i.e. 100 mL may be filtered in two 50 mL or four 25 mL portions).For analyzing samples other than drinking water, the required volume may beestimated using Table 1. Because the range of sample volume is large, it is bestto analyze other waters by filtering three different sample volumes. When lessthan 10 mL of sample is to be filtered, add approximately 10 mL of sterile dilutionwater to the funnel before filtration. Alternately, you may pipet the sample into asterile bottle and mix with approximately 10 mL of sterile dilution water first, andthen filter the entire amount. This increase in water volume aids in the uniformdispersion of the bacteria over the effective filtering surface.Table 1: Approximate filtration volumeSourceDrinking waterLakesBathing beachesStreams, riversUnchlorinated wastewaterApproximate Volume10010-100 mL0.01-10 mL0.01-10 mL0.0001-0.1 mLAfter filtering the sample, and with the filter still in place, rinse the interior surfaceof the funnel with 20 to 30 mL of sterile dilution water three times (this may beapplied from a squeeze bottle).Place an adsorbent pad in the bottom of a sterilized petri dish. Saturate the padwith 1.8-2.2 mL of M-Endo medium. Decant any excess medium. Remove thefilter from the filtration device using sterile forceps. Place in on the saturated pad12
using a rolling motion to avoid the entrapment of air. The contact with themedium is important, since the colonies will not grow without this contact.Place the prepared cultures in waterproof bags and incubate in a submergedwater bath for 22-24 hr at 35 0.5 C. Do not incubate beyond 24 hr. Afterincubating, remove the cultures. Count any colonies that develop a red color witha metallic sheen. These are colonies of coliform bacteria. Report the results as #of colonies/100 mL. Other bacteria may be present, but will not exhibit thecharacteristic color and sheen. These colonies may be pink, blue, or whitelacking sheen.In addition to the samples, test the dilution water. Evidence of contamination inthis sample indicates unsterile conditions and invalid data. A number of improperprocedures can result in less than desirable cultures.AnalysisA suitable quantity of the sample water results in an ideal colony count of 20 to80 coliform colonies and not more than 200 colonies. Less than 20 colonies areconsidered unreliable statistically. More than 200 colonies makes countingindividual colonies on the filter difficult.Compute the concentration of coliform colonies, or coliform density, using thefollowing equation:If no coliform colonies are observed, report the coliform colonies counted as " 1coliform/100 mL". If the total number of bacterial colonies, coliforms plusnoncoliforms, exceed 200 per membrane, or if the colonies are not distinctenough for accurate counting, report results as "too numerous to count" (TNTC)or "confluent", respectfully.If you distributed your sample over multiple membranes, you should calculate thecoliform density by using the total number of colonies counted and the totalvolume filtered.Elements of ReportIn addition to the general requirements of your report, you should include thefollowing information: Sample site Specific model of equipment Explain why we measure for the total number of coliform bacteria in awater sample, particularly since coliforms are not normally considered apathogen13
What is the desirable range of total coliforms on a membrane filter? Whatis the maximum number of total colonies present? Why do you need to have a smaller sample volume for river water and rawsewage compared to drinking water? Is there evidence of contamination in your dilution water sample? Discusssources of contamination and the need for sterilized equipmentReferencesStandard Methods for the Examination of Water and Wastewater, 20th Ed.Published jointly by APHA, AWWA and WPCF, 1998.Laboratory Manual for CE 310: Introduction to Environmental Engineering,Spring 2000, Ray, B.T., Southern Illinois University Carbondale.Introduction to Environmental Engineering, 3rd Edition, M.L. Davis, D.A. Cornwell,WCB McGraw-Hill, 1998.Field Manual for Water Quality Monitoring: An Environmental Education Programfor Schools, 12th Edition, M.K. Mitchel and W.B. Stapp, Kendall/Hall PublishingCo., 2000.14
Coliform Lab Data SheetNameDateLaboratory SectionSite 1Site 2Site 1Sample123Site 2-Sample123Volume (mL)-Number of Colonies-Volume (mL)-Number of Colonies-NOTES:15
JAR TESTIntroductionUntreated water contains dissolved, suspended and colloidal size particles. Thesolids lab focused on the procedure for quantifying the amount of dissolved andsuspended solids. In those experiments, the suspended solids were filtered outof the water using a 1.2 mm pore size glass fiber filter. Colloids range in sizefrom 0.001-1 µm. As a consequence, colloidal size particles were included asdissolved particles. In water treatment, the initial gravity settling will not removecolloids. Instead, they remain suspended due to their electrical charge andsubsequent slow settling velocity ( 0.1 mm/s). In addition, colloidal sizeparticles are difficult to remove during filtration.Colloidal particles cause color in water, as well as taste problems. Since much ofthe colloidal matter comes from natural organic matter, they contribute to theformation of undesirable chlorine disinfection by-products. Other material, suchas toxic metals, synthetic organic molecules, iron and manganese may also besorbed to these fine particles.To remove colloids as well as bacteria, coagulation and flocculation are typicallycombined in a two-stage process during water treatment. This chemical-physicaltreatment causes small particles to combine into larger aggregates that are morereadily separated from water by sedimentation and filtration. In the coagulationstage of the process, aluminum sulfate (alum) or ferric sulfate are rapidly mixedwith the water. The chemical neutralizes the charged particles, which causesthem to adhere to each other and form flocs. When properly formed, the flocsare larger and more dense than the colloids, and will settle quickly. Flocculationis the slow mixing of the water in order to encourage the formation of the floc.The coagulant dose required to produce a floc varies with the concentration, sizeand types of particles in the raw water as well as the alkalinity or pH. Todetermine the most economical amount of chemical to add, a jar test can beconducted. During this test, the optimum dose, pH, flocculator mixing rate ordetention time can be chosen. The basic procedure involves a series of batchexperiments that simulate the full-scale process.Equipment and Material Aluminum sulfate Ferric sulfate (optional) 1 liter beakers Laboratory stirrer with illuminated base Timer Scale for weighing coagulant16
Pipets 1000 mL volumetric flask Turbidimeter (optional) pH meter (optional)For this lab, you should prepare a stock solution of the coagulant. The stocksolution of alum is prepared by dissolving 10 grams of alum into 1000 mL ofdistilled water. Each 1.0 mL of this stock solution will equal 10 mg/L when addedto 1000 mL of water to be tested. Prepare this solution in using the volumetricflask. Fill the flask approximately half full with distilled water. Then add the dryingredient. Mix well. Fill the flask to the line on the neck of the flask.ProcedureTypically, a lab stirrer for jar tests has six paddles. For each paddle, fill a 1 literbeaker with 1 liter of raw water. Using the stock solution, dose each beaker withincreasing amounts of alum. Different sources of raw water will require differentdoses. A reasonable starting point for this experiment is 0.5 mL-3.0 mL inincrements of 0.5 mL. After adding the alum, stir the beakers at a high rpm forapproximately 1 minute. Then reduce the rpm and stir for an additional 30minutes while observing the floc formation. Allow the floc to settle for one hour.For this lab, you can determine the optimum dose visually by selecting whichbeaker has the clearest water. Alternately, you can test the turbidity of the waterin each beaker.Experimental parameters such as paddle speed, rapid mixing time, flocculationtime and settling time can be adjusted to simulate a wide range of full scaleoperating conditions. Further testing can be conducted over a narrower range ofalum doses based on the results of the preliminary test.Additional tests can also be conducted to optimize the alum dose over a range ofpH values. In this case, choose the optimum dose from the previous experiment.Adjust the raw water in each beaker to provide a range of pH values. The pHmay be adjusted by either addition sulfuric acid (to lower the pH) or lime (CaO) orsoda ash (Na2CO3) (to raise pH). Add the alum, mix and settle using the sameprocedure as before.AnalysisIf the sample appears cloudy, with little or no floc and almost no settling, too littlecoagulant was used, a condition referred to as a coagulant underfeed. Acoagulant overfeed on the other hand will form a dense floc. It will appear fragileand fluffy when the stirrer is turned off, and as a result, will not settle well. A flocformed by an overfeed is called a false floc, and will carry to the filter. This isone of the most common treatment problems. A good floc will appear heavy and17
tight, not too dense, with spaces of bright, clear water between the particles andwill begin to settle as soon as the stirrer is turned off.If the turbidity of the water is tested, develop a graph of turbidity (NTU) versusalum dose (mg/L). If the pH of the water was also adjusted, develop a graph ofturbidity (NTU) versus pH. From these graphs, the conditions that produce thelowest residual turbidity are the optimal conditions.ReportFor this report, explain how each step of the experimental process relates to unitprocesses in a water treatment facility. In addition, list the brand and modelnumber of the stirrer unit used.ReferencesNazaroff, W.W. and Alvarez-Cohen, L., 2001, Environmental EngineeringScience, Wiley.Phipps and Bird, The Jar Test. http://www.phippsbird.com/jartest.htm (July 2001).18
Data SheetNameSection NumberRaw water sourceMake and Model of Jar Test ApparatusJarDose al)
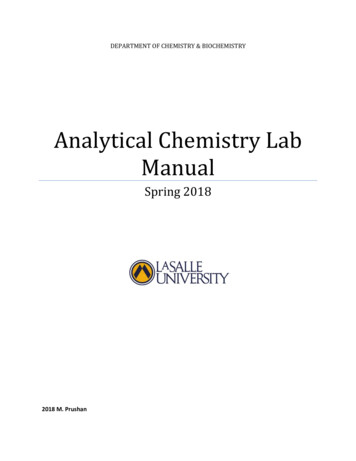
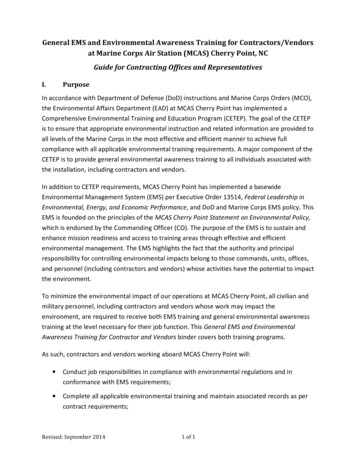
LAKE PROFILEIntroductionLakes exhibit stratification due to density differences in the water as thetemperature increases or decreases at different depths. During the summer,warm surface air and longer days with direct sunlight on the surface of the watercauses the surface of the lake to be much warmer than the water at differentdepths. If you have gone swimming in a lake during the summer, you haveprobably noticed a distinct change in water temperature at a certain pointbeneath the surface. The point where the temperature has a distinct temperaturechange is known as the thermocline. The warm region above the thermocline isthe epilimnion. Below the thermocline is the hypolimnion.The density of water changes with temperature (Table 1). In addition, the amountof dissolved oxygen changes with temperature (Table 2). Since field probes arecommercially available to measure temperature and dissolved oxygenconcentrations in water, the profile of a lake can be measured. From this data,you can also show the stratification of the lake due to density differences, andidentify the epilimnion, thermocline and hypolimnion. The temperature anddissolved oxygen concentrations in these regions will support different aquaticand biological life. For example, as organic sediments build up at the bottom ofthe lake, they exert a significant oxygen demand on the hypolimnion. Since thedissolved oxygen in this region is low, and replenished at a slow rate, this regionmay become anaerobic.Figure 1: Generalized schematic of lake stratification.20
Table 1: Density of Water at 1 atmTemperature ( 540992.21945990.21650988.03960983.20270977.773, (kg/m3)The profile of the lake will change as the seasons change. Throughout thesummer, the depth of the epilimnion region will increase. However, as winterapproaches, shorter days and cooler temperatures cause the density of theupper layer to increase to the point of being more dense than the lower level,causing the lake to "turn over". In colder climates, a second overturn can occur inthe spring as the surface ice melts, becomes dense and sinks to the bottom ofthe lake.Turbidity in surface water is caused by colloidal or suspended particles. Thecomposition of these particles varies. In general, they are from the erosion of soilparticles, organic material, bacteria or plankton. The turbidity in the water limitsthe depth at which sunlight can penetrate the water, consequently controlling thelife forms that thrive at different depths.21
Table 2: Saturation of Dissolved Oxygen in Distilled WaterTemperature ºCSolubility (mg/L)Temperature ºCSolubility 6258.31011.3268.11111.027
Environmental Engineering through laboratory analysis that integrates hands-on investigation, data reduction and interpretation. Experiments include measuring conventional water and wastewater parameters as well as exploring the natural environment. A m