Transcription
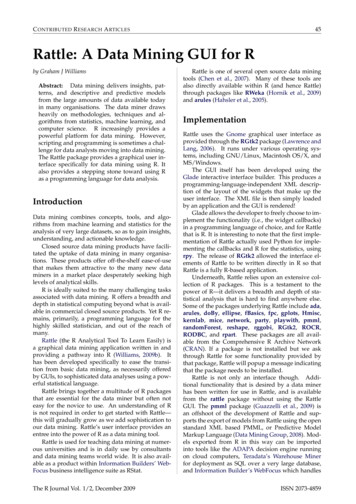
C ONTRIBUTED R ESEARCH A RTICLES45Rattle: A Data Mining GUI for Rby Graham J WilliamsAbstract: Data mining delivers insights, patterns, and descriptive and predictive modelsfrom the large amounts of data available todayin many organisations. The data miner drawsheavily on methodologies, techniques and algorithms from statistics, machine learning, andcomputer science. R increasingly provides apowerful platform for data mining. However,scripting and programming is sometimes a challenge for data analysts moving into data mining.The Rattle package provides a graphical user interface specifically for data mining using R. Italso provides a stepping stone toward using Ras a programming language for data analysis.IntroductionData mining combines concepts, tools, and algorithms from machine learning and statistics for theanalysis of very large datasets, so as to gain insights,understanding, and actionable knowledge.Closed source data mining products have facilitated the uptake of data mining in many organisations. These products offer off-the-shelf ease-of-usethat makes them attractive to the many new dataminers in a market place desperately seeking highlevels of analytical skills.R is ideally suited to the many challenging tasksassociated with data mining. R offers a breadth anddepth in statistical computing beyond what is available in commercial closed source products. Yet R remains, primarily, a programming language for thehighly skilled statistician, and out of the reach ofmany.Rattle (the R Analytical Tool To Learn Easily) isa graphical data mining application written in andproviding a pathway into R (Williams, 2009b). Ithas been developed specifically to ease the transition from basic data mining, as necessarily offeredby GUIs, to sophisticated data analyses using a powerful statistical language.Rattle brings together a multitude of R packagesthat are essential for the data miner but often noteasy for the novice to use. An understanding of Ris not required in order to get started with Rattle—this will gradually grow as we add sophistication toour data mining. Rattle’s user interface provides anentree into the power of R as a data mining tool.Rattle is used for teaching data mining at numerous universities and is in daily use by consultantsand data mining teams world wide. It is also available as a product within Information Builders’ WebFocus business intelligence suite as RStat.The R Journal Vol. 1/2, December 2009Rattle is one of several open source data miningtools (Chen et al., 2007). Many of these tools arealso directly available within R (and hence Rattle)through packages like RWeka (Hornik et al., 2009)and arules (Hahsler et al., 2005).ImplementationRattle uses the Gnome graphical user interface asprovided through the RGtk2 package (Lawrence andLang, 2006). It runs under various operating systems, including GNU/Linux, Macintosh OS/X, andMS/Windows.The GUI itself has been developed using theGlade interactive interface builder. This produces aprogramming-language-independent XML description of the layout of the widgets that make up theuser interface. The XML file is then simply loadedby an application and the GUI is rendered!Glade allows the developer to freely choose to implement the functionality (i.e., the widget callbacks)in a programming language of choice, and for Rattlethat is R. It is interesting to note that the first implementation of Rattle actually used Python for implementing the callbacks and R for the statistics, usingrpy. The release of RGtk2 allowed the interface elements of Rattle to be written directly in R so thatRattle is a fully R-based application.Underneath, Rattle relies upon an extensive collection of R packages. This is a testament to thepower of R—it delivers a breadth and depth of statistical analysis that is hard to find anywhere else.Some of the packages underlying Rattle include ada,arules, doBy, ellipse, fBasics, fpc, gplots, Hmisc,kernlab, mice, network, party, playwith, pmml,randomForest, reshape, rggobi, RGtk2, ROCR,RODBC, and rpart. These packages are all available from the Comprehensive R Archive Network(CRAN). If a package is not installed but we askthrough Rattle for some functionality provided bythat package, Rattle will popup a message indicatingthat the package needs to be installed.Rattle is not only an interface though. Additional functionality that is desired by a data minerhas been written for use in Rattle, and is availablefrom the rattle package without using the RattleGUI. The pmml package (Guazzelli et al., 2009) isan offshoot of the development of Rattle and supports the export of models from Rattle using the openstandard XML based PMML, or Predictive ModelMarkup Language (Data Mining Group, 2008). Models exported from R in this way can be importedinto tools like the ADAPA decision engine runningon cloud computers, Teradata’s Warehouse Minerfor deployment as SQL over a very large database,and Information Builder’s WebFocus which handlesISSN 2073-4859
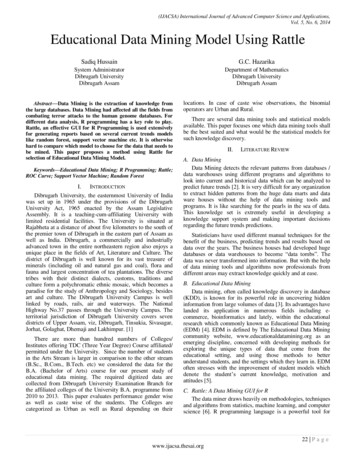
46C ONTRIBUTED R ESEARCH A RTICLESdata sourcing, preparation, and reporting, and is ableto transform Rattle generated PMML models into Ccode to run on over 30 platforms.InstallationThe Gnome and Glade libraries need to be installed(separately to R) to run Rattle. On GNU/Linuxand Mac/OSX this is usually a simple packageinstallation. Specifically, for Debian or Ubuntuwe install packages like gnome and glade-3. ForMS/Windows the self-installing libraries can be obtained from http://downloads.sourceforge.net/gladewin32. Full instructions are available fromhttp://rattle.togaware.com.After installing the required libraries be sure torestart the R console to ensure R can find the new libraries.Assuming R is installed we can then install theRGtk2 and rattle packages with: install.packages("RGtk2") install.packages("rattle")Once installed we simply start Rattle by loadingthe rattle package and then evaluating the rattle()function: library(rattle)Rattle: Graphical interface for data mining in R.Version 2.5.0 Copyright (C) 2006-2009 Togaware.Type 'rattle()' to shake, rattle, & roll your data. rattle()Rattle will pop up a window similar to that in Figure 1.The latest development version of Rattle is always available from Togaware: install.packages("rattle", repos "http://rattle.togaware.com")Data MiningRattle specifically uses a simple tab-based conceptfor the user interface (Figure 1), capturing a workflow through the data mining process with a tab foreach stage. A typical work flow progresses from theleft most tab (the Data tab) to the right most tab (theLog tab). For any tab the idea is for the user to configure the available options and then to click the Execute button (or F2) to perform the appropriate task.The status bar at the base of the window will indicatewhen the action is complete.We can illustrate a very simple, if unrealistic, runthrough Rattle to build a data mining model with justfour mouse clicks. Start up R, load the rattle package,and issue the rattle() command. Then:1. Click on the Execute button;2. Click on Yes within the resulting popup;3. Click on the Model tab;4. Click on the Execute button.Now we have a decision tree built from a sampleclassification dataset.With only one or two more clicks, alternativemodels can be built. A few more clicks will havean evaluation chart displayed to compare the performance of the models constructed. Then a click or twomore will have the models applied to score a newdataset.Of course, there is much more to modelling anddata mining than simply building a tree model. Thissimple example provides a flavour of the interfaceprovided by Rattle.The common work flow for a data mining projectcan be summarised as:1. Load a Dataset and select variables;2. Explore the data to understand distributions;3. Test distributions;4. Transform the data to suit the modelling;5. Build Models;6. Evaluate models and score datasets;7. Review the Log of the data mining process.Figure 1: Rattle’s introductory screen.The R Journal Vol. 1/2, December 2009The underlying R code, constructed and executedby Rattle, is recorded in the Log tab, together withinstructive comments. This allows the user to reviewthe actual R commands. The R code snippets can alsobe copied as text (or Exported to file) from the Logtab and pasted into the R console and executed. Thisallows Rattle to be deployed for basic tasks, yet stillaccess the full power of R as needed (e.g., to fine-tunemodelling options that are not exposed in the interface).The use of Sweave (Leisch, 2002) to allow LATEXmarkup as the format of the contents of the log isISSN 2073-4859
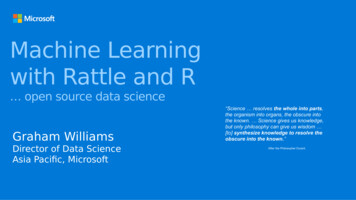
C ONTRIBUTED R ESEARCH A RTICLESexperimental but will introduce the concept of literate data mining. The data miner will document theiractivity, as they proceed through Rattle, by editingthe log which is also automatically populated as themodelling proceeds. Simple and automatic processing can then turn the log into a formatted report thatalso embodies the actual code, which may also be runso as to replicate the activity.Using the related Tangle processor allows the logto be exported as an R script file, to record the actionstaken. The script can then be independently run at alater time (or pasted into the R console).Repeatability and reproducibility are importantin both scientific research and commercial practice.47name starts with ‘ID ’ then the variable is markedas having a role as an identifier. Other prefixes include ‘IGNORE ’, ‘RISK ’, ‘IMP ’ (for imputed) and‘TARGET ’. Examples from the audit data includeIGNORE Accounts and TARGET Adjusted.The CSV option of the Data tab provides the simplest approach to loading data into Rattle. If theData tab is Executed with no CSV file name specified then Rattle offers the option to load a sampledataset. Clicking on the Filename box will then listother available sample datasets, including ‘audit.csv’.Once Rattle loads a dataset the text window willcontain the list of available variables and their default roles (as in Figure 2).DataIf no dataset has been supplied to Rattle and we clickthe Execute button (e.g., startup Rattle and immediately click Execute) we are given the option to loadone of Rattle’s sample datasets from a CSV file.Rattle can load data from various sources. It directly supports CSV (comma separated data), TXT(tab separated data), ARFF (a common data mining dataset format (Witten and Frank, 2005) whichadds type information to a CSV file), and ODBC connections (allowing connection to many data sourcesincluding MySQL, SQLite, Postgress, MS/Excel,MS/Access, SQL Server, Oracle, IBM DB2, Netezza,and Teradata). R data frames attached to the currentR session, and datasets available from the packagesinstalled in the R libraries, are also available throughthe Rattle interface.To explore the use of Rattle as a data mining toolwe consider the sample audit dataset provided bythe rattle package. The data is artificial, but reflects areal world dataset used for reviewing the outcomesof historic financial audits. Picture, for example, arevenue authority collecting taxes based on information supplied by the tax payer. Thousands of random audits might be performed and the outcomesindicate whether an adjustment to the supplied information was required, resulting in a change to thetaxpayer’s liability.The audit dataset is supplied as both an R datasetand as a CSV file. The dataset consists of 2,000 fictional tax payers who have been audited for tax compliance. For each case an outcome after the audit isrecorded (whether the financial claims had to be adjusted or not). The actual dollar amount of adjustment that resulted is also recorded (noting that adjustments can go in either direction).The audit dataset contains 13 variables (orcolumns), with the first being a unique client identifier.When loading data into Rattle certain special prefixes to variable names can be used to identify default variable roles. For example, if the variableThe R Journal Vol. 1/2, December 2009Figure 2: Rattle’s variable roles screen.By default, most variables have a role of Input formodelling. We may want to identify one variable asthe Target variable, and optionally identify anothervariable as a Risk variable (which is a measure of thesize of the “targets”). Other roles include Ident andIgnore.Rattle uses simple heuristics to guess at roles, particularly for the target and ignored variables. For, example, any numeric variable that has a unique valuefor each observation is automatically identified as anidentifier.Rattle will, by default, partition the dataset intoa training and a test dataset. This kind of samplingis useful for exploratory purposes when the data isquite large. Its primary purpose, though, is to selecta 70% sample for training of models, providing a 30%set for testing.ExploreExploratory data analysis is important in understanding our data. The Explore tab provides numerous numeric and graphic tools for exploring data.Once again, there is a considerable reliance on manyother R packages.ISSN 2073-4859
48C ONTRIBUTED R ESEARCH A RTICLESSummaryThe Summary option uses R’s summary commandto provide a basic univariate summary. This isaugmented with the contents and describe commands from the Hmisc package (Harrell, 2009). Extended summaries include additional statistics provided by the fBasics package (Wuertz, 2009), kurtosis and skewness, as well as a summary of missing values using the missing value functionalityfrom the mice package (van Buuren and GroothuisOudshoorn, 2009).DistributionsThe Distributions option provides access to numerous plot types. It is always a good idea to review thedistributions of the values of each of the variablesbefore we consider data mining. While the abovesummaries help, the visual explorations can often bequite revealing (Cook and Swayne, 2007).A vast array of tools are available within R forpresenting data visually and the topic is covered indetail in many books including Cleveland (1993).Rattle provides a simp
Rattle(the R Analytical Tool To Learn Easily) is a graphical data mining application written in and providing a pathway into R (Williams,2009b). It has been developed specifically to ease the transi-tion from basic data mining, as necessarily offered by GUIs, to sophisticated data analyses using a pow-erful statistical language.