Transcription
(IJACSA) International Journal of Advanced Computer Science and Applications,Vol. 5, No. 6, 2014Educational Data Mining Model Using RattleSadiq HussainG.C. HazarikaSystem AdministratorDibrugarh UniversityDibrugarh AssamDepartment of MathematicsDibrugarh UniversityDibrugarh AssamAbstract—Data Mining is the extraction of knowledge fromthe large databases. Data Mining had affected all the fields fromcombating terror attacks to the human genome databases. Fordifferent data analysis, R programming has a key role to play.Rattle, an effective GUI for R Programming is used extensivelyfor generating reports based on several current trends modelslike random forest, support vector machine etc. It is otherwisehard to compare which model to choose for the data that needs tobe mined. This paper proposes a method using Rattle forselection of Educational Data Mining Model.locations. In case of caste wise observations, the binomialoperators are Urban and Rural.Keywords—Educational Data Mining; R Programming; Rattle;ROC Curve; Support Vector Machine; Random ForestI.INTRODUCTIONDibrugarh University, the easternmost University of Indiawas set up in 1965 under the provisions of the DibrugarhUniversity Act, 1965 enacted by the Assam LegislativeAssembly. It is a teaching-cum-affiliating University withlimited residential facilities. The University is situated atRajabheta at a distance of about five kilometers to the south ofthe premier town of Dibrugarh in the eastern part of Assam aswell as India. Dibrugarh, a commercially and industriallyadvanced town in the entire northeastern region also enjoys aunique place in the fields of Art, Literature and Culture. Thedistrict of Dibrugarh is well known for its vast treasure ofminerals (including oil and natural gas and coal), flora andfauna and largest concentration of tea plantations. The diversetribes with their distinct dialects, customs, traditions andculture form a polychromatic ethnic mosaic, which becomes aparadise for the study of Anthropology and Sociology, besidesart and culture. The Dibrugarh University Campus is welllinked by roads, rails, air and waterways. The NationalHighway No.37 passes through the University Campus. Theterritorial jurisdiction of Dibrugarh University covers sevendistricts of Upper Assam, viz, Dibrugarh, Tinsukia, Sivasagar,Jorhat, Golaghat, Dhemaji and Lakhimpur. [1]There are more than hundred numbers of Colleges/Institutes offering TDC (Three Year Degree) Course affiliated/permitted under the University. Since the number of studentsin the Arts Stream is larger in comparison to the other stream(B.Sc., B.Com., B.Tech. etc) we considered the data for theB.A. (Bachelor of Arts) course for our present study ofeducational data mining. The required digitized data arecollected from Dibrugarh University Examination Branch forthe affiliated colleges of the University B.A. programme from2010 to 2013. This paper evaluates performance gender wiseas well as caste wise of the students. The Colleges arecategorized as Urban as well as Rural depending on theirThere are several data mining tools and statistical modelsavailable. This paper focuses one which data mining tools shallbe the best suited and what would be the statistical models forsuch knowledge discovery.II.LITERATURE REVIEWA. Data MiningData Mining detects the relevant patterns from databases /data warehouses using different programs and algorithms tolook into current and historical data which can be analyzed topredict future trends [2]. It is very difficult for any organizationto extract hidden patterns from the huge data marts and dataware houses without the help of data mining tools andprograms. It is like searching for the pearls in the sea of data.This knowledge set is extremely useful in developing aknowledge support system and making important decisionsregarding the future trends predictions.Statisticians have used different manual techniques for thebenefit of the business, predicting trends and results based ondata over the years. The business houses had developed hugedatabases or data warehouses to become “data tombs”. Thedata was never transformed into information. But with the helpof data mining tools and algorithms now professionals fromdifferent areas may extract knowledge quickly and at ease.B. Educational Data MiningData mining, often called knowledge discovery in database(KDD), is known for its powerful role in uncovering hiddeninformation from large volumes of data [3]. Its advantages havelanded its application in numerous fields including ecommerce, bioinformatics and lately, within the educationalresearch which commonly known as Educational Data Mining(EDM) [4]. EDM is defined by The Educational Data Miningcommunity website, www.educationaldatamining.org as anemerging discipline, concerned with developing methods forexploring the unique types of data that come from theeducational setting, and using those methods to betterunderstand students, and the settings which they learn in. EDMoften stresses with the improvement of student models whichdenote the student’s current knowledge, motivation andattitudes [5].C. Rattle: A Data Mining GUI for RThe data miner draws heavily on methodologies, techniquesand algorithms from statistics, machine learning, and computerscience [6]. R programming language is a powerful tool for22 P a g ewww.ijacsa.thesai.org
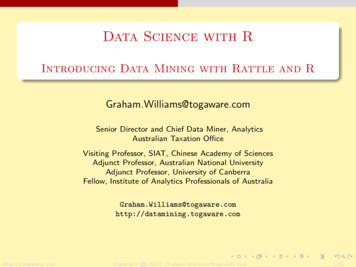
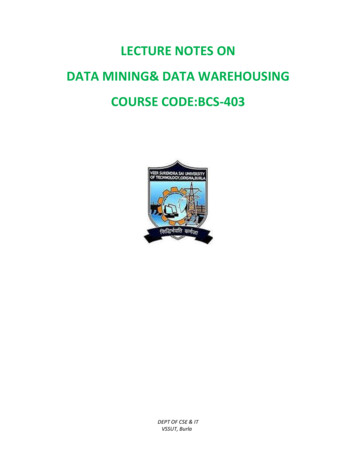
(IJACSA) International Journal of Advanced Computer Science and Applications,Vol. 5, No. 6, 2014data mining. Rattle (the R Analytical Tool To Learn Easily)provides GUI for the R programming environment. We have touse the library (rattle) and rattle () brings up the GUI for theprogrammers. Highly skilled Statisticians may efficiently usethe R Programming Language. So, it is out of reach for manypeople without in depth knowledge of Statistics. But Rattleprovides sophisticated GUI for data analysis and provides thenecessary graphs with a click. Rattle provides anothermagnitude to the R programming and a platform for the novicedata miners to work efficiently. Rattle’s user interface providesan entry into the power of R as a data mining tool. [6]D. ROC Curves AnalysisTo determine a cutoff value, Receiver operatingcharacteristic (ROC) curves is used in many areas. We may usethe ROC curve for the selection of best suited models. In oureducational data mining experiment, we use the ROC curve todetermine the selection of model.III.EXPERIMENTS AND EVALUATIONA. The Data SetWe have included a small part of the Category and Genderbased tables termed as Table 1 and Table 2 for which thesuitable models needs to be selected. The Examination Branchof Dibrugarh University provides various College Codes fordifferent Colleges under its jurisdiction. The field ‘Appeared’means the number of candidates appeared for that examinationand ‘Passed’ means the number of candidates passed for thatparticular examination. The field ‘PassPercentage’ is thePassed Percentage of the Candidates for a particular category.We define various terms in their codes as below:a) CategoryCategory CodeGeneral1MOBC2OBC3SC4ST5b) PerformancePass Percentage 90% 75% 60% 45% 45%c) LocationLocationurban areas collegesrural areas collegesd) GenderGenderMale CandidatesFemale CandidatesThe meaning of the data fields as depicted in the sampleTable 2 are same Table 1 except one field i.e. ‘Gender’. Nowthe stage is set and ready to perform.B. Experiments performed by RattleThe main objective in this paper is to select the best suitedmodels for performing the statistical analysis of the datasets.We used one Xeon based Database Server for the experiments.The rattle package was used for the same. The data is importedto R which was stored in .csv format. The target data wascategorical data and the partition chosen was 70/30/0. If oneexplores the data, one may visualise the data by using box plot,histogram, cumulative and benford curves. The histogram, thecumulative and benford curves are presented in the figuresI,II,III and IV. Now, one may use the Model tab and select allthe models for the comparison. The models are of type tree,random forest, boost, support vector machine, regressionmodels and neural network. The data is evaluated through allthe models. Our goal is to find the best suited models for thedata through ROC curve.C. Evaluation of the ExperimentsIn the figure V, we have placed one of the ROC curves forthe category data. The followings are the actual findings usingthe Rattle based on the category wise data.Area under the ROC curve for the rpart model oncategoryba.csv [validate] is 0.8814Rattle timestamp: 2014-05-06 06:48:54 sadiq Area under the ROC curve for the ada model on categoryba.csv[validate] is 0.9425Rattle timestamp: 2014-05-06 06:48:55 sadiq Area under the ROC curve for the rf model on categoryba.csv[validate] is 0.9221Rattle timestamp: 2014-05-06 06:48:55 sadiqPerformance12345 Code01Area under the ROC curve for the glm model oncategoryba.csv [validate] is 0.8980Area under the ROC curve for the ksvm model oncategoryba.csv [validate] is 0.9301Rattle timestamp: 2014-05-06 06:48:55 sadiq Rattle timestamp: 2014-05-06 06:48:55 sadiq Code01Area under the ROC curve for the nnet model oncategoryba.csv [validate] is 0.7393Rattle timestamp: 2014-05-06 06:48:55 sadiq23 P a g ewww.ijacsa.thesai.org
(IJACSA) International Journal of Advanced Computer Science and Applications,Vol. 5, No. 6, 2014From the above ROC curve analysis, it is quite clear thatwhose area under ROC curve for a particular model is 1 orclose to 1, that model is best suited for that data. TheStatisticians can further analyze the data based on that model.The models best suited for our category-wise data are adamodel (with area value is 0.9425), rf model (0.9221), ksvmmodel (0.9301).If we generate the ROC curve for the gender specific data,then we find the following:Area under the ROC curve for the rpart model onGender BA.CSV [validate] is 1.0000Rattle timestamp: 2014-05-07 19:55:53 sadiq Area under the ROC curve for the ada model onGender BA.CSV [validate] is 1.0000We may conclude from the above that almost all the modelsare would deliver better results, but rpart, ada, rf and glmmodels are best suited.IV. CONCLUSIONS AND FUTURE WORKThe Rattle package provides a GUI platform toward usingR as a programming language. Rattle is open source datamining tools packed under the regime of R. In this paper, twodata sets were mined. If one compares the two data sets results,then it may be concluded that ada, rf models are best suited forthe data that were mined. We hance found that the femalecandidates of the University did better than the boys’candidates and the rural candidates did better performance thanthe urban candidates’(Refer to the figures below). Moreover, asthis paper dealt with only one examination i.e. Bachelor ofArts, there are lots of another Examinations to deal with as wellas one may extract valuable patterns and information fromthem. The future plan is to compare entry and exit data of TDCstudents of different colleges affiliated to Dibrugarh University.Rattle timestamp: 2014-05-07 19:55:53 sadiq Area under the ROC curve for the rf modelGender BA.CSV [validate] is 1.0000onRattle timestamp: 2014-05-07 19:55:53 sadiq Area under the ROC curve for the ksvm model onGender BA.CSV [validate] is 0.9982V.ACKNOWLEDGMENTSThe authors express their gratefulness to Prof. Alak Kr.Buragohain, Vice-Chancellor, Dibrugarh University for hisinspiring words and allowing them to use the Examination dataof the University. They generously thank Mr. N.A. Naik,Senior Programmer, Mumbai based firm for helping us toextract the .csv files from the SQL Server database.The authorswould like to offer gratitude to Prof. Jiten Hazarika Departmentof Statistics, Dibrugarh University for his valuable ideas.REFERENCESRattle timestamp: 2014-05-07 19:55:54 sadiq [1][2]Area under the ROC curve for the glm model onGender BA.CSV [validate] is 1.0000[3]Rattle timestamp: 2014-05-07 19:55:54 sadiq[4] Area under the ROC curve for the nnet model onGender BA.CSV [validate] is 0.9999[5]Rattle timestamp: 2014-05-07 19:55:54 sadiq[6]TABLE I.Year20102010201020102010The Dibrugarh University website: www.dibru.ac.inJohn Silltow, August 2006 : Data Mining 101: Tools and tten, I.H. and Frank, E. 1999. Data Mining:Practical Machine LearningTools and Techniques with Java Implementations. Morgan Kauffman,San Francisco, CA.Baker, R.S.J.d.: Data Mining for Education. In: McGaw, B., Peterson, P.,Baker, E. (eds.) To appear in International Encyclopedia of Education,3rd edn. Elsevier, Oxford (2010)Baker, R. S. J. D., & Yacef, K. (2009). The state of educational datamining in 2009: A review and future visions. Journal of Educational DataMining, 1(1), 3-17.Graham Williams, Rattle: A Data Mining GUI for R, The R Journal Vol.1/2, December 2009 ISSN 2073-4859.SAMPLE DATA FOR YEAR -WISE COLLEGE -WISE CATEGORY-WISE LOCATION-WISE DATA OF THE B.A. 0072.73Performance11113Location1111124 P a g ewww.ijacsa.thesai.org
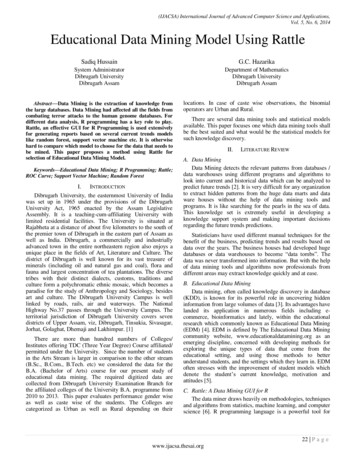
(IJACSA) International Journal of Advanced Computer Science and Applications,Vol. 5, No. 6, 2014TABLE II.Year2010201020102010SAMPLE DATA FOR YEAR -WISE COLLEGE -WISE GENDER-WISE DATA OF THE B.A. 687.88Performance1111Fig. 1. Cumulative Diagram showing category-wise, Pass Percentage-wise, Performance-wise distribution on the b
Keywords—Educational Data Mining; R Programming; Rattle; ROC Curve; Support Vector Machine; Random Forest I. INTRODUCTION Dibrugarh University, the easternmost University of India was set up in 1965 under the provisions of the Dibrugarh University Act, 1965 enacted by the Assam Legislative Assembly. It is a teaching-cum-affiliating University with limited residential facilities. The .