Transcription
Data Science with RIntroducing Data Mining with Rattle and RGraham.Williams@togaware.comSenior Director and Chief Data Miner, AnalyticsAustralian Taxation OfficeVisiting Professor, SIAT, Chinese Academy of SciencesAdjunct Professor, Australian National UniversityAdjunct Professor, University of CanberraFellow, Institute of Analytics Professionals of ning.togaware.comhttp: // togaware. comCopyright 2013, Graham.Williams@togaware.com1/35
Overview1An Introduction to Data Mining2The Rattle Package for Data Mining3Moving Into R4Getting Started with Rattlehttp: // togaware. comCopyright 2013, Graham.Williams@togaware.com2/35
An Introduction to Data MiningOverview1An Introduction to Data Mining2The Rattle Package for Data Mining3Moving Into R4Getting Started with Rattlehttp: // togaware. comCopyright 2013, Graham.Williams@togaware.com3/35
An Introduction to Data MiningData Mining and Big DataApplication ofMachine LearningStatisticsSoftware Engineering and Programming with DataIntuitionTo Big Data — Volume, Velocity, Variety. . . to discover new knowledge. . . to improve business outcomes. . . to deliver better tailored serviceshttp: // togaware. comCopyright 2013, Graham.Williams@togaware.com4/35
An Introduction to Data MiningThe Business of Data MiningAustralian Taxation OfficeLodgment ( 110M)Tax Havens ( 150M)Tax Fraud ( 250M)IBM Buys SPSS for 1.2B in 2009SAS has annual revenue approaching 3BAnalytics is 100B businessAmazon, eBay/PayPal, Google . . .http: // togaware. comCopyright 2013, Graham.Williams@togaware.com5/35
An Introduction to Data MiningBasic Tools: Data Mining AlgorithmsLinear Discriminant Analysis (lda)Logistic Regression (glm)Decision Trees (rpart, wsrpart)Random Forests (randomForest, wsrf)Boosted Stumps (ada)Neural Networks (nnet)Support Vector Machines (kernlab).That’s a lot of tools to learn in R!Many with different interfaces and options.http: // togaware. comCopyright 2013, Graham.Williams@togaware.com6/35
The Rattle Package for Data MiningOverview1An Introduction to Data Mining2The Rattle Package for Data Mining3Moving Into R4Getting Started with Rattlehttp: // togaware. comCopyright 2013, Graham.Williams@togaware.com7/35
The Rattle Package for Data MiningWhy a GUI?Statistics can be complex and traps awaitSo many tools in R to deliver insightsEffective analyses should be scriptedScripting also required for repeatabilityR is a language for programming with dataHow to remember how to do all of this in R?How to skill up 150 data analysts with Data Mining?http: // togaware. comCopyright 2013, Graham.Williams@togaware.com8/35
The Rattle Package for Data MiningUsers of RattleToday, Rattle is used world wide in many industriesHealth analyticsCustomer segmentation and marketingFraud detectionGovernmentIt is used byConsultants and Analytics Teams across businessUniversities to teach Data MiningIt is and will remain freely available.CRAN and http://rattle.togaware.comhttp: // togaware. comCopyright 2013, Graham.Williams@togaware.com9/35
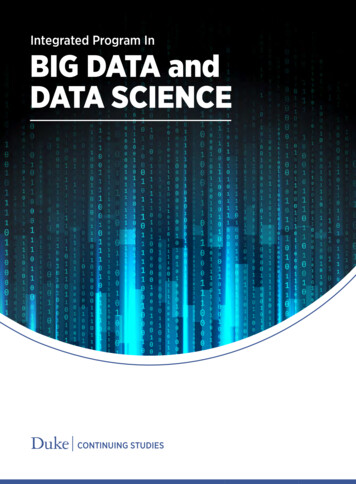
The Rattle Package for Data MiningA Tour Thru Rattle: Startuphttp: // togaware. comCopyright 2013, Graham.Williams@togaware.com10/35
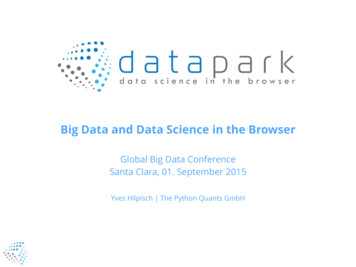
The Rattle Package for Data MiningA Tour Thru Rattle: Loading Datahttp: // togaware. comCopyright 2013, Graham.Williams@togaware.com11/35
The Rattle Package for Data MiningA Tour Thru Rattle: Explore Distributionhttp: // togaware. comCopyright 2013, Graham.Williams@togaware.com12/35
The Rattle Package for Data MiningA Tour Thru Rattle: Explore Correlationshttp: // togaware. comCopyright 2013, Graham.Williams@togaware.com13/35
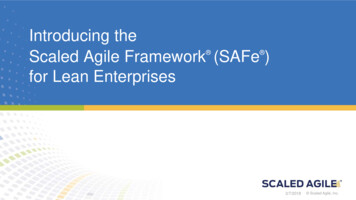
The Rattle Package for Data MiningA Tour Thru Rattle: Hierarchical Clusterhttp: // togaware. comCopyright 2013, Graham.Williams@togaware.com14/35
The Rattle Package for Data MiningA Tour Thru Rattle: Decision Treehttp: // togaware. comCopyright 2013, Graham.Williams@togaware.com15/35
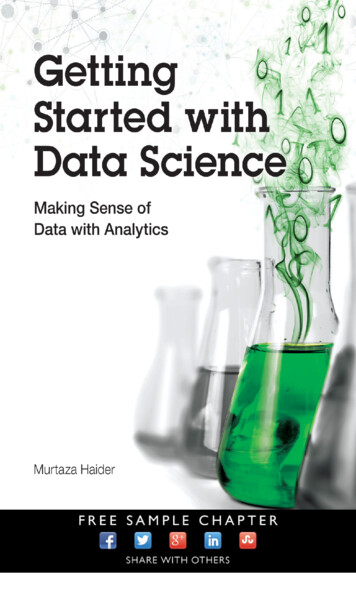
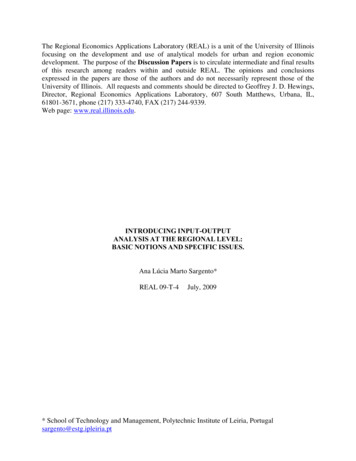
The Rattle Package for Data MiningA Tour Thru Rattle: Decision Tree Plothttp: // togaware. comCopyright 2013, Graham.Williams@togaware.com16/35
The Rattle Package for Data MiningA Tour Thru Rattle: Random Foresthttp: // togaware. comCopyright 2013, Graham.Williams@togaware.com17/35
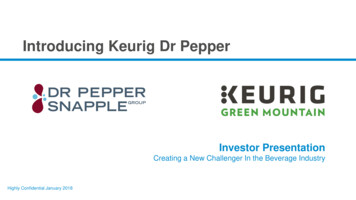
The Rattle Package for Data MiningA Tour Thru Rattle: Risk Charthttp: // togaware. comCopyright 2013, Graham.Williams@togaware.com18/35
Moving Into ROverview1An Introduction to Data Mining2The Rattle Package for Data Mining3Moving Into R4Getting Started with Rattlehttp: // togaware. comCopyright 2013, Graham.Williams@togaware.com19/35
Moving Into RData Miners are Programmers of DataData miners are programmers of dataA GUI can only do so muchR is a powerful statistical languageProfessional data miningScriptingTransparencyRepeatabilityhttp: // togaware. comCopyright 2013, Graham.Williams@togaware.com20/35
Moving Into RFrom GUI to CLI — Rattle’s Log Tabhttp: // togaware. comCopyright 2013, Graham.Williams@togaware.com21/35
Moving Into RFrom GUI to CLI — Rattle’s Log Tabhttp: // togaware. comCopyright 2013, Graham.Williams@togaware.com22/35
Moving Into RStep 1: Identify the Datadsname target risk form ds dim(ds)"weather""RainTomorrow""RISK MM"formula(paste(target, " ."))get(dsname)## [1] 36624names(ds)## [1]## [5]## [9]## [13].http: // togaware. right "MinTemp""Sunshine""WindDir3pm""Humidity3pm"2013, Graham.Williams@togaware.com".".".".23/35
Moving Into RStep 2: Observe the Datahead(ds)#### 1## 2## 3## 4## -11-05Location MinTemp MaxTemp Rainfall 6.12.8.tail(ds)#### 361## 362## 363## 364## 08-10-30http: // togaware. comLocation MinTemp MaxTemp Rainfall ht 2013, Graham.Williams@togaware.com24/35
Moving Into RStep 2: Observe the Datastr(ds)## 'data.frame': 366 obs. of 24 variables:## Date: Date, format: "2007-11-01" "2007-11-.## Location: Factor w/ 46 levels "Adelaide","Alba.## MinTemp: num 8 14 13.7 13.3 7.6 6.2 6.1 8.3 .## MaxTemp: num 24.3 26.9 23.4 15.5 16.1 16.9 1.## Rainfall: num 0 3.6 3.6 39.8 2.8 0 0.2 0 0 16.summary(ds)##Date## Min.:2007-11-01## 1st Qu.:2008-01-31## Median :2008-05-01## Mean:2008-05-01## 3rd Qu.:2008-07-31.http: // togaware. comCopyrightLocationCanberra:366Adelaide: 0Albany: 0Albury: 0AliceSprings : 0 MinTemp .Min.:-5.3.1st Qu.: 2.3.Median : 7.4.Mean: 7.2.3rd Qu.:12.5.2013, Graham.Williams@togaware.com25/35
Moving Into RStep 3: Clean the Data — Identify Variables(ignore - c(names(ds)[c(1,2)], risk))## [1] "Date""Location" "RISK MM"(vars - setdiff(names(ds), ignore))## [1]## [5]## [9]## ".".".".dim(ds[vars])## [1] 366http: // togaware. com21Copyright 2013, Graham.Williams@togaware.com26/35
Moving Into RStep 3: Clean the Data — Remove Missingdim(ds[vars])## [1] 36621sum(is.na(ds[vars]))## [1] 47ds - na.omit(ds[vars])sum(is.na(ds))## [1] 0dim(ds)## [1] 328http: // togaware. com21Copyright 2013, Graham.Williams@togaware.com27/35
Moving Into RStep 3: Clean the Data—Target as Categoricsummary(ds[target])##RainTomorrow## Min.:0.000## 1st Qu.:0.000## Median :0.000## Mean:0.183## 3rd Qu.:0.000## Max.:1.000.ds[target] - as.factor(ds[[target]])levels(ds[target]) - c("No", "Yes")summary(ds[target])######RainTomorrow0:2681: 60http: // togaware. comCopyright 2013, Graham.Williams@togaware.com28/35
Moving Into RStep 4: Build the Model—Train/Test(n - nrow(ds))## [1] 328train - sample(1:n, 0.70*n)length(train)## [1] 229test - setdiff(1:n, train)length(test)## [1] 99http: // togaware. comCopyright 2013, Graham.Williams@togaware.com29/35
Moving Into RStep 4: Build the Model—Random Forestlibrary(randomForest)## randomForest 4.6-7## Type rfNews() to see new features/changes/bug fixes.m - randomForest(form, ds[train,])m#### Call:## randomForest(formula form, data ds[train, ])##Type of random forest: classification##Number of trees: 500## No. of variables tried at each split: 4####OOB estimate of error rate: 12.23%## Confusion matrix:.http: // togaware. comCopyright 2013, Graham.Williams@togaware.com30/35
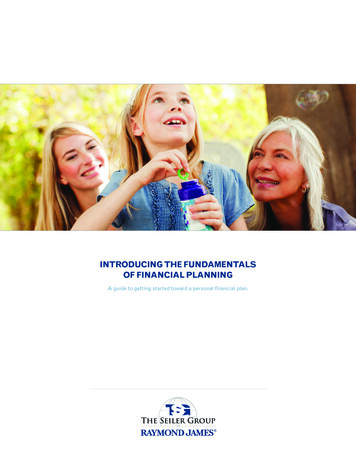
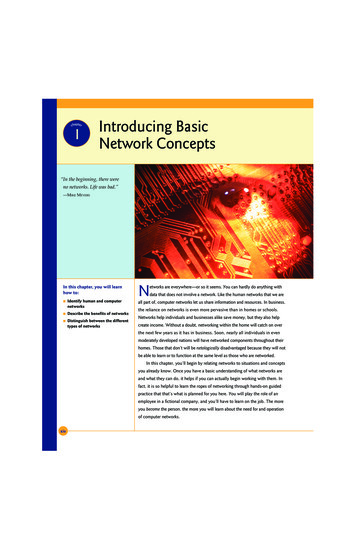
Moving Into RStep 5: Evaluate the Model—Risk Chartpr - predict(m, ds[test,], type "prob")[,2]ev - evaluateRisk(pr, ds[test, target], ds[test, 20.1Lift65Performance (%)75450322515%1Recall (70%)Precision00306090Caseload (%)http: // togaware. comCopyright 2013, Graham.Williams@togaware.com31/35
Getting Started with RattleOverview1An Introduction to Data Mining2The Rattle Package for Data Mining3Moving Into R4Getting Started with Rattlehttp: // togaware. comCopyright 2013, Graham.Williams@togaware.com32/35
Getting Started with RattleInstallationRattle is built using RNeed to download and install R from cran.r-project.orgRecommend also install RStudio from www.rstudio.orgThen start up RStudio and install Rattle:install.packages("rattle")Then we can start up Rattle:rattle()Required packages are loaded as needed.http: // togaware. comCopyright 2013, Graham.Williams@togaware.com33/35
Getting Started with RattleResources and ReferencesRattle: http://rattle.togaware.comOnePageR: http://onepager.togaware.comGuides: http://datamining.togaware.comPractise: http://analystfirst.comBook: Data Mining using Rattle/RChapter: Rattle and Other TalesPaper: A Data Mining GUI for R — R Journal, Volume 1(2)http: // togaware. comCopyright 2013, Graham.Williams@togaware.com34/35
That Is All FolksTime For QuestionsThank Youhttp: // togaware. comCopyright 2013, Graham.Williams@togaware.com35/35
The Rattle Package for Data Mining Users of Rattle Today, Rattle is used world wide in many industries Health analytics Customer segmentation and marketing Fraud detection Government It is used by Consultants and Analytics Teams across business Universities to teach Data Mining It is and will remain freely available. CRAN and http://rattle.togaware.com