Transcription
WHAT WORKS ONWALL STREET
OTHER BOOKS BY JAMES P. O’SHAUGHNESSYInvest Like the Best: Using Your Computer to Unlock the Secrets of theTop Money ManagersHow to Retire Rich: Time-Tested Strategies to Beat the Market andRetire in Style
WHAT WORKS ONWALL STREETA Guide to the BestPerforming InvestmentStrategies of All TimeJAMES P. O’SHAUGHNESSYThird EditionMcGraw-HillNew York Chicago San Francisco Lisbon London MadridMexico City Milan New Delhi San Juan SeoulSingapore Sydney Toronto
Copyright 2005 by James P. O’Shaughnessy. All rights reserved. Manufactured in the United States ofAmerica. Except as permitted under the United States Copyright Act of 1976, no part of this publicationmay be reproduced or distributed in any form or by any means, or stored in a database or retrievalsystem, without the prior written permission of the publisher.0-07-146961-3The material in this eBook also appears in the print version of this title: 0-07-145225-7.All trademarks are trademarks of their respective owners. Rather than put a trademark symbol after everyoccurrence of a trademarked name, we use names in an editorial fashion only, and to the benefit of thetrademark owner, with no intention of infringement of the trademark. Where such designations appear inthis book, they have been printed with initial caps. McGraw-Hill eBooks are available at special quantitydiscounts to use as premiums and sales promotions, or for use in corporate training programs. For moreinformation, please contact George Hoare, Special Sales, at george hoare@mcgraw-hill.com or (212)904-4069.TERMS OF USEThis is a copyrighted work and The McGraw-Hill Companies, Inc. (“McGraw-Hill”) and its licensorsreserve all rights in and to the work. Use of this work is subject to these terms. Except as permitted underthe Copyright Act of 1976 and the right to store and retrieve one copy of the work, you may notdecompile, disassemble, reverse engineer, reproduce, modify, create derivative works based upon,transmit, distribute, disseminate, sell, publish or sublicense the work or any part of it without McGrawHill’s prior consent. You may use the work for your own noncommercial and personal use; any other useof the work is strictly prohibited. Your right to use the work may be terminated if you fail to complywith these terms.THE WORK IS PROVIDED “AS IS.” McGRAW-HILL AND ITS LICENSORS MAKE NOGUARANTEES OR WARRANTIES AS TO THE ACCURACY, ADEQUACY OR COMPLETENESSOF OR RESULTS TO BE OBTAINED FROM USING THE WORK, INCLUDING ANYINFORMATION THAT CAN BE ACCESSED THROUGH THE WORK VIA HYPERLINK OROTHERWISE, AND EXPRESSLY DISCLAIM ANY WARRANTY, EXPRESS OR IMPLIED,INCLUDING BUT NOT LIMITED TO IMPLIED WARRANTIES OF MERCHANTABILITY ORFITNESS FOR A PARTICULAR PURPOSE. McGraw-Hill and its licensors do not warrant orguarantee that the functions contained in the work will meet your requirements or that its operation willbe uninterrupted or error free. Neither McGraw-Hill nor its licensors shall be liable to you or anyone elsefor any inaccuracy, error or omission, regardless of cause, in the work or for any damages resultingtherefrom. McGraw-Hill has no responsibility for the content of any information accessed through thework. Under no circumstances shall McGraw-Hill and/or its licensors be liable for any indirect,incidental, special, punitive, consequential or similar damages that result from the use of or inability touse the work, even if any of them has been advised of the possibility of such damages. This limitation ofliability shall apply to any claim or cause whatsoever whether such claim or cause arises in contract, tortor otherwise.DOI: 10.1036/0071469613
To Lael, Kathryn, Patrick, and Melissa
ABOUT THE AUTHORJames P. O’Shaughnessy is the Director of Systematic Equity for Bear StearnsAsset Management and a Senior Managing Director of the firm.O’Shaughnessy’s investment strategies have been featured in The Wall StreetJournal, Barron’s, The New York Times, The Washington Post, Investor’sBusiness Daily, The Financial Times, London’s Daily Mail, Japan’s NikkeiShimbun Daily, and many other publications worldwide, as well as on NBC’s“Today Show,” ABC’s “The Oprah Winfrey Show,” CNBC, and CNN.Copyright 2005 by James P. O’Shaughnessy. Click here for terms of use.
Wait for the wisest of all counselors, time.—Pericles
This page intentionally left blank.
For more information about this title, click hereC O N T E N T SPreface xviiiAcknowledgmentsxxChapter 1Stock Investment Strategies: Different Methods, Similar GoalsTraditional Active Management Doesn’t WorkWhat’s the Problem? 3Studying the Wrong Things 5Why Indexing Works 5Pinpointing Performance 7Discipline Is the Key 7Consistency Wins 8A Structured Portfolio in Action 8Overwhelmed by Our Nature 9Case Study: The Dogs of the Dow 912Chapter 2The Unreliable Experts: Getting in theWay of Outstanding Performance 13Human Judgment Is Limited 14What’s the Problem? 15Why Models Beat Humans 15Base Rates Are Boring 17The Individual versus the Group 18Personal Experience Preferred 19Simple versus Complex 20A Simple Solution 21Additional Reading 23Case Study: Using Long-Term Data to MakePredictions about the Future 24ix
xContentsChapter 3Rules of the Game31Short Periods Are Valueless 32Anecdotal Evidence Is Not EnoughPotential Pitfalls 35Rules of the Game 3834Chapter 4Ranking Stocks by Market Capitalization: Size Matters49Best of Times, Worst of Times 51How Much Better Are Small-Cap Stocks? 55Reviewing Stocks by Size 57Small Stocks and Market Leaders 59Small Stocks Are the Winners, But Not by Much 60Market Leaders and Small Stocks: A Better Way to Create an IndexImplications for Investors 69Our Two Benchmarks 70Chapter 5Price-to-Earnings Ratios: Separating the Winners and LosersThe Results 72Large Stocks Are Different 76High PE Ratios Are Dangerous 77Large Stocks Fare No Better 83Best- and Worst-Case Returns 84Deciles 84Implications 84Following This Advice in Real Time 88Chapter 6Price-to-Book Ratios: A Better Gauge of ValueThe Results 92Large Stocks Are Less Volatile 93Large Stocks Base Rates Are More Consistent91957160
ContentsxiHigh Price-to-Book Stocks—A Wild Ride to NowhereLarge Stocks Are No Different 101Best- and Worst-Case Returns 102Deciles 103Implications 10496Chapter 7Price-to-Cashflow Ratios: Using Cash to Determine ValueThe Results 110Large Stocks Are Less Volatile 112Worst-Case Scenarios and Best and Worst Returns 113High Price-to-Cashflow Ratios Are Dangerous 116Large Stocks Hit Too 120Worst-Case Scenario and Best and Worst Returns 122Deciles 123Implications 126Chapter 8Price-to-Sales Ratios: The King of the Value FactorsThe Results127128Large Stocks with Low Price-to-Sales Ratios Do WellBest- and Worst-Case Scenarios 132High PSR Stocks Are Toxic 134Large Stocks Do a Little Better 135Deciles 139Implications 142Chapter 9Dividend Yields: Buying an IncomeThe Results 144Large Stocks Entirely DifferentWorst-Case Scenarios 150Deciles 151Implications 153148143131109
xiiContentsChapter 10The Value of Value Factors155Risk Doesn’t Always Equal Reward 156Is It Worth the Risk? 157Embrace Consistency 159Large Stocks Are More Consistent 160Implications 163Learning to Focus on the Long Term 165Chapter 11Do High Earnings Gains Mean High Performance?167Examining Annual Earnings Changes 168Large Stocks Do Worse 170Best- and Worst-Case Returns 171Buying Stocks with the Worst Earnings Changes 173Large Stocks Do Better 174Best- and Worst-Case Scenarios 178Deciles 180Implications 180Case Study: Do Sales Increases Work Better Than Earnings Gains?Chapter 12Five-Year Earnings-per-Share Percentage ChangesThe Results 185Large Stocks Slightly Outperform UniverseBest- and Worst-Case Returns 191Deciles 192Implications 194185189Chapter 13Profit Margins: Do Investors Profit from Corporate Profits?The Results 197Large Stocks Do Better 199Best and Worst Case Returns 203197183
ContentsxiiiDeciles 205Implications 205Chapter 14Return on Equity209The Results 209Large Stocks Are the Same 213Worst-Case Scenarios and Best and Worst ReturnsDecile 216Implications 218215Chapter 15Relative Price Strength: Winners Continue to Win221The Results 222Large Stocks Do Better 227Why Price Performance Works While Other Measures Do Not 229Worst-Case Scenarios and Best and Worst Returns 230Buying the Worst Performing Stocks 230Large Stocks Also Hit 232Best- and Worst-Case Returns 234Deciles 235Implications 238Case Study: How Well Does Longer-Term Relative Strength Work? 238Chapter 16Using Multifactor Models to Improve PerformanceAdding Value Factors 243Base Rates Improve 245What about Other Value Factors? 245Price-to-Sales Has Similar Returns 247Combining the Three Strategies 248Test for Deviation from Benchmark 249Additional Factors Add Less to Large StocksPrice-to-Sales Ratios Do Well, Too 252What about Growth Factors? 253250243
xivContentsTwo Growth Models 253Return on Equity Does Better 255Large Stocks Less Dramatic 256Implications 257Chapter 17Dissecting the Market Leaders Universe:Ratios That Add the Most Value 259New Period Examined 261Summary Results for Various Market Leaders StrategiesMultifactor Strategies Also Do Well 264Base Rates 264Worst-Case Scenarios 265Implications 265Best of Market Leaders Found in Chapter 19 267262Chapter 18Dissecting the Small Stocks Universe:Ratios That Add the Most Value 269Monthly Data Reviewed, Summary Data Accessed 270Base Rates 273Worst-Case Scenarios 274Implications 275Case Study: A Note on Small-Cap Concentrated Investing277Chapter 19Searching for the Ideal Value Stock Investment StrategyFocusing on Downside Risk and Return 282A Superior All-Stocks Value Strategy 282Market Leaders by Dividend and Shareholder ValueImproving on the Best 286Digging Deeper 288Real-Time Performance 289Investing in a More Concentrated Portfolio 289Implications 291281284
ContentsxvChapter 20Searching for the Ideal Growth Strategy295Original Cornerstone Growth Strategy Revisited 295Traditional Growth Factors Work, But Provide Lower Overall ReturnLarge Stocks Cornerstone Growth Strategy Works Well, Too 299Improving the Original Strategy 301Base Rates Also Improve 303Implications 303Case Study: Using More Concentrated Versions of the Growth StrategyChapter 21Uniting Strategies for the Best Risk-Adjusted PerformanceThe Results 31050-Stock Version Works Well, TooA Broader Approach 313Implications 316311Chapter 22New Research Initiatives319Limited Statistics 320Seasonal Analysis 321Testing Holding Periods 324Randomization of In-Sample Data and TestingStrategies on Other Databases 325Sector-Specific Analysis 326Summation Models 327Correlation Matrix Analysis 327Regression to Long-Term Mean within StrategiesFuture Projects 332Chapter 23Ranking the StrategiesThe Results 336Absolute Returns 337The Downside 346335331309298307
xviRisk-Adjusted Returns 347Ranking by Sharpe Ratio 356The Worst Risk-Adjusted ReturnsDownside Risk 357The Downside 365Maximum Decline 366The Downside 367Blended Strategies 367Implications 376Contents357Chapter 24Getting the Most Out of Your Equity InvestmentsAlways Use Strategies 378Ignore the Short-Term 379Use Only Strategies Proven over the Long-TermDig Deep 381Invest Consistently 381Always Bet with the Base Rate 382Never Use the Riskiest Strategies 382Always Use More Than One Strategy 382Use Multifactor Models 383Insist on Consistency 383The Stock Market Is Not Random 383Appendix 385Bibliography 393Index 403377380
P R E F A C EThe more original a discovery, the more obvious it seems afterward.—Arthur Koestleratrick Henry was right when he proclaimed that the only way to judge thefuture was by the past. To make the best investment plans for the future,investors need access to unbiased, long-term performance results. It doesn’tmatter if they are aggressive investors seeking fast growth or conservativeinvestors seeking low-risk, high-yielding stocks for their retirement account.Knowing how a particular investment strategy performed historically givesyou vital information about its risk, variability, and persistence of returns.Access to long-term performance results lets you make informed choices,based on facts—not hype.This third edition of What Works on Wall Street continues to offer readers access to long-term studies of Wall Street’s most popular investmentstrategies. Prior to its initial publication, no widely available, comprehensiveguides were available to which strategies are long-term winners and whichare not. Here, I show how a careful reader of earlier editions could haveavoided much of the carnage the bear market of 2000 through 2002inflicted—simply by avoiding the types of stocks that, while popular duringthe stock market bubble of the late 1990s, had historically shown themselvesto be horrible long-term performers. All these recommendations were in placeprior to the stock market bubble and ensuing bear market. Most of the advicederived from this long-term analysis is the same today as it was nine yearsago. Of great interest is to see how well these strategies have performed inreal time, thus helping us take the guidance history offers us to heart.All the tests in this book continue to use Standard & Poor’s Compustatdatabase, the largest, most comprehensive database of U.S. stock marketinformation available. In this edition of this book, I use FactSet’s Alpha Testerand Backtester to run the tests.PORIGINSIt took the combination of fast computers and huge databases likeCompustat to prove that a portfolio’s returns are essentially determined bythe factors that define the portfolio. Before computers, it was almost imposxviiCopyright 2005 by James P. O’Shaughnessy. Click here for terms of use.
xviiisible to determine what strategy guided any given portfolio. The number ofunderlying factors (characteristics that define a portfolio like price-to-earnings [PE] ratio, dividend yield, etc.) an investor could consider seemed endless. The best you could do was look at portfolios in the most general ways.Sometimes even a professional manager didn’t know which particular factorsbest characterized the stocks in his or her portfolio, relying more often ongeneral descriptions and other qualitative measures.Computers changed this. We now can analyze a portfolio and see whichfactors, if any, separate the best-performing strategies from the mediocre.With computers, we also can test combinations of factors over long periods,showing us what to expect in the future from any given investment strategy.MOST STRATEGIES ARE MEDIOCREWhat Works on Wall Street shows that most investment strategies aremediocre, and the majority, particularly those most appealing to investorsover the short-term, fail to beat the simple strategy of indexing to the S&P500. This book also provides evidence that conflicts with the academic theory that stock prices follow a random walk scenario.Rather than moving about without rhyme or reason, the stock marketmethodically rewards certain investment strategies while punishing others.What Works on Wall Street’s 52 years of returns show there’s nothing random about long-term stock market returns. Investors can do much betterthan the market if they consistently use time-tested strategies that are basedon sensible, rational methods for selecting stocks.DISCIPLINE IS KEYWhat Works on Wall Street shows that the only way to beat the market overthe long-term is to consistently use sensible investment strategies. Eighty percent of the mutual funds covered by Morningstar fail to beat the S&P 500because their managers lack the discipline to stick with one strategy throughthick and thin. This lack of discipline devastates long-term performance.HIGHLIGHTSAfter reading What Works on Wall Street, investors will know that:Preface
Prefacexix Most small-capitalization strategies owe their superior returns tomicro-cap stocks having market capitalizations below 25 million.These stocks are too small for virtually any investor to buy. Buying low PE ratio stocks is most profitable when you stick to larger,better-known issues. The price-to-sales ratio is the most consistent value ratio to use forbuying market-beating stocks. Last year’s biggest losers are among the worst stocks you can buy. Last year’s earnings gains alone are worthless when determining if astock is a good investment. Using several factors dramatically improves long-term performance. You can do ten times as well as the S&P 500 by concentrating onlarge, well-known stocks with high shareholder yield. Relative strength is the only growth variable that consistently beatsthe market, but it must always be matched with other factors to mitigate its high levels of risk. Buying Wall Street’s current darlings having the highest PE ratios isone of the worst things you can do. A strategy’s risk is one of the most important elements to consider. Uniting growth and value strategies is the best way to improve yourinvestment performance.
A C K N O W L E D G M E N T Shis book would not have been possible without the help of many people.When I started this project several years ago, Jim Branscome, then head ofS&P Compustat, was a champion of the project at every turn. His successor,Paul Cleckner, was also extraordinarily supportive and is an outstandingexample of a businessman who understands that the best way to help the bottom line of your business is to help the bottom line of thousands of ordinaryinvestors. Mitch Abeyta, the current head of Compustat, has also been wonderful to work with on the ongoing effort to improve the strategies and datacovered in the book.I owe a special thanks to my colleague, Whit Penski. A virtual wizard atsetting up backtests within the FactSet environment, Whit spent several yearsteaching other professionals how to get the most out of the database, and henow assists me on all portfolio testing and implementation. Whit spent manylate nights helping me update the new and continued tests for this edition. Iam extremely grateful to him for his important contributions. Thanks also tomy assistant portfolio manager, Luis Ferreira, who meticulously proofreadthe entire text. Like Whit, Luis has graciously given many hours of his personal time in diligently auditing all the tables and graphs in this edition of thebook, and I deeply appreciate his efforts. Also helpful was Chris Meredith, asummer intern and soon to be employee who also gave his personal time toconstructing tables and graphs for this edition.But this book would not have been finished without the continual help,support, and encouragement of my wife Melissa. I am extremely indebted toher for editing every line in this book. Without her expert hand, this bookmight never have been finished. In addition to loving her dearly, I owe anysuccess I have as an author to her.Thanks also to my entire team at Bear Stearns for their support on thisproject.TxxCopyright 2005 by James P. O’Shaughnessy. Click here for terms of use.
1CHAPTERSTOCK INVESTMENTSTRATEGIES: DIFFERENTMETHODS, SIMILAR GOALSGood intelligence is nine-tenths of any battle.—Napoleonhere are two main approaches to equity investing: active and passive. Theactive approach is most common. Here, managers attempt to maximizetheir returns at various levels of risk by buying stocks they believe are superior to others. Usually, the managers follow similar routes to investigating astock. They analyze the company, interview management, talk to customersand competitors, review historical trends and current forecasts, and thendecide if the stock is worth buying.Active investors are guided by styles, broadly called growth and value.What type of stock they buy depends largely on their underlying philosophy.G rowth investors buy stocks that have higher-than-average growth in sales ande a rnings, with expectations for more of the same. Growth investors believe ina company’s potential and think a stock’s price will follow its earnings higher.Value investors seek stocks with current market values substantiallybelow true or liquidating value. They use factors like price-to-earnings (PE)ratios and price-to-sales ratios to identify when a stock is selling below itsintrinsic value. They bargain hunt, looking for stocks in which they can buya dollar’s worth of assets for less than a dollar. Value investors believe in acompany’s balance sheet, thinking a stock’s price will eventually rise to meetits intrinsic value.T1Copyright 2005 by James P. O’Shaughnessy. Click here for terms of use.
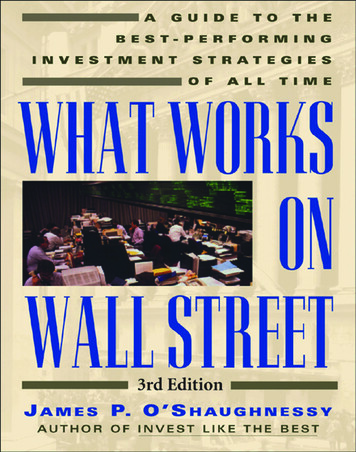
2WHAT WORKS ON WALL STREETActively managed funds often use a hodgepodge of techniques fromboth schools of investing, but the most successful have strongly articulatedstrategies. The majority of mutual funds, professionally managed pensionfunds, and separately managed individual accounts are managed with anactive approach.TRADITIONAL ACTIVE MANAGEMENT DOESN’T WORKThis makes perfect sense until you review the record of traditional, activelymanaged funds. The majority do not beat the S&P 500. This is true over bothshort and long periods. Figure 1-1 shows the percentage of those activelymanaged mutual funds in Morningstar’s database that beat the S&P 500. Thebest 10 years, ending December 31, 1994, saw only 26 percent of the traditionally managed active mutual funds beating the index. When you digdeeper and look at the percentage by which they beat the index, the news getsworse. Of the 362 funds beating the Vanguard Index (an index fund thatreplicates the S&P 500) for the 10 years ending May 31, 2004, only 152 ofthe winning funds managed to beat the index by more than 2 percent a yearon a compound basis. What’s more, this record overstates traditionally managed active funds’ performance, because it doesn’t include all the funds thatfailed to survive over the 10-year period.Passive indexing has exploded in the past decade as a result. Here,investors buy an index that they think broadly represents the market, such asthe S&P 500, and let it go at that. Their objective is to match the market, notoutperform it. They are willing to give up their shot at outperforming themarket for the security of not underperforming it. Since the publication of thefirst edition of this book in 1996, index managers have continued to see theirassets under management soar: According to the September 15, 2003 issue ofPensions & Investments, “worldwide indexed assets under managementclimbed to 2.8 trillion as of June 30 (and) U.S. equity indexed assets madeup 1.5 trillion, or 54% of all worldwide indexed assets.” The institutionalpension plans have led the way, but retail investors are right on their heels.As of December 31, 2003, over 300 Index Funds were listed in Morningstar’sPrincipia database, and Vanguard’s 500 Index fund is now the largest equitymutual fund in the United States, with over 96 billion in assets under management. What’s more, since 1996, the popularity of Exchange Traded Funds(ETFs)—index funds that are listed and traded on exchanges like stocks—hasexploded, furthering what amounts to a revolution in investment management characterized by investors continuing to flock to more structured, disciplined investment strategies.
Stock Investment Strategies: Different Methods, Similar 2000200120022003F I G U R E 1-1Percent of all equity funds with 10-year track records beating Standard & Poor’s 500 for the 10years ending December 31 in each year.Source: Morningstar, Inc.WHAT’S THE PROBLEM?Conventional academics aren’t surprised that traditionally managed fundsfail to beat the market. Most have long held that markets are efficient andthat current security prices reflect all available information. They argue thatprices follow a random walk and move without rhyme or reason. Accordingto their theories, you might as well have a monkey throw darts at a stockpage as attempt analysis, because stock prices are random and cannot bepredicted.The long-term evidence in this book contradicts the random walk theory. Far from following a random walk, the evidence continues to reveal apurposeful stride. The 52 years of data found in this book proves strongreturn predictability. What’s more, this return predictability continues to persist even after the first edition of this book was published in 1996. The market clearly and consistently rewards certain attributes (e.g., stocks with lowprice-to-sales ratios) and clearly and consistently punishes others (e.g., stockswith high price-to-sales ratios) over long periods. Yet the paradox remains: If
4WHAT WORKS ON WALL STREETour historical tests, as well as the real-time results we have generated with thestrategies since the initial publication of this book, show such high return predictability, why do 80 percent of traditionally managed mutual funds continually fail to beat the S&P 500?Finding exploitable investment opportunities does not mean it’s easy tomake money, however. To do so requires the ability to consistently, patiently,and slavishly stick with a strategy, even when it’s performing poorly relativeto other methods. One of the central themes of this book is that all strategieshave performance cycles in which they over- and underperform their relevantbenchmarks. The key to outstanding long-term performance is to find a strategy that has the highest base rate, or batting average, (more on that later) andthen stick with that strategy, even when it is underperforming other strategiesand benchmarks. Few are capable of such action. Successful investors do notcomply with nature, they defy it. Most investors react very emotionally to theshort-term gyrations of the market, and I’ve seen many who follow my strategies and portfolios in real time say: “Well, these strategies used to work, butthey don’t anymore” after just a few months of underperformance. In thenext chapter, I argue that the reason traditional management doesn’t workwell is because human decision-making is systematically flawed and unreliable. This provides an opportunity to those who use a rational, disciplinedmethod to buy and sell stocks using time-tested methods, essentially allowingthe disciplined investor to arbitrage human nature.Since the first edition of this book was published in 1996, a school ofacademic thought called Behavioral Economics has emerged to explain whythese performance anomalies continue to exist even after being written aboutextensively. This work has received a great deal of public attention and centers around a new paradigm for evaluating how people actually make investment choices. In his book Behavioral Finance: Insights into Irrational Mindsand Markets, James Montier writes:This is the world of behavioral finance, a world in which humanemotions rule, logic has its place, but markets are moved as muchby psychological factors as by information from corporate balance sheets [T]he models of classical finance are fatally flawed.They fail to produce predictions that are even vaguely close to theoutcomes we observe in real financial markets Of course, nowwe need some understanding of what causes markets to deviatefrom their fundamental value. The answer quite simply is humanbehavior.While I will examine some of the tenants of behavioral finance inChapter 2, one of the principal reasons classically trained economists were getting the wrong answers was because they were asking the wrong questions.
Stock Investment Strategies: Different Methods, Similar Goals5STUDYING THE WRONG THINGSIt’s no surprise that academics find traditionally managed stock portfoliosfollowing a random walk. Most traditional managers’ past records cannotpredict future returns, because their behavior is inconsistent. You cannotmake forecasts based on inconsistent behavior, because when you behaveinconsistently, you are unpredictable. Even if a manager is a perfectly consistent investor—a hallmark of the best money managers—if that managerleaves the fund, all predictive ability from past performance is lost. Moreover,if a manager changes his or her style, all predictive ability from past performance is also lost. Traditional academics, therefore, have been measuring thewrong things. They assume perfect, rational behavior in a capricious environment ruled by greed, hope, and fear. They have been contrasting the returnsof a passively held portfolio—the S&P 500—with the returns of portfoliosmanaged in an inconsistent, shoot-from-the-hip style. Track records areworthless unless you know what strategy the manager uses and if it is stillbeing used. When you study a traditionally managed fund, you’re really looking at two things: first, the strategy used and second, the ability of the manager to implement it successfully. It makes much more sense to contrast theone-factor (in this case, market capitalization) S&P 500 portfolio with otherone or multifactor portfolios.WHY INDEXING WORKSIndexing to the S&P 500 works because it sidesteps flawed decision-makingand automates the simple strategy of buying the big stocks that make up theS&P 500. The mighty S&P 500 consistently beats 80 percent of traditionallymanaged funds over the long-term by doing nothing more than making a disciplined bet on large capitalization stocks. Figure 1-2 compares the returns onthe S&P 500 with those for our Large Stocks universe, which consists of allthe stocks in the Compustat database having market capitalizations greaterthan the database mean in any given year. This effectively limits us to the top15 percent of the Compustat database by market capitalization. Stocks arethen bought in equal dollar amounts. The returns are virtually identical. 10,000 invested in the S&P 500 on December 31, 1951, was worth 2,896,700 on December 31, 2003, a compound return of 11.52 percent.The same 10,000 invested in our Large Stock universe was worth 3,173,724, a compound return of 11.71 percent. (Both include the reinvestment of all dividends.) And it’s not just the absolute return
OTHER BOOKS BY JAMES P. O’SHAUGHNESSY Invest Like the Best: Using Your Computer to Unlock the Secrets of the . High Price-to-Book Stocks—A Wild Ride to Nowhere 96 Large Stocks Are No Different 101 Best- and Worst-Case Returns 102 Deciles 103 Implicatio