Transcription
radiation damageJournal ofSynchrotronRadiationISSN 0909-0495Received 28 June 2008Accepted 27 November 2008A new on-axis multimode spectrometer for themacromolecular crystallography beamlines of theSwiss Light SourceRobin L. Owen,a‡2 Arwen R. Pearson,b Alke Meents,a}4Pirmin Boehler,aVincent Thomineta and Clemens Schulze-Briesea*aSwiss Light Source, Paul Scherrer Institute, CH-5232 Villigen PSI, Switzerland, and bAstbury Centrefor Structural Molecular Biology, Astbury Building, The University of Leeds, Leeds LS2 9JT, UK.E-mail: clemens.schulze@psi.chX-ray crystallography at third-generation synchrotron sources permits tremendous insight into the three-dimensional structure of macromolecules. Additionalinformation is, however, often required to aid the transition from structure tofunction. In situ spectroscopic methods such as UV–Vis absorption and(resonance) Raman can provide this, and can also provide a means of detectingX-ray-induced changes. Here, preliminary results are introduced from an onaxis UV–Vis absorption and Raman multimode spectrometer currently beingintegrated into the beamline environment at X10SA of the Swiss Light Source.The continuing development of the spectrometer is also outlined.Keywords: single-crystal microspectrophotometry; kinetic crystallography; structuralenzymology; radiation damage; macromolecular crystallography; complementarytechniques.1. IntroductionIn order to fully understand biological processes, a knowledgeof the atomic structure of the macromolecules involved isessential. The most common method of structure determination is X-ray crystallography, and the many protein and DNAstructures already determined have provided incredibleinsights into the molecular underpinnings of life. Most X-raycrystal structures, however, are static average snapshots of amolecule and only yield information about a single state of acomplex reaction. In addition, the deleterious effects ofradiation damage can cast uncertainty on the validity of themodel itself. More information about function can be obtainedvia kinetic crystallography, and one form this can take issoaking experiments. These take advantage of the fact that, aslong as the active site is not blocked by crystal packing, andturnover does not require any major structural rearrangements that could disrupt the crystalline lattice, many enzymesretain their catalytic activity in the crystalline state. By soakingin a substrate and flash-cooling the crystal in liquid nitrogen,intermediate species can be freeze-trapped for structuredetermination (Kovaleva & Lipscomb, 2007; Schlichting &Chu, 2000; Katona et al., 2007). Identification of the trappedspecies, however, is limited by the resolution of the diffractiondata obtained and the occupancy of the trapped state. This‡ Present address: Diamond Light Source Ltd, Diamond House, HarwellScience and Innovation Campus, Didcot, Oxfordshire OX11 0DE, UK.} Present address: DESY, Notkestrasse 85, 22607 Hamburg, Germany.J. Synchrotron Rad. (2009). 16, 173–182is often insufficient to unambiguously assign the chemicalintermediate observed in the electron density map, especiallyin cases in which there are no large conformational changes inthe ligand and/or protein. This ambiguity highlights the needfor spectroscopic methods complementary to X-ray crystallography in structural biology to identify the exact chemicalstate of the trapped species.The most commonly accessed of these methods to date issingle-crystal UV/visible spectroscopy (UV-SCS) (Pearson etal., 2004), although fluorescence (Royant et al., 2007; Bourgeois et al., 2002; Klink et al., 2006), Raman (Carpentier et al.,2007) and Fourier-transform infrared (Moukhametzianov etal., 2006) spectroscopy are also in use. Ideally, spectra arerecorded at 100 K from the same crystal used for X-raydiffraction data collection, though this is not always possible.As a result of the increasing interest in this field, severalsingle-crystal microspectrophotometers are now availableworldwide at both synchrotron sources and home laboratories;for a recent review see De la Mora-Rey & Wilmot (2007). Thesynchrotron systems in particular are designed to operate bothon- and off-line, allowing direct monitoring of crystal spectraduring X-ray data collection.As well as the ability to identify trapped reaction intermediates, on-line microspectrophotometers have also allowedthe monitoring of the effects of X-ray exposure upon proteincrystals. It is well established that excessive X-ray exposureresults in eventual loss of diffraction signal (Henderson, 1990;Owen et al., 2006). However, both on-line single-crystaldoi:10.1107/S0909049508040120173
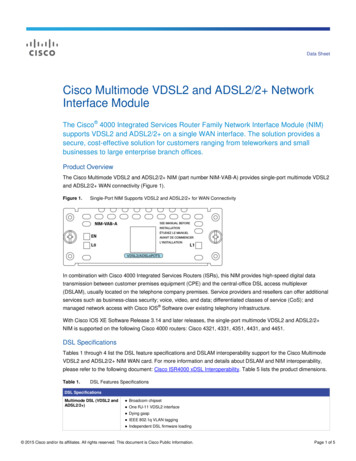
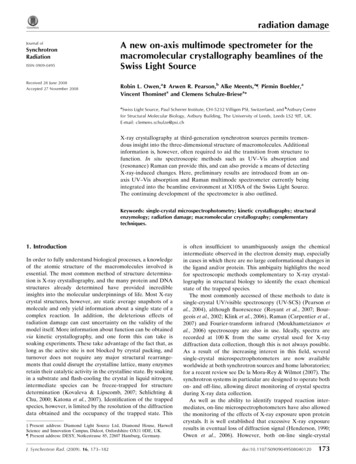
radiation damageFigure 1Manifestations of radiation damage over a wide range of time scales: UV–Vis absorption spectra of irradiated ethylene glycol [data collected at theESRF using the arrangement described by Southworth-Davies & Garman (2007)] showing a rapid increase in absorption owing to e aq upon X-rayirradiation; disulphide bond breakage in low-dose composite data sets of DsbA (R. L. Owen, unpublished data); decay of diffracting power ofholoferritin crystals as a function of X-ray dose (Owen et al., 2006).spectroscopy and X-ray absorption near-edge spectroscopyhave revealed that chemical and conformational changes canoccur in the crystal at much lower doses than are usuallyconsidered to cause radiation damage (Beitlich et al., 2007;Yano et al., 2005).These changes are illustrated in Fig. 1 and range from a nearinstantaneous generation of aqueous, or solvated, electrons(e aq ) upon X-ray exposure, through fast changes at electronsensitive centres such as redox sites or disulphide bonds at lowX-ray dose, to the eventual decay of diffraction and crystaldeath. These radiation-induced changes have been observedin a variety of biological systems (for example, see Berglund etal., 2002; Adam et al., 2004; Hough et al., 2008; Pearson et al.,2007).Unfortunately only a small subset of proteins have functional groups amenable to UV–Vis absorption spectroscopy;additional complementary methods are therefore required fortracking X-ray-induced changes or obtaining electronic andvibrational information from crystals. Raman spectroscopyhas the advantage of not requiring coloured functional groups,and can provide detailed information (Carey, 1999; Hildebrandt & Lecomte, 2000; Tuma, 2005). Raman spectroscopy isanalogous to infrared absorption spectroscopy in that itprobes the vibrational energy levels of molecules rather thanthe electronic transitions probed by UV–Vis absorption.Vibrational spectroscopy provides information with asensitivity beyond that usually achieved in a macromoleculardiffraction experiment. Information on protonation states,van der Waals and electrostatic interactions can be directlymeasured rather than inferred, greatly facilitating the transition from structure to function (for an overview, see Siebert &Hildebrandt, 2007). For a multimode spectrometer targetingbiological samples, infrared absorption has several disadvan-174Robin L. Owen et al. New on-axis multi-mode spectrometertages when compared with Raman spectroscopy. CCD detectors and lenses optimized for UV–Vis absorption are nonideal for IR and vice versa, and therefore for multimodespectroscopy UV–Vis and Raman spectroscopies are morecomplementary. Infrared absorption is also limited by the socalled ‘water problem’: water has strong absorption bands inthe infrared limiting the possible sample size and environment(Susi, 1969). While macromolecular Raman spectroscopyposes several challenges, primarily in the form of the extremely weak nature of the effect, obscuration of bands byfluorescence and difficulties in interpreting spectra, Ramanspectroscopy nonetheless provides a rich source of complementary information for crystallographers and is gaining inpopularity (Carey, 2006; Katona et al., 2007). Processesinvolving changes within a crystal, for example kinematic andligand binding experiments, are greatly simplified by use ofdifference Raman spectroscopy easing difficulties in interpretation of spectra. Protein fluorescence can also be a valuable source of information on changes in local environmentand conformation during X-ray data collection, and theprospects of using the microspectrophotometer described herefor this and other spectroscopies will be outlined in x4.Some of the challenges associated with Raman spectroscopy mentioned above can be bypassed by exploiting resonance effects. Resonance Raman occurs when the frequencyof the laser probe is tuned to that of an electronic transition inthe molecule of interest. This highlights an area in which theUV–Vis absorption and Raman modes of a multimode spectrometer are complementary to each other, as well as to X-raydiffraction. The UV–Vis absorption spectrum of a moleculereveals the wavelengths at which Raman modes will beselectively enhanced under resonant conditions by a factorof up to 106, allowing bands to be clearly discerned aboveJ. Synchrotron Rad. (2009). 16, 173–182
radiation damagefluorescence and specific regions of a molecule to be probed.This enhancement means that Raman data acquisition timescan be reduced to match those in macromolecular crystallography, if a laser wavelength matching an electronic transition of the biological molecule is available. Good Ramandata can also be collected under non-resonant conditions,although these require acquisition times of the order ofseveral minutes.The most commonly accessed biological resonant modes areexhibited for iron- or copper-containing proteins at an excitation wavelength of 413.1 nm (Kr gas laser probe), forexample myoglobin, cytochrome C oxidase, rubredoxins andazurins (Coyle et al., 2003; Konishi et al., 2004; van Amsterdamet al., 2002; Sanders-Loehr, 1988; Engler et al., 2000; Averill etal., 1987), or 514 nm (Ar gas laser probe), for example purpleacid phosphatase and rubredoxin (Xiao et al., 2005; Averill etal., 1987). Some of these modes can also be accessed usinglonger laser wavelengths, for example cytochrome C oxidaseat 580–615 nm (Bocian et al., 1979; Czernuszewicz et al., 1994)and rubredoxin at 647.1 nm (Czernuszewicz et al., 1994).Increasing the range of available laser wavelengths correspondingly increases the range of accessible metal–ligandmodes; red laser lines, for example, make possible resonantscattering from rhodopsin (600 nm) (Mathies et al., 1976),methane monooxygenase (647.1 nm) (Liu et al., 1995) andgalactose oxidase (659 nm) (Whittaker et al., 1989). Care mustbe taken, however, in resonance Raman experiments to avoidlaser-induced changes (Tonge et al., 1993; Meents et al., 2007)as photochemical processes are enhanced when the laserwavelength matches an electronic transition (Turro, 1991). Inthe case of structural biology the primary advantage of movingto longer wavelengths is the accompanying decrease in proteinfluorescence, so that non-resonance Raman bands are notobscured by this unwelcome effect (Carey, 2006).Owing to the highly concentrated and spatially orderednature of biological molecules in the crystalline state, Ramancrystallography can provide superior spectra to solution phasespectroscopy. In particular, the small spectral changes associated with ligand binding are more readily followed (Carey &Dong, 2004; Altose et al., 2001; Helfand et al., 2003; andreferences above). As Raman scattering is a tensorial quantity(Tsuboi & Thomas, 1997), care must therefore be taken withalignment of the crystal axes of samples, since changes inorientation can cause the relative intensities of different bandsto change. Raman spectroscopy has also recently been usedto measure degradation of selenomethionine derivatives(Vergara et al., 2008), providing further motivation for theimplementation of an instrument for on-line Raman spectroscopy.In summary, Raman and UV–Vis absorption spectroscopiescan provide information complementary to that obtainedusing X-ray diffraction, and are well placed to greatly facilitatethe development of a new temporal dimension in macromolecular crystallography. The inherent difference betweenRaman spectroscopy and UV–Vis absorption, in that inelasticscattering of a monochromatic source of photons is of interest(Raman) rather than absorption of a polychromatic beamJ. Synchrotron Rad. (2009). 16, 173–182(UV–Vis absorption), means that multiple optical arrangements must be accommodated in a multimode spectrometer.How these arrangements have been resolved in a mannercompatible with macromolecular X-ray diffraction and thenintegrated into the beamline environment at X10SA of theSwiss Light Source (SLS) is described below.2. Materials and methods2.1. Experimental designIn situ UV–Vis absorption spectroscopy has previouslybeen successfully implemented at the SLS protein crystallography beamlines using an off-axis geometry (Beitlich et al.,2007). This arrangement resulted in several experimentallimitations, some of which are common to most off-axisspectrometers currently in use. An off-axis arrangementgreatly crowds the sample environment as, in addition tostandard beamline components such as the collimator, alignment camera and illumination, two objective optics and an arcmount must be accommodated. While crowding can be alleviated to an extent by the use of long-working-distanceobjectives (McGeehan et al., 2009), spatial restrictions meanthat it is impractical to permanently install such a set-up at asynchrotron beamline. The objectives must therefore bereinstalled and aligned both with respect to each other and thebeamline before each spectroscopy run, frequently a timeconsuming procedure. An off-axis geometry also results indifficulties in ensuring the same sample volume is probed byX-rays and spectroscopy, and, as a consequence of the samplegeometry, is more prone to spectral artefacts caused byreflections of the probing light.The use of an on-axis geometry circumvents these drawbacks and allows the instrument to be permanently installedat the beamline. This avoids the time-consuming alignmentprocedures previously associated with spectroscopic experiments and raises the possibility of in situ spectroscopybecoming as commonplace as taking a fluorescence scan orchanging the wavelength for MAD data collection. Co-axialsimultaneous micro-Raman and synchrotron microdiffractionat ID13 of the ESRF has already been introduced as apowerful tool (Davies et al., 2005), and here we detail thedevelopment of a novel solution for on-axis spectroscopy atbeamline X10SA of the Swiss Light Source (Pohl et al., 2006).The on-axis geometry of the SLS multimode microspectrophotometer (SLS-MS) (shown in Fig. 2) is achievedwith a design analogous to that of existing on-axis microscopes, i.e. with a drilled objective mounted on the exposurebox. The majority of on-axis microscopes utilize a drilledobjective followed by a drilled mirror to deflect light awayfrom the X-ray axis towards further alignment optics and aCCD detector mounted below the beamline.For the SLS-MS, a high-magnification reflective Schwarzschild objective (Newport, 15 magnification, f 13 mm,numerical aperture 0.4) is used. This has the advantage offreeing up a large amount of space around the sample environment as the same objective can be used for both sampleRobin L. Owen et al. New on-axis multi-mode spectrometer175
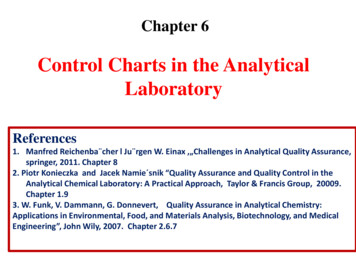
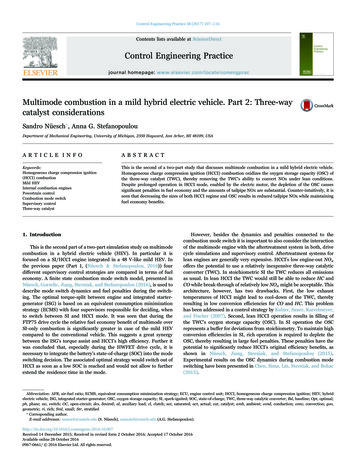
radiation damageFigure 3Figure 2Left: the SLS multimode spectrometer mounted off-line, highlighting theextent of the system and arrangement employed. Top and bottom right:the spectrometer installed at X10SA. In both cases the illumination opticis shown in the far position for sample alignment. The box containing thescintillator, beam-defining apertures and collimator can be seen belowthe sample position. The cryostream has been removed for clarity.alignment and spectroscopy. Reflective objectives combineseveral desirable characteristics for both sample alignmentand spectroscopy, including zero chromatic aberration, a highlaser power threshold and a long working distance. Lightcollected by the reflective objective is reflected in a direction90 below the X-ray axis to the branched SLS-MS (Fig. 3).The branched design of the SLS-MS is shown in Fig. 3, withthe alignment and spectroscopy branches highlighted in aquaand blue/green, respectively, in Fig. 3(b). In order to accommodate the multiple optical arrangements required by UV–Vis absorption and Raman spectroscopies, the spectroscopybranch is divided into two. For UV–Vis absorption spectroscopy, absorption of a polychromatic beam passing throughthe sample is of interest. Therefore an illuminating objective isrequired and only the collection path (blue) of the spectroscopy branch is utilized. For Raman spectroscopy, inelasticscattering of a monochromatic light source is of interest and a180 scattering geometry is used. In this case an illuminatingobjective is not required and both the illumination (green) andcollection (blue) paths of the spectroscopy branch are used(Fig. 3b).The illumination objective required for UV–Vis absorptionspectroscopy is provided by a second Schwarzschild objectivemounted on a motorized stage [shown in Figs. 2b (right) and3]. This can be driven between three positions: (i) spectroscopic data collection; (ii) sample mounting and alignment;(iii) X-ray data collection. The reproducibility of the movement of this stage will be discussed in the following section.The unequal splitting between both spectroscopic sub-branches and the alignment and spectroscopy branches is achievedvia the use of pellicle beam-splitters. These divide lightbetween the branches in the ratio 1 : 12 with the extremely thin( 2 mm) pellicle membranes eliminating refraction-basederrors and ghost images.176Robin L. Owen et al. New on-axis multi-mode spectrometerThe branched nature of the SLS multimode spectrometer. The alignmentbranch (aqua) delivers light via infinity focused zoom optics to a CCDcamera. The spectroscopy branch further divides into a branch fordelivery of laser light for Raman spectroscopy (green) and a branch forcollection of scattered light for all spectroscopies (blue).The SLS Raman probe is a Kr gas laser (Coherent Innova300C) allowing a range of wavelengths to be accessed;1currently laser clean-up and holographic notch filter sets areavailable for the 413.1, 647.1 and 752.5 nm lines of the laser. Inorder to change the lasing wavelength, the laser mirrors mustbe exchanged and re-aligned. This procedure takes 30 min,with full laser powers achievable after a further 30 min as thelaser warms up. Laser powers of the order of 10, 20 and 10 mWat the sample position are attainable at 413.1, 647.1 and752.5 nm, respectively. As outlined above, this range ofwavelengths allows a wide range of resonant modes to beaccessed, while at the two longer wavelengths protein fluorescence is greatly reduced allowing these lines to be used fornon-resonance Raman spectroscopy.Both Raman and UV–Vis absorption spectra are recordedusing an Andor 303i Czerny–Turner spectrograph and aNewton electron multiplying CCD (Andor technology). Twograting sets optimized for Raman data collection in the UV(413.1 nm Kr line) and red to near below-red (647.1 and752.5 nm Kr lines) can be mounted within the spectrograph;for each grating set three line-spacings can be used allowingeither ‘global’ spectra to be collected or a small region ofinterest to be investigated. Both the spectrograph and Kr gaslaser are located in an optical hutch adjacent to the beamlineallowing on-line experiments to make use of pre-aligned/optimized optical arrangements, and off-line experiments tooperate independently of the beamline. Light is coupledbetween the spectroscopy hutch and beamline by means of20 m optical fibres; for off-line experiments these can bereplaced by the corresponding 2 m fibres. The demagnificationratio between a 50 mm fibre and the focal spot diameter is 0.69.The SLS-MS is not yet currently permanently installed atthe beamline and so can be used for both on- and off-linemeasurements. Once the optical arrangements and design are1For a full list of Kr lines, see http://facs.scripps.edu/Lasers.html.J. Synchrotron Rad. (2009). 16, 173–182
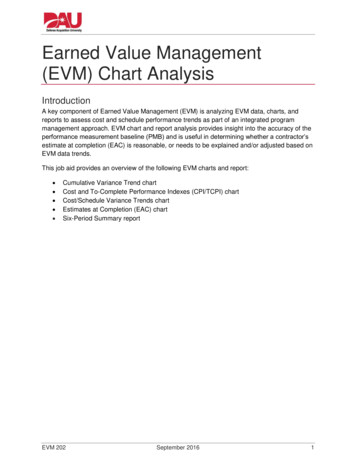
radiation damagefinalized, and the system is permanently installed, all thecomponents are available for constructing a duplicate off-linesystem.3. Results3.1. Optical and X-ray transmission properties of a drilledSchwarzschild objectiveThe drilling of a 1 mm-diameter hole in the secondarymirror does not degrade the optical properties of the objectivesince the occluded region of this mirror is 4.6 mm in diameter.This free diameter, fd, is shown in Fig. 4(a). Of potentiallygreater impact on the light throughput of the system is thehole in the 45 mirror. This is illustrated by ray-tracing thelight path from two points in the focal plane through thesystem: the focal point and a point a distance off-axis (shownin blue and green, respectively, in Fig. 4a). Light from the focalpoint does not fall on this hole, although it is possible for lightfrom the off-axis point to fall there, with the amount of light‘lost’ increasing as a function of . If a value of 0.6 mm is takenfor , corresponding to the full field of view of the objective,then the intensity of light lost is less than 2%. Holes ofdiameter 1 mm are large enough to allow X-rays to passthrough the system even when the flexor mount is adjusted.This is illustrated in Fig. 4(b); in this case a knife-edge wasscanned across the sample position with either the Schwarzschild objective or normal on-axis viewing system lensmounted.The current recorded by a diode placed behind the knifeedge allowed the X-ray beam profile to be determined in thehorizontal and vertical (data not shown) in both cases. Nochange in the beam properties was observed with theSchwarzschild objective mounted, even in the case of a defocused X-ray beam.3.2. Alignment of optical and X-ray axesThe use of the same on-axis objective for sample alignmentand spectroscopic data collection allows unambiguous alignment of the X-ray and visible optical axes. In order to achievethis, the flexor-mounted Schwarzschild objective is translatedin z (see Fig. 4a for definition of axes) so that the centre ofrotation of the sample is at the working distance of theobjective. This can be achieved easily by use of a cameramounted above the beamline, and its view of the focusing ofthe xenon light by the Schwarzschild objective is shown inFig. 5(a); the presence of the cryostream allows the visiblelight to be observed. Placement of a scintillator at the sampleposition then allows the X-ray and optical axes to be madecoincident at the sample position. This is achieved by adjustment of the ‘pitch’ and ‘yaw’ of the flexor mount of thecollection optics (Figs. 5b–5d). The UV–Vis illuminationFigure 5Figure 4The effect of drilling on the optical and X-ray transmission properties ofthe Schwarzschild objective. (a) Ray traces calculated using the raytracing software Zemax (http://www.zemax.com/) from the focal point(blue) and a point a distance off-axis (green) through the system areshown. Translation of a knife-edge across the X-ray beam allows theprofile to be determined with and without the spectroscopy objective inplace; no change is observed in either (b) the horizontal or vertical (datanot shown) directions.J. Synchrotron Rad. (2009). 16, 173–182(a) Alignment of the focal point of the xenon lamp to the focal plane ofthe alignment camera using a camera mounted directly above thebeamline and a pin at the sample position; the focus of the Schwarzschildobjective can be clearly seen. The placement of a scintillator at the sampleposition allows the sample alignment camera to be used for alignment ofthe X-ray and optical axes: (b) X-ray shutter closed, optical shutter open;(c) both X-ray and optical shutters open with objective mis-aligned; (d)both X-ray and optical shutter open with the position of the yaw of theobjective mount adjusted to maximize overlap of the X-ray and opticalbeams at the sample position.Robin L. Owen et al. New on-axis multi-mode spectrometer177
radiation damageSchwarzschild objective can be translated in x, y and z using itsmotorized stage and multi-axis fibre mount (Newport) whichallows pitch and yaw adjustment to the fibre input. The focalspot of this objective is aligned to the centre of rotation of thesample by use of a 12.5 mm pinhole placed at the sampleposition through which the intensity of transmitted light at thespectrometer is maximized.The focal plane of the alignment system can be fine-tunedand made exactly coincident with the laser/visible-light focalspot by means of a Kepler-type arrangement of two lensesin the alignment branch of the spectrometer (F. Schwarz,personal communication). This arrangement also allows thefield of view to be matched to the size of the alignment CCD.Owing to the high magnification (15 ) of the objectives, thefield of view is limited. The full field of view is 1.2 mm, withuniform illumination possible over 600 400 mm for samplealignment, and we have found this area to be sufficient in thecase where standardized pins are used throughout an experimental run. In the case where non-standard pins are used,coarse sample alignment using the camera mounted above thebeamline has been integrated into the sample alignmentgraphical user interface to complement on-axis alignment.This use of the same on-axis optic for sample alignment andspectroscopy allows simple and unambiguous alignment of theX-ray and visible-light axes ensuring the same sample volumeis always probed by both diffraction and spectroscopy. As thescintillator is mounted on a motorized stage (Fig. 2b) and canbe easily moved to the sample position, this alignment can bechecked at intervals throughout the experiment. The on-axisgeometry also means that the optics can remain in placebetween experiments, eliminating the time-consuming alignment currently associated with spectroscopy at synchrotronsources. Tests of the reproducibility of the UV–Vis illumination objective position when driven between its three positions(spectroscopy, sample alignment and mounting, X-ray datacollection) showed less than 3% change in transmittedintensity of the Xe lamp over ten iterations.Figure 6UV–Vis absorption spectra of cryocooled (100 K) cytochrome C thin film(top); vitamin B12 crystal ( 10 60 150 mm) (middle); and metmyoglobin (metMb) crystal ( 10 80 150 mm) (bottom), crystallizedas previously described (Beitlich et al., 2007), taken using the on-axisspectrometer. The discontinuities observed at 470 and 765 nm are due tointense peaks in the xenon lamp spectra at these wavelengths. Data werecollected with accumulation times of 10 100 ms, 5 20 ms and 4 0.8 ms, respectively, using a 10 mm slit width and a grating with 150 linesmm 1 in all cases.3.3. UV–Vis absorption spectroscopyTest single-crystal UV–Vis absorption spectra have beenrecorded for a variety of systems (Fig. 6). Owing to thetransmission properties of the focusing objectives couplinglight between the spectrometer and optical fibres, the availableUV–Vis absorption range is approximately 325 nm to 850 nm.The transmission of the system is approximately linearbetween these wavelengths, and is 18%. Longer wavelengths are accessible but intense peaks of the xenon lamp inthat region make simultaneous collection of short- and longwavelength data difficult, though neutral density and colouredfilters can be automatically introduced to the light path toalleviate this.The Andor Shamrock 303i spectrograph is equipped withmotorized adjustable slits (10 mm–1.2 mm) and the exposuretimes can vary from a minimum of 20 ms to considerablylonger exposure times if required. This flexible arrangement178Robin L. Owen et al. New on-axis multi-mode spectrometerallows matching of the data acquisition parameters to theoptical properties of the experimental system.The SLS-MS has been used to investigate the sensitivity oftwo systems to radiation damage during X-ray exposure. Theheme group of myoglobin is known to be sensitive to reduction by X-rays (Beitlich et al., 2007). A myoglobin singlecrystal was mounted at beamline X10SA and UV–Visabsorption spectra were recorded during X-ray exposurewithout rotation of the crystal (Fig. 7). Four accumulations of0.8 ms exposures were recorded every 0.1 s. During datacollection the crystal was not rotated in order to avoid spectralchanges owing to variation in the crystal orientation, apparentchanges in the crystal thickness, and the effect of the loopentering the light path (Wilmot et al., 2002). As single-crystalspectra are anisotropic, crystals were pre-orientated to a‘sweet spot’ where the anisotropic spectra best resembledJ. Synchrotron Rad. (2009). 16, 173–182
radiation damageDsbB is known to induce a red shift in ubiquinone uponbinding (Inaba et al., 2004) and a characteristic red-shiftedvisible peak appears upon ubiquinone binding within theDsbA–DsbB–ubiquinone (DsbAB-Q8) complex. Unlikeheme-containing proteins in which the Soret band has a largemolar extinction coefficient, this peak has a small extinctioncoefficient ( 4750 cm 1 M 1). However, despite the lowintensity of this peak, it can be clearly observed in the SLS-MSwith only 4 20 ms exposures (10 mm slits) (Fig. 8).Fig. 8 also highlights the value of the complementaryinformation that UV–Vis absorption spectroscopy canprovide. Owing to the limited diffracting power of DsbAB-Q8crystals (3.7 Å for the best crystals in the most favourableorientation), it is not possible to identify unambiguously thepresence of the charge transfer interaction in the crystallinestate via X-ray diffraction alone (Malojcic et al., 2008). In situUV–Vis absorption spectra allow spectroscopic confirmationof the presence of the interaction within the crystal, aidinginterpretation of crystallographic data. In contrast to theexample of myoglobin above, the UV–Vis absorption spe
Swiss Light Source Robin L. Owen,a‡2Arwen R. Pearson,b Alke Meents,a}4Pirmin Boehler,a Vincent Thomineta and Clemens Schulze-Briesea* aSwiss Light Source, Paul Scherrer Institute, CH-5232 Villigen PSI, Switzerland, and bAstbury Centre for Structural Molecular Biology, Astb