Transcription
The DCLG Appraisal GuideDecember 2016Department for Communities and Local Government
Crown copyright, 2016Copyright in the typographical arrangement rests with the Crown.You may re-use this information (not including logos) free of charge in any format or medium, under theterms of the Open Government Licence. To view /open-government-licence/version/3/ or write to theInformation Policy Team, The National Archives, Kew, London TW9 4DU, or email:psi@nationalarchives.gsi.gov.uk.This document/publication is also available on our website at www.gov.uk/dclgIf you have any enquiries regarding this document/publication, complete the form athttp://forms.communities.gov.uk/ or write to us at:Department for Communities and Local GovernmentFry Building2 Marsham StreetLondonSW1P 4DFTelephone: 030 3444 0000For all our latest news and updates follow us on Twitter: https://twitter.com/CommunitiesUKDecember 2016ISBN: 978-1-4098-4831-8
ContentsACKNOWLEDGEMENTS5FOREWORD6LIST OF ABBREVIATIONS7DCLG APPRAISAL GROUP8INTRODUCTION9SECTION 1: THE STRATEGIC CASE12SECTION 2: ASSESSING VALUE FOR MONEY14APPRAISAL SUMMARY TABLE (AST)BENEFIT COST RATIO (BCR)EMPLOYMENTEXTERNALITIESIMPACT ASSESSMENT METRICSMULTI-CRITERIA ANALYSISNON-MONETISED IMPACTSPUBLIC SERVICE TRANSFORMATION, SOCIAL POLICIES & FISCAL BENEFITSSPATIAL LEVEL OF ANALYSISUNITS OF ACCOUNTVALUE FOR MONEY CATEGORIESSECTION 3: LAND VALUE UPLIFT APPROACH TO APPRAISING DEVELOPMENTWHAT IS LAND VALUE UPLIFT?ACCOUNTING FOR EXTERNAL IMPACTSUSING LAND VALUE UPLIFT IN COST BENEFIT ANALYSISESTIMATING THE GROSS IMPACT OF AN INTERVENTIONESTIMATING THE NET IMPACT OF AN INTERVENTIONDISTRIBUTIONAL CONSIDERATIONSOTHER ISSUES TO CONSIDERSECTION 4: ASSUMPTIONS LISTADDITIONALITY – QUANTITATIVE GUIDANCEADMINISTRATIVE COSTS OF REGULATIONDISTRIBUTIONAL WEIGHTSEMPLOYMENTEXTERNAL IMPACTS OF DEVELOPMENTGDPHOUSE PRICE INDEXINDIRECT TAXATION CORRECTION FACTORINFLATIONLAND VALUE UPLIFTLEARNING RATESOPTIMISM 474748484849494949
PLANNING APPLICATIONSPRESENT VALUE YEARPRIVATE SECTOR COST OF CAPITALREBOUND EFFECTSREGULATORY TRANSITION COSTS5050515151SECTION 5: USEFUL SOURCES OF INFORMATION AND VALUES52SECTION 6 - ANNEXES5353ANNEX A – APPRAISAL SUMMARY TABLE EXAMPLE AND TEMPLATEANNEX B – GVA APPROACH TO APPRAISING DEVELOPMENT57ANNEX C – LAND VALUE UPLIFT FOR RESIDENTIAL DEVELOPMENT59ANNEX D – LAND VALUE UPLIFT FOR NON-RESIDENTIAL DEVELOPMENT (WHEN LOCAL LAND VALUEDATA IS AVAILABLE)65ANNEX E – ESTIMATING VALUE FOR MONEY FOR NON-RESIDENTIAL DEVELOPMENT USING LAND VALUEUPLIFT NUMBERS WHERE AVAILABLE74ANNEX F – EXTERNALITIES ASSOCIATED WITH DEVELOPMENT81ANNEX G – DISTRIBUTIONAL IMPACTS92BIBLIOGRAPHY96
AcknowledgementsWe would like to thank the following organisations and people for their support andinput in the development of this document. All Economists at the Department for Communities and Local Government Department for Business, Energy and Industrial Strategy Department for Transport HM Treasury The Homes and Communities Agency Michael Spackman, NERA5
ForewordAssessing the value for money of projects and programmes is a critical part of thepolicy making process, enabling Ministers to make informed decisions based on thepotential costs and benefits of different options. However, doing this presents anumber of challenges.Firstly, scarce public resources means there is a need for robust and rigorousappraisal of costs and benefits in order to extract maximum public value for the taxpayer.Secondly, the public sector is making increasing use of innovative policy solutions andmethods of funding rather than relying on traditional grant-based funding assistanceand regulation. Today, there is a greater use of financial instruments and alternativesto regulation which pose analytical and appraisal challenges that need to beaddressed.Finally, and most importantly, when it comes to any economic appraisal, soundjudgement is critical. There are usually many unknowns that mean impacts are notalways monetised and where judgement about how to account for such impacts isneeded. This Guide is designed to support those involved in economic appraisal tomake these judgements.Although this Guide has been designed primarily for economists in DCLG as a meansof appraising specific developments in the residential and commercial sectors, it alsohas wider applications and will be of interest to economists in other areas of the publicsector.I am therefore very pleased to recommend the use of this guidance as a means ofhelping to deliver better evidenced-based policy making and I look forward to futureimprovements to the Guide that should make it even more helpful.Stephen Aldridge,Chief Analyst, Department for Communities and Local Government6
List of abbreviationsAONBArea of Outstanding Natural BeautyBCRBenefit Cost RatioBREBetter Regulation Executive or Building Research EstablishmentCOREContinuous Recording of Lettings and Sales in England (DCLG survey)EANCBEquivalent Annual Net Costs to BusinessGVAGross Value AddedIA[Regulatory] Impact AssessmentLEPLocal Enterprise PartnershipMVMarket valueNPPVNet Present Public ValueOBOptimism biasPDLPreviously Developed LandPRPPrivate Registered ProvidersPRSPrivate Rented SectorSRSpending ReviewSRSSocial Rented SectorVfMValue for MoneyVOAValuation Office Agency7
DCLG Appraisal Group Stephen Aldridge, Chief Analyst at the Department for Communities and LocalGovernment Matthew Carson, Economic Advisor, Housing and Planning Analysis Paul Chamberlain (Chair), Deputy Director of Integration, Decentralisation andDeregulation, Appraisal David Craine, Economic Advisor, Housing and Planning Analysis Zainab Kizilbash Agha, Senior Policy Advisor (former Economic Advisor), Citiesand Local Growth Unit Scott Dennison, Deputy Director of Housing and Planning Analysis Stephen Smith (lead author and editor), Economic Advisor, Integration,Decentralisation and Deregulation, Appraisal Ben Toogood, Senior Economic Advisor, Housing and Planning Analysis Cody Xuereb, Economic Advisor, Local Policy Analysis8
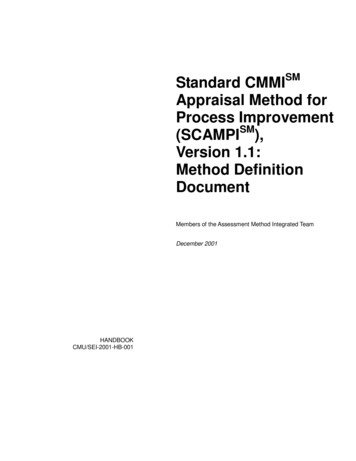
IntroductionEconomic appraisal is an essential part of the policy making process. It involves theassessment of the costs, benefits and risks of different policy options. In anyappraisal, it is essential that costs and benefits are estimated in a consistent mannerto enable appraisal information to be comparable between policy options. Thediagram below shows HM Treasury’s Green Book ROAMEF framework which sets outthe broad policy making process. The diagram illustrates the continuous nature of thepolicy making cycle with evaluation evidence on the impact of a policy feeding intoappraisals of future policies.Figure 1: ROAMEF model itoringThis Appraisal Guide sets out suggested assumptions, theoretical framework andmetrics to be adopted by economists in the Department for Communities and LocalGovernment (DCLG) when carrying out or scrutinising an appraisal. The Guide is atechnical document designed for DCLG economists, though given the range ofapplications, the Guide may be of use to economists in other departments or sectors.The focus is mainly on the economic appraisal of development, including housing,commercial development and land-based interventions. However, the Guide alsoprovides guidance on the metrics and appraisal information that needs to becalculated and presented for all policies.1HM Treasury (2003), The Green Book: Appraisal and Evaluation in Central Government, p3.9
Some of the key principles from HM Treasury’s Green Book2 are set out in thisdocument with an explanation of how they should be applied in DCLG appraisals. Aswell as being consistent with the Green Book, this document has been developed intandem with the current Green Book 'refresh' and is consistent with the Department forTransport’s (DfT) recommended approach to appraising dependent developmentwhich is set out in their online appraisal guidance, WebTAG. In addition, while theDCLG Appraisal Guide focuses purely on economic appraisal, ex post evaluations arean important part of the policy making cycle (see ROAMEF model above) andtherefore evaluation evidence should be an important component of the evidencebase underlying an appraisal.The assumptions and metrics set out in the Appraisal Guide should be the defaultwhen carrying out appraisal for policy development and advice, business cases andImpact Assessments (IAs). However, users are free to adopt different assumptions,frameworks and metrics where appropriate. If users wish to do this, it is essential aclear explanation for doing so is documented in the relevant business case or IA foraudit trail purposes.The Analysis and Data Directorate (ADD) has created this Guide to: help ensure consistency in DCLG appraisals; help improve the audit trail and justification of certain assumptions; and improve the quality of methods and assumptions employed in DCLG appraisalsover the long term by improving transparency and understanding andfacilitating challenge.Achieving greater consistency in appraisal will mean the estimated value for money ofprojects – as measured by the Net Present Public Value (NPPV), Benefit Cost Ratio(BCR) or value for money category – will be more comparable to each other. This willenable decision makers to make more informed choices about the projects they wishto support.A DCLG Appraisal Group has been formed to oversee the updating of this documentand any changes to key assumptions and metrics. This Guide will be regularlyupdated and so will be a 'living' document containing sections which are likelyto change between updates. We will keep all assumptions and metrics undercontinuous review. We would welcome receiving evidence or analysis on anyaspect of this guidance so we can improve the quality of our appraisals. Pleasesend this evidence to attachment data/file/220541/green book complete.pdf10
The Appraisal Guide is structured as follows:Section 1 provides a short overview of the Strategic Case;Section 2 sets out what appraisal information is needed and how it should bepresented for all policies;Section 3 sets out the methodology and theoretical basis for appraising and valuingdevelopment, both residential and non-residential, using land value uplift;Section 4 documents the key assumptions that should be the default in DCLGappraisals;Section 5 sets out useful source of information;Section 6 contains a series of Annexes which contain further detail on differentaspects of the Guide.11
Section 1: the Strategic case1.1The Strategic Case of a business case – or the relevant sections in an IA - setsout the case for change and the rationale for intervention. It should demonstratethat a spending proposal ‘provides business synergy and strategic fit and ispredicated upon a robust and evidence based case for change’. 3 The StrategicCase should include the rationale for intervention and ‘a clear definition ofoutcomes and the potential scope for what is to be achieved’. 4 The EconomicCase should demonstrate that the spending proposal represents value for moneyand should include an appraisal of a range of realistic and achievable options. 5Economists should ensure they concern themselves with both the Economic andStrategic Case. 61.2The ‘underlying rationale is usually founded either in market failure or wherethere are clear government distributional objectives that need to be met. Marketfailure refers to where the market has not and cannot of itself be expected todeliver an efficient outcome’. 7 If there is no market failure or equity justification,government intervention may be welfare reducing unless the intervention iscorrecting an existing ‘government failure’. Economists will therefore want toensure that the rationale for public sector intervention is clear.1.3Establishing the rationale for intervention is important for determining theappropriate counterfactual against which to assess a policy. The counterfactualshould usually be the status quo and be a clear articulation of how things willevolve in the absence of the policy being considered, including continuing trendsand development proceeding anyway to a slower timetable. For example, thereis no additional economic benefit from government providing support for adevelopment which would have happened anyway (though there may be if thedevelopment happens quicker, or is of a better quality than it otherwise wouldbe).1.4Once a credible counterfactual has been established, this should be comparedagainst the ‘do something’ scenario. The ‘do something’ represents a forecast ofthe outcomes that can be expected with the policy in place. By having aconsistent definition of the counterfactual and ‘do something’, key appraisalmetrics – Benefit Cost Ratios (BCRs) and Net Present Public Value (NPPV) forexample – for different policies can be compared.3HM Treasury (2013), ‘Public Sector Business Cases’, Green Book Supplementary Guidance on Delivering Public Value fromSpending Proposals, p11.Ibid.5Ibid, p12.6The other elements to a business case are the financial, commercial and management cases though there tends to be lessdirect involvement from economists on these cases.7HM Treasury (2003, p11)412
1.5This means only outcomes which are additional to the counterfactual should beassessed (see Additionality section for further details on assessing additionality).For example, if a policy is expected to result in the provision of 1,000 housingunits but 500 of these units are expected to be delivered in the status quo, thenthe benefits of the policy should only be for the 500 additional housing units thatwould not otherwise be delivered. If 1,000 units are expected to be delivered inthe status quo, there are no benefits unless the units are delivered faster or areof a higher quality. 81.6The status quo and ‘do something’ are likely to be different because of theexistence of a market failure. For example, a market failure could be preventinga development from happening in the status quo which once addressed could bewelfare enhancing. An example of this is in the years immediately following thefinancial crisis in 2008 when failures in the lending market restricted firms'(particularly small firms) ability to access finance to invest. By governmentintervening and correcting for this market failure, additional development wasable to take place.1.7Although there may still be credit constraints in the lending market, users willneed to ensure there is sufficient evidence justifying such a claim as theexistence of risk is not in itself a market failure e.g. a firm that is not willing toinvest in area X because of the level of risk does not mean there is a marketfailure requiring government intervention. It may simply reflect the fact that theeconomic (private) benefits are highly uncertain rather than there being a marketfailure in the lending market. Credit constraints will not be a form of marketfailure if the lending market is operating normally.1.8Another common rationale for intervention for many DCLG interventions is theexistence of externalities which impose costs (or benefits) on third parties. Forexample, the existence of a brownfield site which cannot be developed due tothe presence of contaminated land but which once developed could provide anamenity benefit to society and improved environmental outcomes. Anotherexample is the existence of an information failure, such as consumers notknowing the standard to which buildings are built. Economists will therefore wantto ensure there is sufficient evidence justifying the cited market failure and formthe appropriate counterfactual and ‘do something’ scenarios accordingly. As theadditionality section explains, a weak market failure could imply relatively highlevels of deadweight (and therefore small additionality) so it is crucial this isassessed in significant detail.8There will be benefits under such a scenario because future impacts are discounted. This means an intervention which has anet benefit to society and is brought forward will, all else being equal, have a higher social benefit than if the same interventionwas delivered later.13
Section 2: Assessing Value for Money2.1This section outlines what metrics should be calculated in a DCLG appraisal andhow this appraisal information should be presented.Appraisal Summary Table (AST)2.2An appraisal should provide clear and transparent advice to decision makers ondifferent policy options, taking account of costs, benefits, risks and significantnon-monetised impacts. The objective of appraisal should be to provide aconsistent comparison of benefits and costs. Presenting such information insummary form with detailed analysis underpinning it is crucial if complextechnical information is to be communicated effectively.2.3The table below is a recommended Appraisal Summary Table (AST) whichshould be used for all spending proposals. It should feature in business casesand in all documents where appraisal information is contained. The AST aims tocapture all the key appraisal information to enable decision makers tounderstand the value for money of different options. AST's also aim to explainthe Benefit Cost Ratio and NPPV in further detail by presenting it in the contextof other factors that cannot be reliably monetised and giving an overalljudgement on value for money in a value for money category.2.4The AST below should be incorporated in all business cases and advice on valuefor money of different policy options. Please note this AST is for two policyoptions. However, a business case should contain several spending optionswhich should be included in an AST. An example of how to complete an AST fora hypothetical scenario is given in Annex A.14
Figure 2: Recommended DCLG Appraisal Summary TableOption 1 relative tostatus quo(preferred option)ABCDEFGOption 2 relative tostatus quo (dominimum)Present Value Benefits [basedon Green Book principles andGreen Book Supplementary andDepartmental guidance ( m)]Present Value Costs ( m)Present Value of other quantifiedimpacts ( m)Net Present Public Value ( m)[A-B] or [A-B C]'Initial' Benefit-Cost Ratio [A / B]'Adjusted' Benefit Cost Ratio [(A C) / B]Significant Non-monetisedImpactsHValue for Money (VfM) CategoryISwitching Values & rationale forVfM categoryJDCLG Financial Cost ( m)KRisksLOther issues15
2.5Most of the information above is relatively straightforward to produce such as theNet Present Public Value (NPPV) and Benefit Cost Ratio (BCR). However, manyinterventions will have significant monetised and non-monetised impacts (thatare not accounted for in a BCR) such as landscape impacts (if not accounted forin a land value uplift estimate), antisocial behaviour, increased opportunities fortraining and future employment, family breakdown etc. To prevent these impactsbeing ‘overlooked’ it is important they are documented with appropriate switchinganalysis provided (see non-monetised impacts section). All monetised impactswhich are not based on Green Book Supplementary or Departmental guidanceshould feature in row C of the AST ('Present Value of other quantified impacts')and not in row A. These impacts will be part of the 'adjusted' BCR calculationand inform the overall value for money category (see below).Benefit Cost Ratio (BCR)Definition of budget constraint2.6For spending proposals, the BCR of a project is the estimated Present ValueBenefits (PVB) divided by a budget constraint or the Present Value Costs (PVC).It can be interpreted as the estimated level of benefit per 1 of cost. Thedifference between the PVB and PVC is the NPPV. This measures the overalllevel of public welfare generated by a policy. 92.7However, there are different budget constraints that can be used. For example,the PVC could measure total public and private costs or just costs to the publicsector. Costs could also be net (inclusive of any offsetting revenue streams) orgross (excluding any offsetting revenue streams). While the choice of budgetconstraint has no impact on the NPPV of a project, it does have an impact on theBCR. It is therefore essential that a consistent definition is used across thedepartment to enable projects to be compared.2.8For DCLG spending proposals, the budget constraint should be real discountednet costs to the public sector. 10 This means all exchequer costs – changes inJob Seekers Allowance and Housing Benefit for example as well as any localauthority costs and revenues – should be accounted for when estimating netpublic sector costs (the denominator of the BCR). If they are a transfer – like JobSeekers Allowance, a government grant or Housing Benefit for example – anidentical value should also feature in the net benefits figure (the numerator of the9Data Book 2.0.2In some instances it might not be appropriate to include all changes in wider public finances in the budget constraint,particularly if by including them the BCR of policy options becomes difficult to interpret. In such a scenario, a different BCR metricmay be required to aid interpretation of value for money (though the NPPV would not be affected by choice of budget constraint).1016
2.9BCR) unless it is already reflected in a different variable such as land value uplift.Transfers like this have no impact on the NPPV but do impact on the BCR.This metric has been selected because: (1) it is a metric that can be used byDCLG, local government and Local Enterprise Partnerships (LEPs) as thebudget constraint encompasses all public expenditure and revenues and (2) ifprojects are prioritised on the basis of the BCR - which impacts on the value formoney category - it helps ensure welfare is maximised from a budget closelyresembling DCLG’s.'Initial' and 'Adjusted' BCR for internal business cases and value for moneyadvice2.10 When estimating the BCR, it is important that there is transparency in what isincluded in the benefits and costs. This means being clear about the robustnessof the underlying evidence base and the appraisal values being used. It alsomeans being clear when more subjective values are included in the appraisal.2.11 To account for this, it is recommended two BCRs are calculated: an 'initial' BCRand an 'adjusted' BCR (this is in line with DfT appraisal guidance). The 'initial'BCR takes into account all appraisal values where there is a strong underlyingevidence base and which are based on Green Book and Green BookSupplementary and Departmental guidance. A link to a list of this supplementaryguidance is given in the footnote below and includes the valuation of thefollowing externalities: air quality, crime, environment, health and greenhousegas emissions. 11 The 'adjusted' BCR may include additional estimates ofimpacts, based on users’ own evidence i.e. evidence not currently incorporatedin Green Book Supplementary and Departmental guidance. These estimatesmay be based on more tentative assumptions where the evidence base is not sowell established (see Annex F). However, both BCRs should inform the overallvalue for money category of the policy along with appropriate sensitivity analysis.2.12 For example, suppose there is a market failure in the lending market that ispreventing a particular development from taking place. The development isexpected to result in an external transport cost of 5m. 12 However, there wouldalso be an external benefit from 'cleaning up' the land in the form of an amenitybenefit to the surrounding area. There is also expected to be some affordablehousing provided as part of the development. These two external impacts termed 'other quantified impacts' in the AST - are estimated to be in the region of 5m. No other external impacts are expected to result from this ions/the-green-book-supplementary-guidanceAssume this estimate is based on DfT's WebTAG guidance meaning it should feature in the 'initial' BCR.17
2.13 Assume several policy options are being considered, one of which is agovernment grant of 10m. With such a grant the development would 'go ahead'and there would be 20m in land value uplift. 13 For simplicity assume there is nodeadweight or displacement (in practice we would not assume this but thepurpose of this example is to demonstrate the calculation of the 'initial' and'adjusted' BCR). In this example, the present value benefits would be 15m i.e.the 20m land value uplift less the 5m external cost (this cost features in thePVB as it is not a public expenditure cost). The present value costs would be the 10m grant.2.14 Therefore, in this example, the NPPV would be 5m (the 15m present valuebenefits minus the 10m present value costs) and the 'initial' BCR would be 1.5(the 15m benefits divided by the 10m costs).2.15 The 'adjusted' BCR would include other quantified impacts. In this instance theyinclude the benefit from cleaning up the land and the affordable housing, andthese are estimated to be 5m. If these appraisal values are included in theanalysis, the present value benefits would be equal to 20m (the 15m ofbenefits in the 'initial' BCR plus the 5m of other quantified impacts) and theeconomic costs would be 10m. In this case, the NPPV would be 10m (the 20m of benefits minus the 10m of costs) and the 'adjusted' BCR would be 2(the 20m of economic benefits divided the 10m of economic costs).2.16 Figure 3 sets out the types of impacts that would feature in the numerator anddenominator of the BCR for DCLG policies (note those impacts in squaredbrackets would be negative values). Impacts that should only feature in the'adjusted' BCR are highlighted. Impacts can be split according to whether theyimpact on consumers or business (private impacts) or whether they are externalor impact on public sector finances (public impacts). Under this metric, no coststo consumers or business feature in the budget constraint (the denominator ofthe BCR).2.17 In some instances a BCR may not be appropriate. For example, when there is anegative or zero cost. For policies such as this – which could include devolutionof funding which transfer resources from one place to another – it may be betterto focus the value for money analysis on the NPPV and potential Value forMoney category.13In this example the benefit to the recipient of the 10m grant is reflected in the land value uplift.18
2.18 Once an 'initial' BCR is calculated, it is important users assess its plausibility.For example, if the estimated 'initial' BCR is high and consists mainly of privateimpacts, then it is important to consider why such a project would not havehappened in the absence of the intervention. This will mean ensuring there is asound market failure underpinning the rationale for intervention as set out in theStrategic Case. Where there is no market failure, this may mean there issignificant deadweight (see Additionality section) and therefore users should revisit the underlying additionality assumptions.2.19 As Section 1 explains, all impacts should usually be relative to the status quo.Some examples of how the NPPV and BCR should be calculated for typicalDCLG policies are given below.Figure 3: Description of benefits and costs under proposed BCR metricPresentValueBenefits(numerator)PresentValue Costs(denominator)Consumer and businessimpactsPrivate benefits e.g. land valueuplift[Private sector costs if notcaptured in land value] 14Public sector grant or loan if notcaptured in land value 15[Public sector loan repaymentsif not captured in land value]Distributional benefits*External impacts and publicsector finance impactsExternal benefits *[External costs]*Public sector grant or loan[Public sector loan repayments]Other public sector costs[Other public sector revenues]* only impacts that are based on Green Book and Green Book Supplementary and Departmentalguidance should feature in the 'initial' BCR calculation (see Annex F). Other impacts should featureonly in the 'adjusted' BCR. Distributional benefits should feature in the 'adjusted' BCR and not the'initial' BCR.14The land valuation of a particular development will already account for the private costs (and possibly the benefits of potentialgovernment support) associated with a development as it is equal to the Gross Development Value of a site less anydevelopment costs less a minimum level of profit that is needed. Therefore, care should be taken to avoid double counting ofcosts (and benefits associated with government support). If the land value data accounts for all costs and the impact of anygovernment support, then there is no need to separately account for further costs or the potential benefits to a firm fromgovernment support in the present value benefits. However, if the appraisal is using illustrative Valuation Office Agency landvalue uplift data, then this data will only account for 'typical' development costs. It will not account for any 'atypical' costs - suchas those where there are large 'clean-up' costs associated with brownfield land for example - or the benefits of governmentsupport. These impacts will need to be accounted for separately in the appraisal. These 'atypical' private costs should feature asa negative number in the present value benefits as they represent a dis-benefit to the private sector. Any government grant orsubsidised loan (less repayments) to the private sector should feature as a positive number in the present value benefits and as apositive number in the present value costs.15As noted above, land value data may already account for the impact of a government grant or loan. If it does not, this shouldbe included separately in the appraisal.19
2.20 It should be noted that all the impacts in this calculation should be risk adjusted.In the early stages of policy development this will primarily be throug
The Guide is a technical document designed for DCLG economists, though given the range of applications, the Guide may be of use to economists in other departments or sectors. The focus is mainly on the economic appraisal of development, including housing, commercial development and land- base