Transcription
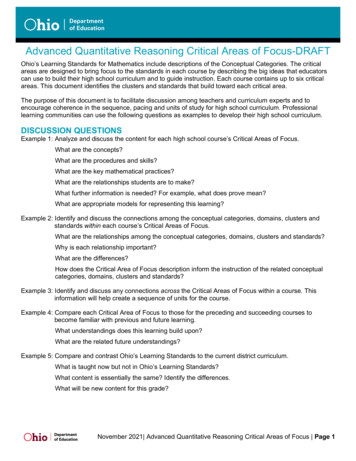
Advanced Quantitative Reasoning Critical Areas of Focus-DRAFTOhio’s Learning Standards for Mathematics include descriptions of the Conceptual Categories. The criticalareas are designed to bring focus to the standards in each course by describing the big ideas that educatorscan use to build their high school curriculum and to guide instruction. Each course contains up to six criticalareas. This document identifies the clusters and standards that build toward each critical area.The purpose of this document is to facilitate discussion among teachers and curriculum experts and toencourage coherence in the sequence, pacing and units of study for high school curriculum. Professionallearning communities can use the following questions as examples to develop their high school curriculum.DISCUSSION QUESTIONSExample 1: Analyze and discuss the content for each high school course’s Critical Areas of Focus.What are the concepts?What are the procedures and skills?What are the key mathematical practices?What are the relationships students are to make?What further information is needed? For example, what does prove mean?What are appropriate models for representing this learning?Example 2: Identify and discuss the connections among the conceptual categories, domains, clusters andstandards within each course’s Critical Areas of Focus.What are the relationships among the conceptual categories, domains, clusters and standards?Why is each relationship important?What are the differences?How does the Critical Area of Focus description inform the instruction of the related conceptualcategories, domains, clusters and standards?Example 3: Identify and discuss any connections across the Critical Areas of Focus within a course. Thisinformation will help create a sequence of units for the course.Example 4: Compare each Critical Area of Focus to those for the preceding and succeeding courses tobecome familiar with previous and future learning.What understandings does this learning build upon?What are the related future understandings?Example 5: Compare and contrast Ohio’s Learning Standards to the current district curriculum.What is taught now but not in Ohio’s Learning Standards?What content is essentially the same? Identify the differences.What will be new content for this grade?November 2021 Advanced Quantitative Reasoning Critical Areas of Focus Page 1
Advanced Quantitative ReasoningTable of ContentsCritical Area of Focus #1: Communication and Analysis . 3Critical Area of Focus #2: Modeling with Number and Quantity . 4Critical Area of Focus #3: Modeling with Algebra and Functions. 6Critical Area of Focus #4: Modeling with Statistics and Probability . 10Critical Area of Focus #5: Modeling with Geometry . 14November 2021 Advanced Quantitative Reasoning Critical Areas of Focus Page 2
Advanced Quantitative Reasoning Critical Areas of FocusCRITICAL AREA OF FOCUS #1Communication and AnalysisWithin this critical area students develop conclusions based on quantitative information and critical thinking.They recognize, make, and evaluate underlying assumptions in estimation, modeling, and data analysis.Students then organize and present thoughts and processes using mathematical and statistical evidence.They communicate clear and complete information in such a way that the reader or listener can understand thecontextual and quantitative information in a situation. Students demonstrate numerical reasoning orally and inwriting coherent statements and paragraphs.In the context of real-world applications, students make and investigate mathematical conjectures. They areable to defend their conjectures and respectfully question conjectures made by their classmates. This leads tothe development of mathematical arguments and informal proofs, which are ways of expressing particularkinds of reasoning and justification. Explanations (oral and written) include mathematical arguments andrationales, not just procedural descriptions or summaries. Listening to others’ explanations gives studentsopportunities to develop their own understandings. Through communication, ideas become objects ofreflection, refinement, discussion, and amendment. When students are challenged to communicate the resultsof their thinking to others orally or in writing, they learn to be clear, convincing, and precise in their use ofmathematical language. Additionally, conversations in which mathematical ideas are explored from multipleperspectives help the participants sharpen their thinking and make connections. This critical area of focuscross cuts all the other critical areas of focus.Standards for Mathematical Practices2. Reason abstractly and quantitatively.3. Construct viable arguments and critique the reasoning of others.6. Attend to precision.This critical area cross cuts all the rest of the standards, so all standards in this document also fallunder this crucial area!!!Algebra – Reasoning with Equations and InequalitiesUnderstand solving equations as a process of reasoning and explain the reasoning.A.REI.1 Explain each step in solving a simple equation as following from the equality of numbers asserted atthe previous step, starting from the assumption that the original equation has a solution. Construct aviable argument to justify a solution method.November 2021 Advanced Quantitative Reasoning Critical Areas of Focus Page 3
Advanced Quantitative Reasoning Critical Areas of FocusCRITICAL AREA OF FOCUS #2Modeling with Number and QuantityNumeracy is the ability to read, understand and work with quantitative information in order to purposefully useand analyze mathematics in a wide range of situations including in one’s personal life, as a citizen and in one’scareer. Numeracy involves much more than arithmetic skills and straightforward procedural competencies. Itinvolves the ability to be strategic in how and when to use mathematics, understand and interpret mathematicalrepresentations, construct and destruct numbers, estimate quantities appropriately, and make sound decisions.Students develop and use the concepts of numeracy to investigate and explain quantitative relationships andsolve problems in a variety of real-world contexts. Mathematical concepts involving proportional reasoningsuch as ratios, rates of change, unit conversions and dimensional analysis are explored. In this coursenumeracy is applied to a variety of topics including aspects of financial literacy such as budgets and loans.(The teaching of numeracy is intended to both deepen and broaden understanding achieved in previousgrades keeping the development and use of all but the most basic algebraic procedures to a minimum.Problems requiring rote use of arithmetic or algebraic procedures should be deemphasized, except when theseprocedures are essential to gaining deep conceptual understanding.) Modeling in this course should begrounded in concepts outlined in the GAIMME frameworkG.Standards for Mathematical Practices1. Make sense of problems and persevere in solving them.2. Reason abstractly and quantitatively.4. Model with mathematics.5. Use appropriate tools strategically.6. Attend to precision.Number and Quantity – QuantitiesReason quantitatively and use units to solve problems.N.Q.1Use units as a way to understand problems and to guide the solution of multi-step problems; chooseand interpret units consistently in formulas; choose and interpret the scale and the origin in graphsand data displays. N.Q.2Define appropriate quantities for the purpose of descriptive modeling. N.Q.3Choose a level of accuracy appropriate to limitations on measurement when reporting quantities. Note: Standards N.Q.4-7 are included in this course to be considered for next standards revision.Reason quantitatively about numerical data including covariation to solve real-world problems.N.Q.4Reason, model, and communicate about numerical data building upon previous knowledge offractions, decimals, percents, scientific notation and estimation and using that knowledge flexibly ina variety of circumstances and a range ofnumber values. N.Q.5Reason, model, and communicate about proportions including the following: a. Distinguishing between proportional and non-proportional situations.b. Using dimensional analysis.c. Analyzing and comparing growth and decay using absolute and relative change.November 2021 Advanced Quantitative Reasoning Critical Areas of Focus Page 4
Advanced Quantitative Reasoning Critical Areas of FocusCRITICAL AREA OF FOCUS #2, CONTINUEDModeling with Number and QuantityNumber and Quantity – QuantitiesNote: Standards N.Q.4-7 are included in this course to be considered for next standards revision.Reason quantitatively about numerical data including covariation to solve real-world problems.N.Q.6Use models to solve and communicate about contextual financial questions such as budgets, creditcard debt, installment savings, amortization schedules, mortgage and other loan scenarios. N.Q.7Identify and explain personal and societal consequences of financial decisions andother scenarios. Algebra – Seeing Structure in ExpressionsWrite expressions in equivalent forms to solve problems.A.SSE.3 Choose and produce an equivalent form of an expression to reveal and explain properties of thequantity represented by the expression. Geometry – Modeling with GeometryApply geometric concepts in modeling situations.G.MG.3 Apply geometric methods to solve design problems, e.g., designing an object or structure to satisfyphysical constraints or minimize cost; working with typographic grid systems based on ratios. November 2021 Advanced Quantitative Reasoning Critical Areas of Focus Page 5
Advanced Quantitative Reasoning Critical Areas of FocusCRITICAL AREA OF FOCUS #3Modeling with Algebra and FunctionsThe description of modeling as “the process of choosing and using mathematics and statistics to analyzeempirical situations, to understand them better, and to make decisions” is at the heart of the course. Thenarrative discussion and diagram (page 19) of the modeling cycle should be considered when knowledge offunctions, statistics, and geometry is applied in a modeling context. Students make decisions by analyzingmathematical models, including situations in which the student must recognize and/or make assumptions.Students synthesize and generalize what they have learned about a variety of function families. They identifyappropriate types of functions to model a situation, they adjust parameters to improve the model, and theycompare models by analyzing appropriateness of fit and making judgments about the domain over which amodel is a good fit. Students model functions in a variety of real-world topics including aspects of financialliteracy. Modeling in this course should be grounded in concepts outlined in the GAIMME frameworkG.Standards for Mathematical Practices1. Make sense of problems and persevere in solving them.4. Model with mathematics.5. Use appropriate tools strategically.8. Look for and express regularity in repeated reasoning.Algebra – Seeing Structure in ExpressionsInterpret the structure of expressions.A.SSE.1. Interpret expressions that represent a quantity in terms of its context. a. Interpret parts of an expression, such as terms, factors, and coefficients.b. Interpret complicated expressions by viewing one or more of their parts as asingle entity.Write expressions in equivalent forms to solve problems.( ) A.SSE.4 Derive the formula for the sum of a finite geometric series (when the common ratio is not 1) anduse the formula to solve problems. For example, calculate mortgage payments. Algebra – Creating EquationsCreate equations that describe numbers or relationships.A.CED.1 Create equations and inequalities in one variable and use them to solve problems. Include equationsand inequalities arising from linear, quadratic, simple rational, and exponential functions. c. Extend to include more complicated function situations with the option to solve with technology.(A2, M3)A.CED.2 Create equations in two or more variables to represent relationships between quantities; graphequations on coordinate axes with labels and scales. c. Extend to include more complicated function situations with the option to graph with technology.(A2, M3)November 2021 Advanced Quantitative Reasoning Critical Areas of Focus Page 6
Advanced Quantitative Reasoning Critical Areas of FocusCRITICAL AREA OF FOCUS #3, CONTINUEDModeling with Algebra and FunctionsAlgebra – Creating EquationsCreate equations that describe numbers or relationships.A.CED.3 Represent constraints by equations or inequalities, and by systems of equations and/or inequalities,and interpret solutions as viable or non-viable options in a modeling context. For example, representinequalities describing nutritional and cost constraints on combinations of different foods. (A1, M1)a. While functions will often be linear, exponential, or quadratic, the types of problems should drawfrom more complicated situations. (A2, M3)A.CED.4 Rearrange formulas to highlight a quantity of interest, using the same reasoning as in solvingequations. d. While functions will often be linear, exponential, or quadratic, the types of problems should drawfrom more complicated situations. (A2, M3)Algebra – Reasoning with Equations and InequalitiesSolve equations and inequalities in one variable.A.REI.3 Solve linear equations and inequalities in one variable, including equations with coefficientsrepresented by letters.Solve systems of equations.A.REI.6 Solve systems of linear equations algebraically and graphically.Represent and solve equations and inequalities graphically.A.REI.10 Understand that the graph of an equation in two variables is the set of all its solutions plotted in thecoordinate plane, often forming a curve (which could be a line).A.REI.11 Explain why the x-coordinates of the points where the graphs of the equation y f(x) and y g(x)intersect are the solutions of the equation f(x) g(x); find the solutions approximately, e.g., usingtechnology to graph the functions, making tables of values, or finding successive approximations.A.REI.12 Graph the solutions to a linear inequality in two variables as a half-plane (excluding the boundary inthe case of a strict inequality), and graph the solution set to asystem of linear inequalities in two variables as the intersection of the corresponding half-planes.Functions – Interpreting FunctionsUnderstand the concept of a function, and use function notation.F.IF.2Use function notation, evaluate functions for inputs in their domains, and interpret statements thatuse function notation in terms of a context.November 2021 Advanced Quantitative Reasoning Critical Areas of Focus Page 7
Advanced Quantitative Reasoning Critical Areas of FocusCRITICAL AREA OF FOCUS #3, CONTINUEDModeling with Algebra and FunctionsFunctions – Interpreting FunctionsInterpret functions that arise in applications in terms of the context.F.IF.4For a function that models a relationship between two quantities, interpret key features of graphsand tables in terms of the quantities, and sketch graphs showing key features given a verbaldescription of the relationship. Key features include the following: intercepts; intervals where thefunction is increasing, decreasing, positive, or negative; relative maximums and minimums;symmetries; end behavior; and periodicity. (A2, M3)F.IF.5Relate the domain of a function to its graph and, where applicable, to the quantitative relationship itdescribes. For example, if the function h(n) gives the number of person-hours it takes to assemble nengines in a factory, then the positive integers would be an appropriate domain for the function. c. Emphasize the selection of a type of function for a model based on behavior of dataand context. (A2, M3)F.IF.6Calculate and interpret the average rate of change of a function (presented symbolically or as atable) over a specified interval. Estimate the rate of change from a graph. (A2, M3)Analyze functions using different representations.F.IF.7Graph functions expressed symbolically and indicate key features of the graph, by hand in simplecases and using technology for more complicated cases. Include applications and how key featuresrelate to characteristics of a situation, making selection of a particular type of functionmodel appropriate. F.IF.9Compare properties of two functions each represented in a different way (algebraically, graphically,numerically in tables, or by verbal descriptions). For example, given a graph of one quadraticfunction and an algebraic expression for another, say which has the larger maximum. (A2, M3)Functions – Building FunctionsBuild a function that models a relationship between two quantities.F.BF.1Write a function that describes a relationship between two quantities. a. Determine an explicit expression, a recursive process, or steps for calculationfrom context.b. Combine standard function types using arithmetic operations. For example, build a function thatmodels the temperature of a cooling body by adding a constant function to a decaying exponential,and relate these functions to the model. (A2, M3)( ) c. Compose functions. For example, if T(y) is the temperature in the atmosphere as a function ofheight, and h(t) is the height of a weather balloon as a function of time, then T(h(t)) is thetemperature at the location of the weather balloon as a function of time.F.BF.2Write arithmetic and geometric sequences both recursively and with an explicit formula, use them tomodel situations, and translate between the two forms. November 2021 Advanced Quantitative Reasoning Critical Areas of Focus Page 8
Advanced Quantitative Reasoning Critical Areas of FocusCRITICAL AREA OF FOCUS #3, CONTINUEDModeling with Algebra and FunctionsFunctions – Linear, Quadratic, and Exponential ModelsConstruct and compare linear, quadratic, and exponential models, and solve problems.F.LE.1Distinguish between situations that can be modeled with linear functions and withexponential functions. b. Recognize situations in which one quantity changes at a constant rate per unit interval relativeto another.c. Recognize situations in which a quantity grows or decays by a constant percent rate per unitinterval relative to another.F.LE.2Construct linear and exponential functions, including arithmetic and geometric sequences, given agraph, a description of a relationship, or two input-output pairs (include reading these froma table). Functions – Linear, Quadratic, and Exponential ModelsConstruct and compare linear, quadratic, and exponential models, and solve problems.( ) F.LE.3 Observe using graphs and tables that a quantity increasing exponentially eventually exceeds aquantity increasing linearly or quadratically. (A1, M2)Interpret expressions for functions in terms of the situation they model.F.LE.5Interpret the parameters in a linear or exponential function in terms of a context. November 2021 Advanced Quantitative Reasoning Critical Areas of Focus Page 9
Advanced Quantitative Reasoning Critical Areas of FocusCRITICAL AREA OF FOCUS #4Modeling with Statistics and ProbabilityStudents build upon their previous statistical experiences and extend their experience to new situations anddeepen their understanding of the statistical process. They use graphical representations and knowledge of thecontext to make judgments about the appropriateness of statistical models. They develop formal means ofassessing how a model fits dataG such as the use of regression techniques to describe approximately linearrelationships between quantities. Students see how the visual displays and summary statistics relate todifferent types of data and to probability distributions. They identify different ways of collecting data—includingsample surveys, experiments, and simulations—and the role that randomness and careful design play in theconclusions that can be drawn. To model the relationships between variables, students fit a linear function todata and analyze residuals to assess the appropriateness of fit. Building on prior experiences associated withthe notion of a correlation coefficient, students learn how to distinguish a statistical relationship from a causeand-effect relationship.Statistics and Probability in Ohio’s Learning Standards is grounded in GAISE model frameworkG. Within thecontext of real-world applications, students investigate, represent, make decisions, and draw conclusionsabout data. Students formulate statistical investigative questions anticipating variability. They acknowledgevariability when they collect and consider data. Students will use distributions in accounting for variability whenthey analyze data. Students interpret the results by looking beyond the data.Standards for Mathematical Practices1. Make sense of problems and persevere in solving them.5. Use appropriate tools strategically.7. Look for and make use of structure.Statistics and Probability – Interpreting Categorical and Quantitative DataSummarize, represent, and interpret data on a single count or measurement variable.S.ID.1Represent data with plots on the real number line (dot plotsG, histograms, and box plots) in thecontext of real-world applications using the GAISE model. S.ID.2In the context of real-world applications by using the GAISE model, use statistics appropriate to theshape of the data distribution to compare center (median and mean) and spread (meanabsolute deviationG, interquartile rangeG, and standard deviation) of two or more differentdata sets. S.ID.3In the context of real-world applications by using the GAISE model, interpret differences in shape,center, and spread in the context of the data sets, accounting for possible effects of extreme datapoints (outliers). S.ID.4Use the mean and standard deviation of a data set to fit it to a normal distribution and to estimatepopulation percentages. Recognize that there are data sets for which such a procedure is notappropriate. Use calculators, spreadsheets, and tables to estimate areas under the normal curve. November 2021 Advanced Quantitative Reasoning Critical Areas of Focus Page 10
Advanced Quantitative Reasoning Critical Areas of FocusCRITICAL AREA OF FOCUS #4, CONTINUEDModeling with Statistics and ProbabilityStatistics and Probability – Interpreting Categorical and Quantitative DataSummarize, represent, and interpret data on two categorical and quantitative variables.S.ID.6Represent data on two quantitative variables on a scatter plot, and describe how the variablesare related. a. Fit a function to the data; use functions fitted to data to solve problems in the context of the data.Use given functions, or choose a function suggested by the context. Emphasize linear, quadratic,and exponential models. (A2, M3)b. Informally assess the fit of a function by discussing residuals. (A2, M3)c. Fit a linear function for a scatterplot that suggests a linear association. (A1, M1)Interpret linear models.S.ID.7Interpret the slope (rate of change) and the intercept (constant term) of a linear model in the contextof the data. S.ID.8Compute (using technology) and interpret the correlation coefficient of a linear fit. S.ID.9Distinguish between correlation and causation. Statistics and Probability – Making Inferences and Justifying ConclusionsUnderstand and evaluate random processes underlying statistical experiments.S.IC.1Understand statistics as a process for making inferences about population parameters based on arandom sample from that population. S.IC.2Decide if a specified model is consistent with results from a given data-generating process, e.g.,using simulation. For example, a model says a spinning coin falls heads up with probability 0.5.Would a result of 5 tails in a row cause you to question the model? Make inferences and justify conclusions from sample surveys, experiments, and observational studies.S.IC.3Recognize the purposes of and differences among sample surveys, experiments, and observationalstudies; explain how randomization relates to each. S.IC.4Use data from a sample survey to estimate a population mean or proportion; develop a margin oferror through the use of simulation models for random sampling. S.IC.5Use data from a randomized experiment to compare two treatments; use simulations to decide ifdifferences between sample statistics are statistically significant. S.IC.6Evaluate reports based on data. November 2021 Advanced Quantitative Reasoning Critical Areas of Focus Page 11
Advanced Quantitative Reasoning Critical Areas of FocusCRITICAL AREA OF FOCUS #4, CONTINUEDModeling with Statistics and ProbabilityStatistics and Probability –Conditional Probability and the Rules of ProbabilityUnderstand independence and conditional probability, and use them to interpret data.S.CP.3 Understand the conditional probability of A given B as P(A and B)/P(B), and interpret independence of Aand B as saying that the conditional probability of A given B is the same as the probability of A, andthe conditional probability of B given A is the same as the probability of B. S.CP.4 Construct and interpret two-way frequency tables of data when two categories are associated witheach object being classified. Use the two-way table as a sample space to decide if events areindependent and to approximate conditional probabilities. For example, collect data from a randomsample of students in your school on their favorite subject among math, science, and English.Estimate the probability that a randomly selected student from your school will favor science giventhat the student is in tenth grade. Do the same for other subjects and compare the results. S.CP.5 Recognize and explain the concepts of conditional probability and independence in everydaylanguage and everyday situations. For example, compare the chance of having lung cancer if youare a smoker with the chance of being a smoker if you have lung cancer. Use the rules of probability to compute probabilities of compound events in a uniformprobability model.S.CP.6 Find the conditional probability of A given B as the fraction of B’s outcomes that also belong to A,and interpret the answer in terms of the model. S.CP.7 Apply the Addition Rule, P(A or B) P(A) P(B) P(A and B), and interpret the answer in terms ofthe model. Statistics and Probability – Using Probability to Make DecisionsCalculate expected values, and use them to solve problems.S.MD.1 Define a random variableG for a quantity of interest by assigning a numerical value to each event ina sample space; graph the corresponding probability distributionG using the same graphical displaysas for data distributions. S.MD.2 Calculate the expected valueG of a random variable; interpret it as the mean of theprobability distribution. S.MD.3 Develop a probability distribution for a random variable defined for a sample space in whichtheoretical probabilities can be calculated; find the expected value. For example, find the theoreticalprobability distribution for the number of correct answers obtained by guessing on all five questionsof a multiple-choice test where each question has four choices, and find the expected grade undervarious grading schemes. S.MD.4 Develop a probability distribution for a random variable defined for a sample space in whichprobabilities are assigned empirically; find the expected value. For example, find a current datadistribution on the number of TV sets per household in the United States, and calculate the expectednumber of sets per household. How many TV sets would you expect to find in 100 randomlyselected households? November 2021 Advanced Quantitative Reasoning Critical Areas of Focus Page 12
Advanced Quantitative Reasoning Critical Areas of FocusCRITICAL AREA OF FOCUS #4, CONTINUEDModeling with Statistics and ProbabilityStatistics and Probability – Using Probability to Make DecisionsUse probability to evaluate outcomes of decisions.S.MD.5 Weigh the possible outcomes of a decision by assigning probabilities to payoff values and findingexpected values. a. Find the expected payoff for a game of chance. For example, find the expected winnings from astate lottery ticket or a game at a fast-food restaurant.b. Evaluate and compare strategies on the basis of expected values. For example, compare a highdeductible versus a low-deductible automobile insurance policy using various, but reasonable,chances of having a minor or a major accident.S.MD.6 Use probabilities to make fair decisions, e.g., drawing by lots, using a random number generator. S.MD.7 Analyze decisions and strategies using probability concepts, e.g., product testing, medical testing,pulling a hockey goalie at the end of a game. November 2021 Advanced Quantitative Reasoning Critical Areas of Focus Page 13
Advanced Quantitative Reasoning Critical Areas of FocusCRITICAL AREA OF FOCUS #5Modeling with GeometryStudents take their prior experience in geometry and apply that learning to real-world problems which couldinclude concepts of congruence, similarity, symmetry, Pythagorean Theorem, circles and trigonometry. Theyutilize geometric and visual models to represent and understand given scenarios. Geometric methods can beapplied to solve real-world design and modeling problems. Of all the subjects students learn in geometry,trigonometry may have the greatest application in college and career. Students in high school should seeauthentic applications of trigonometry to many different contexts. Graphing utilities, spreadsheets, computeralgebra systems, and dynamic geometry software are powerful tools that can
Advanced Quantitative Reasoning Critical Areas of Focus-DRAFT . Within this critical area students develop conclusions based on quantitative information and critical thinking. They recognize, make, and evaluate underlying assumptions in estimation, modeling, and data analysis. . Mathematical concepts in
