Transcription
Cinematic ColorFrom Your Monitor to the Big ScreenSIGGRAPH 2012 Course NotesCourse OrganizerJeremy SelanSony Pictures ImageworksUpdated: Aug 2, 2012Latest Version Available Online
Course DescriptionThis class presents an introduction to the color pipelines behind modern feature-film visual-effects andanimation.Color impacts many areas of the computer graphics pipeline. From texture painting to lighting,rendering to compositing, and from image display to the theater, handling color is a tricky problem.Tired of getting your images right on the monitor, only to have them fall apart later on? The goal of thiscourse is to familiarize attendees with the best practices used in modern visual effects and animationcolor pipelines, and how to adapt these concepts for home use.The course begins with an introduction to color processing, and its relationship to image fidelity, colorreproducibility, and physical realism. We will discuss common misconceptions about linearity, gamma,and working with high-dynamic range (HDR) color spaces. Pipeline examples from recent films by SonyPictures Imageworks will be included, with a discussion of what color transforms were utilized, and whythese approaches were taken. Finally, we will present a brief introduction to the Academy’s recent effortson color standardization in computer graphics (ACES), and how the audience can experiment with all ofthese concepts for free using open-source software (OpenColorIO).Level of difficulty: IntermediateIntended AudienceThis course is intended for computer graphic artists and software developers interested in visual-effectsand animation.PrerequisitesFamiliarity with computer graphics fundamentals is preferred.On the webhttp://www.CinematicColor.com 2012 Sony Pictures Imageworks Inc.All Rights Reserved.
About the presenterJeremy Selan is an Imaging Supervisor at Sony Pictures Imageworks specializing in color, lighting, andcompositing. His work has been used on dozens of motion pictures including The Amazing Spider-Man,Alice in Wonderland, and The Smurfs. Jeremy is the founder of OpenColorIO, and also a co-founder ofKatana. His work on color processing has been previously featured in GPU Gems 2, Siggraph 2005'sElectronic Theater, and prior Siggraph courses.
Presentation schedule9:00 – 9:30 Color Science9:30 – 10:00 Motion-Picture Color Management10:00 – 10:30 Implementation, Examples, Q&A
Table of ContentsIntroduction6Color Science9Color Encoding, Color Space, and Image States14Display-Referred Imagery15Scene-Referred Imagery18Color Correction, Color Space, and “Log”25Motion-Picture Color Management26Digital Intermediate, Mastering, and Delivery28Lighting, Rendering, Shading32Compositing35Texture and Matte Painting41Critical Inspection of Imagery43ACES44OpenColorIO45Appendix46Lookup Tables47ASC-CDL50File Formats51DCI P3 and X’Y’Z’52Daylight and Blackbody Curves53Acknowledgements54References & Further reading55
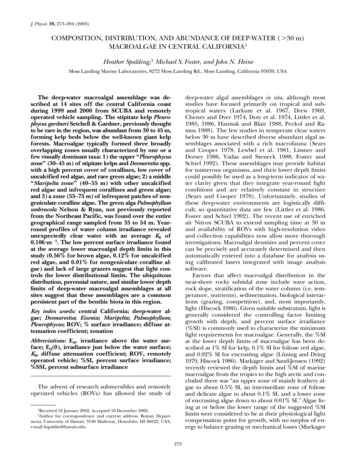
1. IntroductionPractitioners of visual effects and animation encounter color management challenges which are notcovered in either traditional color-management textbooks or online resources. This leaves digital artistsand computer graphics developers to fend for themselves; best practices are unfortunately often passedalong by word of mouth, user forums, or scripts copied between facilities.This document attempts to draw attention to the color pipeline challenges in modern visual effects andanimation production, and presents techniques currently in use at major production facilities. We alsotouch upon open-source color management solutions available for use at home (OpenColorIO) and anindustry attempt to standardize a color framework based upon floating-point interchange (ACES).This fully computer-generated image touches upon many modern techniques in color management, including ascene-linear approach to rendering, shading, and illumination, in addition to on-set lighting reconstruction andtexture management1. Visual effects by Sony Pictures Imageworks. Images from “The Amazing Spider-Man”Courtesy of Columbia Pictures. 2012 Columbia Pictures Industries, Inc. All rights reserved.This image, though dark, has good detail in the shadows. If these shadow areas appear flat black, please confirmyour display calibration and gamma.1Cinematic Color6
What color management challenges are faced in visual effects and animation production?Various Requirements: It is difficult to lump all of visual effects and animation into a single bucket, aseach discipline has potentially differing color pipeline goals and constraints. For example, in visualeffects production one of the golden rules is that image regions absent visual effects should not bemodified in any way. This places a constraint on color pipelines - that color conversions applied to thephotography must be perfectly invertible. Animation has its own unique set of requirements, such ashigh-fidelity handling of saturated portions of the color gamut. Thus, color pipelines for motionpictures must keep track of the “big picture” priorities, and are often tailored to specific productions.Various Color Philosophies: There are many schools of thought on how to best manage color in digitalmotion-picture production. (We assert there is far more variation in motion-picture color managementthan in desktop publishing). Some facilities render in high-dynamic range (HDR) color spaces. Otherfacilities prefer to render in low-dynamic range (LDR). Some facilities rely on the output displaycharacteristics (i.e., gamma) as the primary tool in crafting the final image appearance. Others do not. Itis challenging to provide standardized workflows and toolsets when current practice has such variation.Furthermore, the costs vs. benefits of adapting new color management techniques is often stackedagainst change. When something goes wrong in a motion-picture color pipeline, it can have potentiallylarge financial consequences if work needs to be re-done. Furthermore, while color processing decisionsare made early during the lifetime of a production, the consequences (both positive and negative) maynot be evident until many months down the line. This decoupling of cause and effect makesexperimentation and innovation challenging, and all too often leads people to assert “We’ve always doneit this way, it’s not worth trying something new”.The flip-slide is that the computer graphics techniques used in motion-picture production are rapidlychanging, outgrowing many classic color management techniques. For example, the recent trend towardphysically-based rendering, physically-based shading, and plausible lighting models are only utilized totheir fullest extent when working with dynamic ranges typical of the real world (HDR). We thus assertthat going forward, it will become increasingly beneficial for computer graphics applications and visualeffects and animation facilities to consider modern approaches to color management. Of course, justbecause a color management technique is new and shiny does not imply superiority. Care must be takenwhen adopting new approaches to preserve the benefits of the historic color pipelines to the greatestextent possible.Multiple Inputs & Outputs: In live-action visual effects imagery is often acquired using a multitude ofinput capture devices (digital motion picture cameras, still cameras, etc) and it is often desired toseamlessly merge sources. On the output side, the final image deliverables are often tailored to distinctviewing environments: digital theatrical presentation, film theatrical presentation, as well as hometheater. Each of these outputs has different color considerations. Furthermore, artists often work ondesktop displays with “office” viewing conditions, yet require a high-fidelity preview of the finalappearance.Cinematic Color7
Complex Software Ecosystem: Another challenge is that the majority of visual effects and animationproductions use many software tools: image viewers, texture/matte painting applications, compostingapplications, lighting tools, media generation, etc). Although it is imperative that artists work in a colormanaged pipeline across multiple applications, color support is quite varied between software vendors.Ideally, all software tools that interchange images, perform color conversions, or display images shouldbe color managed in a consistent manner. The issue of interchange takes on an even more complexangle when you consider that multiple facilities often share image assets on a single film. Colormanagement practices that encourage high-fidelity interchange are sorely needed.Robust Imagery: Visual effects and animation are not the end of the line in terms of image processing.Digital intermediate (DI) is a powerful tool for crafting the final appearance of a motion-picture (even foranimated features) and may substantially impact the appearance of the final film. It is therefore anecessity to create computer graphics which are robust to such workflows, and maintain fidelity evenunder drastic color corrections. If digital intermediate is not considered during production, it is verylikely that late stage color corrections will reveal latent problems in the computer-generated imagery.The eventual application of compression is also a consideration.Future-Proof: Future improvements to display technology (such as wider dynamic range) are on the nearhorizon. For large productions, it is very prudent to take all steps possible to future-proof the computergenerated imagery, such that you are only a “remaster away” from taking advantage of the newtechnology.Cinematic Color8
2. Color ScienceWhile a detailed overview of colorimetry is beyond the scope of this document, there are many textbookswhich introduce color science in wonderful detail: Measuring Color [Hunt, 1998] is a compact overview of color measurement and color perception. Color Imaging: Fundamentals and Application [Reinhard, et al. 2008] presents a ground-up view of colorfundamentals, and also touches upon applications such as camera and display technology. Color Science [Wyszecki and Stiles, 1982] is the canonical bible for color scientists.A Brief Introduction to Color ScienceColor science blends physical measurement along with characterizations of the human visual system.The fundamentals of colorimetry (the measurement and characterization of color) provide an importantconceptual framework on which color management is built. Without color science, it would not bepossible to characterize displays, characterize cameras, or have an understanding of the imagingfundamentals that permeate the rest of computer graphics. While it is possible to immediately jumpinto color pipeline implementations, having a rudimentary understanding of concepts such as spectralmeasurement, XYZ, and color appearance provide a richer understanding of why particular approachesto color management are successful. Furthermore, being familiar with the vocabulary of color science iscritical for discussing color concepts with precision.A study of color science begins with the spectrum. One measures light energy as a function ofwavelength. The human visual system is most sensitive to wavelengths from 380-780 nm. Light towardsthe middle of this range (yellow-green) is perceived as being most luminous. At the extremes, lightemitted above 780 nm (infrared) or below 380 nm (ultraviolet) appears indistinguishable from black, nomatter how intense.350400450500550600650700750800Wavelength (nm)The electromagnetic spectrum from approximately 380-730 nm is visible to human observers. 2Other animals can perceive light outside of this range. Bees, for example, see into the ultraviolet. And imagingdevices such as digital cameras typically include internal filtration to prevent sensitivity to infrared.2Cinematic Color9
The human visual system, under normal conditions, is trichromatic3 . Thus, color can be fully specifiedas a function of three variables. Through a series of perceptual experiments, the color community hasderived three curves, the CIE 1931 color matching functions, which allow for the conversion of spectralenergy into a measure of color. Two different spectra which integrate to matching XYZ values willappear identical to observers, under identical viewing conditions. Such spectra are known as metamers.The specific shape of these curves is constrained4 ; based upon the results of color 0500550600650700750800Wavelength (nm)The CIE 1931 Color Matching Functions convert spectral energy distributions into a measure of color, XYZ. XYZpredicts if two spectral distributions appear identical to an average5 human observer.When you integrate a spectral power distribution with the CIE 1931 curves, the output is referred to asCIE XYZ tristimulus values, with the individual components being labelled X, Y, and Z (thecapitalization is important). The Y component has special meaning in colorimetry, and is known as thephotopic luminance function. Luminance is an overall scalar measure of light energy, proportionallyweighted to the response of human color vision. The units for luminance are candelas per metersquared (cd/m2), and are sometimes called “nits” in the video community. The motion-picturecommunity has historically used an alternative unit of luminance, “foot-lamberts,” where 1 fL equals3.426 cd/m2. A convenient trick to remember this conversion is that 14.0 fL almost exactly to 48.0 cd/m2,which coincidentally also happens to be the recommended target luminance for projected theatricalwhite.For the purposes of this document we assume color normal individuals (non color-blind), and photopic lightlevels (cone vision).4 These the curves serve as the basis functions for characterizing a human’s color vision response to light; thus alllinear combinations of these color matching functions are valid measures of color. This particular basis was chosenby locking down Y to the measured photopic luminance response, and then picking X and Z integration curves tobound the visible locus within the X, Z octant.5 The Color Matching Functions are derived from averaging multiple human observers; individual responses showvariation. While broad-spectrum light sources have historically not accentuated user variation, the shift to narrowspectrum/wide-gamut display technologies reveals may increasingly reveal the latent variations in color perception.3Cinematic Color10
Note that XYZ does NOT model color appearance. XYZ is not appropriate for predicting a spectralenergy distribution's apparent hue, to determine how “colorful” a sample is, or to determine how tomake two color spectra appear equivalent under different viewing conditions6 . XYZ, in the absence ofadditional processing, is only sufficient for predicting if two spectral color distributions can 0600650700750800Wavelength (nm)1.3Inputspectrummultiplied by.X componentspectralsensitivity1.0equals.1.3 1.0 1.3WeightedfunctionArea under the weighted function represents thecomponent of X in the input spectrumCIE XYZ is calculated by multiplying the energy in the input spectrum (top) by the appropriate colormatching function (middle), and then summing the area under the curve (bottom). As the colormatching functions are based upon the sensitivities human color vision, the spectral energy duringintegration is zero-valued outside the visible spectrum.Color appearance models, far more complex than simple integration curves, model eccentricities of the humanvisual system and be used to creating matching color perceptions under differing conditions. One of the mostpopular color appearance model is CIECAM02. See [Fairchild, 98] for details.6Cinematic Color11
Spectroradiometers measure spectral power distributions, from which CIE XYZ is computed. By measuringthe spectral energy, such devices accurately measure colorimetry even on colors with widely differentspectral characteristic. Spectroradiometers can also be pointed directly at real scenes, to act as highfidelity light-meters. Unlike normal cameras, spectroradiometers typically only measure the color at asingle “pixel”, with a comparatively large visual angle (multiple degrees for the color sample is common).Internally, spectroradiometers record the energy per wavelength of light (often in 2, 5, or 10 nmincrements), and integrate the spectral measurements with the color matching functions to display theXYZ or Yxy tristimulus values. The exposure times of spectroradiometers are such that color can beaccurately measured over a very wide range of luminance levels, in addition to light output with highfrequency temporal flicker (such as digital projector). While spectroradiometers are thus incrediblyuseful in high-fidelity device characterization and calibration, they maintain laboratory-grade precisionand repeatability, and are priced accordingly.Spectroradiometers (left) accurately measure the visible spectrum and can also output an integrated CIEXYZ. Alternative approached to measuring color such as the colorimeter “puck” (right) are far morecost-effective but do not record the full color spectra. Such devices therefore are only color accurate when“tuned” to a specific class of display technology. Images courtesy Photo Research, Inc., and EIZO.It is often convenient to separate color representations into luminance and chroma components, suchthat colors can be compared and measured independent of intensity. The most common technique fordoing so is to to normalize “Cap X, Y, Z” by the sum (X Y Z) and then to represent color as (x, y, Y). Notethe capitalization.x X(X Y Z)y Y(X Y Z)The chromaticity coordinates (x,y) define color independent of luminance. It is very common to plotthese values, particularly when referring to display device gamuts.“Little x, little y” (x,y) is referred to as the chromaticity coordinates, and is used to plot colorindependent of luminance. When one converts all possible spectra into x,y,Y space and plots x,y they fallinto a horse-shoe shaped region on the chromaticity chart. The edge of the horseshoe is called thevisible locus, and corresponds to the most saturated color spectra that can be created. In this chart,luminance (Y) is plotted coming out of the page, orthogonal to x,y. [brucelindbloom.com] is a wonderfulonline resource for additional color conversion equations.Cinematic Color12
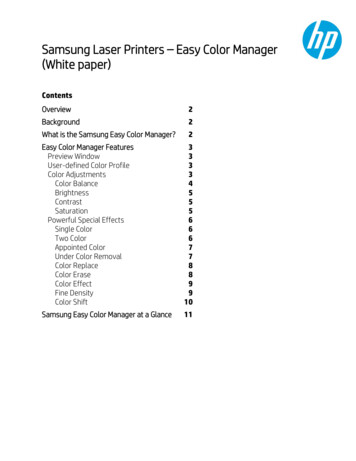
.60.70.8xAll possible light spectra, when plotted as xy chromaticity coordinates, fill a horseshoe-shaped region. The regioninside the horseshoe represents all possible integrated color spectra; the region outside does not correspond tophysically-possible colors. Such non-physically plausible chromaticity coordinates are often useful for mathematicalencoding purposes, but are not realizable in ANY display system.Additive display systems such as television create colors by blending three colors of light. Red, green,and blue are most often used, as these allow for much of the visible gamut to be reproduced. The gamutof colors that can be reproduced is the triangle enclosed by the primaries. Note that because the outerboundary of horseshoe is curved, there is no possible choice of three colors which encloses the fullvisible gamut. (Remember, you cannot build real displays with primaries outside of the horseshoe). Thisis why some recent television manufactures have begun to experiment with adding a fourth colorprimary.Although it is not immediately apparent, the chromaticity chart has very poor perceptual uniformity.The distances between colors in chromaticity space do not directly relate to their apparent perceptualdifferences. Two colors nearby in xy may be perceived as appearing very dissimilar, while colors colorsfar apart may be perceived as being indistinguishable. See “MacAdam ellipses” in traditional colortextbooks for precise graphics representations of this non-uniformity. Roughly speaking, saturatedgreen colors in xy space are over-accentuated relative to their perceptual similarity. The perceptualnonuniform of XYZ (and xy) is not surprising given that XYZ does not model color appearance. Onecolor space that does attempt to create a perceptually uniform color space is CIE L*u*v*, which iscalculated using XYZ as an input. While a full discussion of L*u*v* (and more modern alternatives) isoutside the scope of this document, when visualizing color gamuts keep in mind that a uv plot is oftenmore informative than the equivalent xy chromaticity diagram.Finally, as color is inherently a three dimensional quantity, any discussion which makes use of twodimensional charts tends to be misleading. For a 3-D graphical exploration of CIE XYZ, see Visualizingthe XYZ Color Space [Selan 2005].Cinematic Color13
2.1.Color Encoding, Color Space, and Image StatesThus far we have discussed the measurement of color, but have not tied these measurements back toseemingly familiar computer graphics concepts such as RGB. So what is RGB?RGB is a color encoding where red, green, and blue “primaries” are additively mixed to reproduce arange (gamut) of colors. The specific color appearance of pure red, green, and blue is tied to the chosendisplay device; often identified using chromaticity coordinates. The code values sent to a display deviceoften correspond non-linearly to the emitted light output, as measured in XYZ. This non-linearity wasoriginally a consequence of display technology, but today serves a continued purpose in increasing thecoding efficiency of the transmitted images.All RGB colors have units. Sometimes an RGB pixel’s units are explicit, such as measuring the emittedlight from a display using a spectroradiometer and being able to reference pixel values in XYZ cd/m2.However, sometimes the units are only indirectly related to the real world, such as providing amathematical conversion to measurable quantities. For example, having code values represent either thelogarithm or exponent of RGB is common. This definition of how measurable color quantities relate toimage RGB code values is referred to as the color encoding, or more commonly in the motion-picturecomputer graphics community, color space7 . In the case of display technology, common color encodings(relations of code value to measurable XYZ performance) include sRGB and DCI-P3.Considering image display only provides part of the color encoding story. In addition to relating RGBvalues to display measurements, one can also relate RGB values to the performance characteristics of aninput device (i.e., a camera). Input colorimetry can be measured in real world units as well. It is notdifficult to measure an input spectra with the spectrophotometer in XYZ, and then compare this to theRGB values output from the camera. This process, called camera characterization, will be discussedfurther in section 2.3.It is a meaning abstraction to categorize color spaces by the “direction” of this relationship to real worldquantities, which we refer to as image state. Color spaces which are defined in relation to displaycharacteristic are called display-referred, while color spaces which are defined in relation to inputdevices (scenes) are scene-referred. While there are other flavors of images states (intermediate-referred,focal-plane referred) display-referred and scene-referred colorimetry are most commonly used inmotion-picture color management, and will be the focus of the next sections.For further information on image state and color encodings, various Ed Giorgianni publications providesignificantly greater detail. [Giorgianni 98] [Giorgianni 05]The color science community looks down upon the use of color space to denote RGB encodings; color space isstrictly preferred to refer to the broader class of color encoding, examples of which are RGB, CMY, HSV, L*a*b*,etc.). However, the mis-use of the color space is so ubiquitous in film production that that we will reluctantly adhereto industry convention.7Cinematic Color14
2.2.Display-Referred ImageryDisplay-referred imagery is defined colorimetrically with regards to an image as presented on a display.The display may be either an idealized display standard, or a physical display that exists in the realworld. When “RGB” is used casually without qualification of colorimetry (such as in web standards), it ismost likely implying display-referred imagery. The primary advantage of working with display-referredimagery is that if the user’s display matches the reference display definition, one can accurately displaythe raw pixel values on the screen without any additional color conversions. I.e., if a user creates animage by directly manipulating an image raster, they are working in a display-referred space. Thissimplicity in color management makes display-referred color processing a popular default in desktoppublishing applications.Linearized Display-Referred ImageryAs mentioned previously, the RGB code values that are sent to the display are not directly proportionalto light emitted from the display. However, there are many cases in computer graphics where workingwith pixels in a color space proportional to light output is preferable. For example, in anti-aliasing andimage filtering, one critical requirement is that pixel energy should be preserved. What this means isthat the total light energy emitted from the display - both before and after image processing - should beidentical. If this were not true, then resizing an image would change the apparent image intensity, whichis not ideal. Such “loss of energy” artifacts are particularly apparent when applied to image sequences,where slow transitions between light and dark regions can “crawl” when energy preservation is ignored.To linearize display-referred imagery, one must come up with a model of the display technology whichpredicts how much light, as a function of code value, is emitted. When modeled by a single number, thisis referred to as Gamma. Gamma value of 2.2 are a very common approximation to the values seen inreal world display technologies. The exponent value used to relate RGB code values to linear light iscalled gamma. Gamma is generally defined as the inverse of the exponent, but it is useful to be explicitas there the language people use to describe gamma is usually ambiguous. One easy way to remembergamma’s “directionality” is that middle gray display-referred RGB, when linearized, become “smaller”.I.e., an RGB code value of 128 (out of 255), when linearized with a 2.2 gamma, is approximately 0.218.L( gain x V offset )The colorimetric performance of displays are often reasonably approximated using a gain-offset-gamma(GOG) approximation. V denotes the normalized input device code value, and L is the normalizedluminance emitted from the display.One of the additional benefits of using a gamma function is that it offers a more perceptually uniformencoding space, which better utilizes the limited number of bits available in the display link. Thus, evenon devices which are based upon inherently linear technology (such as DLP-based digital projectors), itremains useful to artificially emulate a gamma value. See Charles Poynton’s Gamma FAQ [Poynton 12]for a thorough discussion of gamma.Cinematic Color15
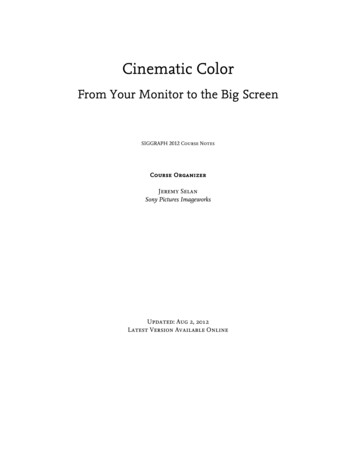
sRGBDue to differences in inherent display technologies, there is substantial variation in the appearance ofRGB when the same code values are sent to multiple displays, making the unambiguous distribution ofRGB imagery difficult. As a solution, a standard “idealized” display has been defined, sRGB, which realdisplays often attempt to reproduce. The intent of sRGB (“Standard RGB”) is to define the colorcharacteristics of a standardized “average” RGB display, such that imagery on one monitor matches theappearance of a different monitor. When a monitor is properly calibrated to sRGB, the output isreproducible and well defined. Older display technologies (such as CRTs) naturally approach the sRGBspecification. However, modern technologies (such as LCD and OLED) - which have very differentinherent image responses - typically provide an option to emulate the sRGB specification to maintaincompatibility with existing imagery.Linearizing RGBdevice (sRGB)If RGBdevice0.03928 then RGBlinearelse RGBlinearRGBdevice12.920.055 RGBdevice2.41.055RGBlinear to XYZ conversion (D65 reference white 15220.07217500.01933390.1191920 0.9503041RGBThese steps allow one to predict emitted light in CIE XYZ, as emitted from a calibrated sRGB. First,device RGB is converted to linearized RGB. Next, the linear RGB is converted to XYZ using theconversion matrix. Note that even though the sRGB transfer function uses a 2.4 exponent, due to theinclusion of the scaling and offer factor this transfer function approximates a 2.2 gamma over the rangeof [0,1].Because display-referred imagery is referenced to the light emitted from a display, it’s possible toconvert RGB values to output CIE XYZs. For example, it is sensical to specify a display’s white point andblack point. The white point would be the real world XYZ for the maximum RGB value (on a 8-bitdisplay, 255, 255, 255). The black point is the XYZ for the minimum RGB value (0,0,0).As the dynamic range of display-referred image is well defined - with a min code value and max codevalue - integer encodings are a natural representation. Eight bits is common, and lets you represent therange of [0, 255]. Note that on high quality displays, under ideal conditions, eight bits is not sufficient toprevent the appearance of banding (this artifact is particularly noticeable on grayscale imagery withsmooth gradients). For this reason professional displays (such as medical displays, or those used inprofessional color applications) often display images with greater precision (10/12 bits are common).Cinematic Color16
0.90.80.7G0.6yRec. 709gamut0.50.4xRD65white point0.3
About the presenter Jeremy Selan is an Imaging Supervisor at Sony Pictures Imageworks specializing in color, lighting, and compositing. His work has been used on dozens of motion pictures including The Amazing Spider-Man, Alice in Wonderland, and The Smurfs.Jerem