Transcription
J. Phycol. 39, 273–284 (2003)COMPOSITION, DISTRIBUTION, AND ABUNDANCE OF DEEP-WATER ( 30 m)MACROALGAE IN CENTRAL CALIFORNIA 1Heather Spalding,2 Michael S. Foster, and John N. HeineMoss Landing Marine Laboratories, 8272 Moss Landing Rd., Moss Landing, California 95039, USAThe deep-water macroalgal assemblage was described at 14 sites off the central California coastduring 1999 and 2000 from SCUBA and remotelyoperated vehicle sampling. The stipitate kelp Pleurophycus gardneri Setchell & Gardner, previously thoughtto be rare in the region, was abundant from 30 to 45 m,forming kelp beds below the well-known giant kelpforests. Macroalgae typically formed three broadlyoverlapping zones usually characterized by one or afew visually dominant taxa: 1) the upper “Pleurophycuszone” (30–45 m) of stipitate kelps and Desmarestia spp.with a high percent cover of corallines, low cover ofuncalcified red algae, and rare green algae; 2) a middle“Maripelta zone” (40–55 m) with other uncalcifiedred algae and infrequent corallines and green algae;and 3) a zone (55–75 m) of infrequent patches of nongeniculate coralline algae. The green alga Palmophyllumumbracola Nelson & Ryan, not previously reportedfrom the Northeast Pacific, was found over the entiregeographical range sampled from 35 to 54 m. Yearround profiles of water column irradiance revealedunexpectedly clear water with an average K0 of0.106 m 1. The low percent surface irradiance foundat the average lower macroalgal depth limits in thisstudy (0.56% for brown algae, 0.12% for uncalcifiedred algae, and 0.01% for nongeniculate coralline algae) and lack of large grazers suggest that light controls the lower distributional limits. The ubiquitousdistribution, perennial nature, and similar lower depthlimits of deep-water macroalgal assemblages at allsites suggest that these assemblages are a commonpersistent part of the benthic biota in this region.deep-water algal assemblages in situ, although moststudies have focused primarily on tropical and subtropical waters (Larkum et al. 1967, Drew 1969,Cheney and Dyer 1974, Doty et al. 1974, Littler et al.1985, 1986, Hanisak and Blair 1988, Peckol and Ramus 1988). The few studies in temperate clear watersbelow 30 m have described diverse abundant algal assemblages associated with a rich macrofauna (Searsand Cooper 1978, Lewbel et al. 1981, Lissner andDorsey 1986, Vadas and Steneck 1988, Foster andSchiel 1992). These assemblages may provide habitatfor numerous organisms, and their lower depth limitscould possibly be used as a long-term indicator of water clarity given that they integrate year-round lightconditions and are relatively constant in structure(Sears and Cooper 1978). Unfortunately, studies ofthese deep-water environments are logistically difficult, so quantitative data are few (Littler et al. 1986,Foster and Schiel 1992). The recent use of enrichedair Nitrox SCUBA to extend sampling time at 30 mand availability of ROVs with high-resolution videoand collection capabilities now allow more thoroughinvestigations. Macroalgal densities and percent covercan be precisely and accurately determined and thenautomatically entered into a database for analysis using calibrated lasers integrated with image analysissoftware.Factors that affect macroalgal distribution in thenear-shore rocky subtidal zone include wave action,rock slope, stratification of the water column (i.e. temperature, nutrients), sedimentation, biological interactions (grazing, competition), and, most importantly,light (Hiscock 1986). Given suitable substratum, light isgenerally considered the controlling factor limitinggrowth with depth, and percent surface irradiance(%SI) is commonly used to characterize the minimumlight requirements for macroalgae. Generally, the %SIat the lower depth limits of macroalgae has been described as 1% SI for kelp, 0.1% SI for foliose red algae,and 0.02% SI for encrusting algae (Lüning and Dring1979, Hiscock 1986). Markager and Sand-Jensen (1992)recently reviewed the depth limits and %SI of marinemacroalgae from the tropics to the high arctic and concluded there was “an upper zone of mainly leathery algae to about 0.5% SI, an intermediate zone of folioseand delicate algae to about 0.1% SI, and a lower zoneof encrusting algae down to about 0.01% SI.” Algae living at or below the lower range of the suggested %SIlimits were considered to be at their physiological lightcompensation point for growth, with no surplus of energy to balance grazing or mechanical losses (MarkagerKey index words: central California; deep-water algae; Desmarestia; Eisenia; Maripelta; Palmophyllum;Pleurophycus; ROV; % surface irradiance; diffuse attenuation coefficient; zonationAbbreviations: Ed, irradiance above the water surface; Ed(0), irradiance just below the water surface;K0, diffuse attenuation coefficient; ROV, remotelyoperated vehicle; %SI, percent surface irradiance;%SSI, percent subsurface irradianceThe advent of research submersibles and remotelyoperated vehicles (ROVs) has allowed the study of1Received18 January 2002. Accepted 16 December 2002.for correspondence and current address: Botany Department, University of Hawaii, 3190 Maileway, Honolulu, HI 96822, USA;e-mail hspaldin@hawaii.edu.2Author273
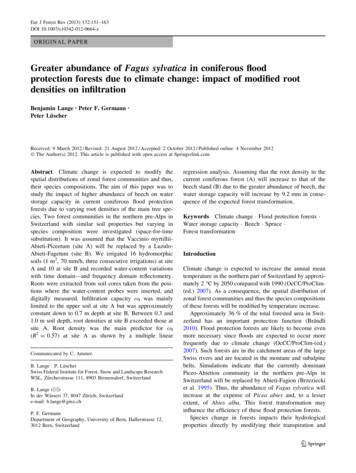
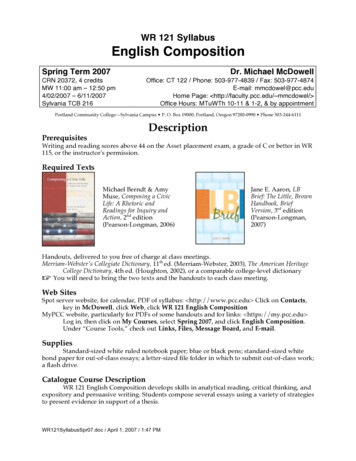
274HEATHER SPALDING ET AL.and Sand-Jensen 1992). Central California is well suitedfor further evaluating these relationships given theavailability of rock substratum, cold nutrient rich water,and apparent lack of ecologically important grazers below 30 m.Thorough surveys of deep-water macroalgae wouldalso aid biogeographical studies that are often hindered by the necessity of interpreting distributionaldata based on incomplete collections or differences intaxonomic interpretation (Murray et al. 1980). In thecase of deep-water algae in the Northeast Pacific, dataare essentially nonexistent for the northern cold-temperate (Oregonian) biogeographical province (Vadasand Steneck 1988). A few collections have been madewith SCUBA to 50 m in central California (P. Silva,University of California at Berkeley, personal communication), but little is known about general composition, lower depth limits, or abundances. The diversityof algae present in central California, in addition tothe suggested major distributional faunal boundaryfound within it (approximately 36 00 to 36 30 northlatitude; Murray et al. 1980), indicate the importanceof floristic information from the region to biogeographical analyses.We describe the vertical distribution, abundance,and composition of deep-water macroalgae from 30 mto their lower depth limits at 14 sites along 30 km ofthe central California coast in 1999 and 2000. Spatialand temporal differences among sites were examined,as well as the percent subsurface irradiance (%SSI) associated with lower depth limits and diffuse attenuation coefficients (K0).materials and methodsFourteen sites were surveyed along the central Californiacoast (Fig. 1) during 1999 and/or 2000 with the ROV Ventanaand by divers using enriched air Nitrox SCUBA (detailed sitedescriptions and names in Spalding 2002). Three sites weresurveyed during 1999 and 2000 for temporal comparisons,whereas the other sites were surveyed to resolve spatial patterns. The substratum at Point Sur was gently sloping over alarge area, making sampling in a continuous transect impossible given time constraints. Two sites at Point Sur (M and N)were selected to represent depths less than or at least 50 m andcombined for analysis. The central California coast is characterized by near-shore submarine canyons, upwelling, cold water(8–15 C surface), and high nutrients (Breaker and Broenkow1994). Water clarity (diver visibility) ranged from 1 to 30 m during the study but was typically 10 m. This area consists primarilyof rocky pinnacles and boulders separated horizontally by largeareas of soft sediment. Sites were selected based on the availability of gently ( 45 degrees) sloping rocky substratum from30- to 100-m depths and accessibility. Most sites were fully exposed to prevailing northwesterly wind and swell, so samplingwas done during calm weather from June to September. Seaand weather conditions were similar during 1999 and 2000,with no anomalous weather conditions occurring either year.ROV audio and digital video observations were recordedonto digital video with a Sony DXC-3000 Betacam camera in1999 and a Sony HDC-750H camera (Sony, Tokyo, Japan) in2000. ROV cameras were equipped with four 10-mW 635-nm lasers calibrated before each ROV deployment. Depth, transmissivity, and GPS position were recorded by the ROV every 15 son all dives. Voucher specimens of dominant algae were collected with a scraping tool and suction device mounted on aFig. 1. Sites sampled with the ROV and by divers during1999 and/or 2000.manipulator arm. Algae were tentatively identified according toAbbott and Hollenberg (1976) and verified (with nomenclatural revisions) by I. A. Abbott. Only macroalgae not seen in1999 were collected in 2000. We attempted to sample macroalgae in at least five gently sloping rocky areas at every 5-m depthincrement from 30 to 100 m during each survey at a site, butthe number of areas sampled ranged from 0 to 17 per depth increment depending on the availability of rock substratum, timeconstraints, and technical difficulties (see Spalding 2002 forsample sizes at each site and depth). Sampling areas were atleast 10-m apart, and areas exposed to sand scour or possibleshade from overhanging rocks were not surveyed. Rock substratum was often discontinuous, so rock features were located using ROV sonar and the closest rock within the desired depthrange was surveyed. ROV lighting was adjusted in situ to maximize the visibility of the lasers and macroalgae. Areas sampledwith the ROV were generally approximately 1 m 2 in size butranged from 0.5 to 2 m 2.Laser measure (Tusting and Davis 1993) and Optimas version 6 image analysis software (Media Cybernetics, Inc., SilverSpring, MD, USA) were used with the calibrated distance between lasers in the video to delimit and measure sampling areason the substratum (quadrats) and to determine the percentcover and densities of most macroalgal species. Some specieswere difficult to distinguish on the video, so percent cover datawere analyzed as major macroalgal groups (coralline red algae,uncalcified red algae, uncalcified red algal crusts, brown algae,and green algae). Layered macroalgal assemblages were common, especially in areas with stipitate kelps. Cover of algae thatcommonly occurred beneath another layer was determinedonly in subareas that were not obscured by an overstory. Thus,areas used to assess cover of the lowest layer (typically nongeniculate coralline algae) were smaller than the total area of eachquadrat. Every effort was made to sample algae in each layer ineach quadrat with the ROV. The largest subarea for a particularlayer in each video of the total area was used in analyzing thepercent cover of species or groups most commonly in that particular layer.SCUBA divers sampled algal abundance and collectedvoucher specimens at approximately 30-m depths (Table 1; authorities given in this table unless otherwise noted). Time andlogistics at 30 m prohibited random sample allocation. Instead,
DEEP-WATER MACROALGAE IN CALIFORNIAdivers haphazardly selected areas of gently sloping rocky substratum separated by at least 10 m (similar to the ROV methods). One diver laid a 5-m lead line with 10 evenly spacedmarks separated by approximately 0.5 m along the rock substratum at a constant depth and, using a 1-m-long rod, counted individual algae in the 5 1-m area defined by moving the rodalong the line. The other diver estimated the percent cover ofmacroalgae (up to 1 m from the substratum) under 20 points,two on either side of each of the 10 marks on the lead line (apoint contact method similar to Cowen et al. 1982). A T-shapedpolyvinyl chloride pipe with a point at the base was used to define a point sample. The cross of the “T” was placed parallel tothe line over a mark, and the point (10 cm from the cross) waspushed down, noting successive layers of algae contacted belowand any blades within 1 m above. This was repeated on the opposite side of the line. Because more than one plant could becontacted by each point, total cover often exceeded 100%. Biasin-line placement was considered minimal, and no regular patterns were observed in the vegetation that would cause biasfrom nonrandom point allocation.Although the abundance estimates from divers and theROV sampling were generally similar (Spalding, unpublisheddata), differences in methods affected the types of analyses thatcould be done. Species, especially of uncalcified red algae, wereeasier to identify by divers in situ than with the ROV. Conversely, many small filamentous algae were collected with theROV that were not sampled by divers. Although ROV collections supplemented species information from divers, it was stillnecessary to group algae to standardize the data. This eliminated the possibility of quantitatively determining changes incomposition between sites and depths for species that couldnot be identified from ROV collections or video. The lowerdepth limits of algae were also difficult to determine with theROV given the sporadic sparse distribution of algae at theirlower depth limits. Thus, the lower depth limits are an estimateof the lowest depth observed. Overall changes in abundance forsites sampled both years (see Results, Fig. 2) were averaged.Two-way model I analyses of variance for differences in theabundance of common macroalgae among sites and betweenyears were done using Statistica (Statsoft, Inc. 1997, Tulsa, OK,USA). Before testing, data were examined for homogeneity of variances using Cochran’s C test and for normality by graphic interpretation of residuals. Data with unequal variances were transformed and the data reexamined. Because of technical difficultiesand limited sampling time, sample sizes were uneq
onto digital video with a Sony DXC-3000 Betacam camera in 1999 and a Sony HDC-750H camera (Sony, Tokyo, Japan) in 2000. ROV cameras were equipped with four 10-mW 635-nm la-sers calibrated before each ROV deployment. Depth, transmis-sivity, and GPS position were recorded by the ROV every 15 s on all dives. Voucher specimens of dominant algae were col- lected with a scraping tool and suction .