Transcription
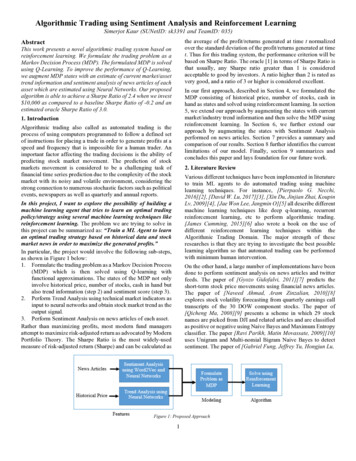
Algorithmic and High-frequencytrading: an overviewMarco AvellanedaNew York University &Finance Concepts LLCQuant Congress USA 2011
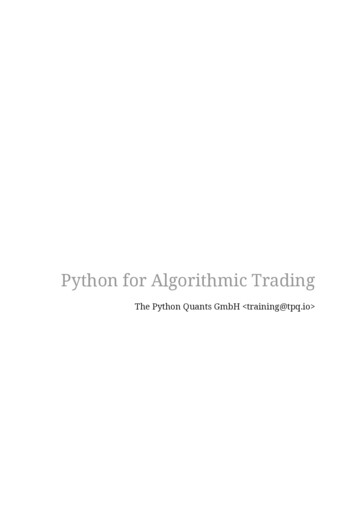
US Equities markets: percentage oforders generated by algorithmsPercentage of Equity Volume908070605040302010020052006High Touch Orders200720082009Algorithmic (Auto Trading)2010DMA
The market in numbers US Equities volumes: 5 and 10 billion shares per day 1.2 – 2.5 Trillion shares per year Annual volume: USD 30 – 70 trillion At least 30% of the volume is algorithmic: 360 a 750 billion shares/year Typical large sell side’’ broker trades between 1 and 5 USD Tri per year using algos Each day, between 15,000 and 3,000 orders are processed An algorithmic execution strategy can be divided into 500 – 1,000 small daughterorders
Algorithmic trading Algorithmic trading: the use of programs and computers to generate and execute(large) orders in markets with electronic access. Orders come from institutional investors, hedge funds and Wall Street trading desks The main objective of algo trading is not necessarily to maximize profits but ratherto control execution costs and market risk. Algorithms started as tools for institutional investors in the beginning of the 1990s.Decimalization, direct market access (DMA), 100% electronic exchanges, reductionof commissions and exchange fees, rebates, the creation of new markets aside fromNYSE and NASDAQ and Reg NMS led to an explosion of algorithmic trading and thebeginning of the decade.Today, brokers compete actively for the commission pool associated withalgorithmic trading around the globe – a business estimated at USD 400 to 600million per year.
Why Algorithms? Institutional clients need to trade large amounts of stocks . These amounts are oftenlarger than what the market can absorb without impacting the price. The demand for a large amount of liquidity will typically affect the cost of the tradein a negative fashion ( slippage’’) Large orders need to be split into smaller orders which will be executedelectronically over the course of minutes, hours, day. The procedure for executing this order will affect the average cost per share,according to which algorithm is used. In order to evaluate an algorithm, we should compare the average price obtained bytrading with a market benchmark ( global average’’ of the daily price, closing price,opening price, alpha decay’’ of a quant strategy, etc).
Main issues in Algorithmic Trading The decision of how to split the order in smaller pieces is just one of several issues. Once an algo is chosen the smaller orders need to be executed electronically Execution strategies interact with the market and decide how to place orders (Limit,Market,etc) and at what prices Objective: to achieve the best price’’ for each daughter order Recent changes in the US equity market structure (in particular, different liquidity sources)make things more interesting and complicated Dark Pools (liquidity pools that do not show the order book), ECNs (electroniccommunications networks), autonomous liquidity providers
1. Ancient’’ brokerage modelClientBrokerPhone or internetportalOld way of doing businessOrder communicatedto the floorMarket
2. Electronic marketClientBrokerTelephone orinternet site100% automaticexecution algo interactingwith order bookMarket
Electronic order-management and executionsystem (client-broker)
Client builds an order ticket which iscommunicated to the broker that executes itaccordingly
3. Electronic execution model with APIClientBrokerProgram-generatedorders (API)Algorithmic execution.placeOrder(1, IBM, BUY, 85.25, 200 ) .placeOrder(2, IBM, SELL, 84.25, 100 ) Market
4. Direct Market Access (DMA)ClientBrokerClient sends ordersdirectly to the marketClient interacts directlywith the market orderbookMarket
ECNs, Dark Pools, Multiple ExecutionVenuesBrokerageClient Smart routing’’: algorithmslook for the best venue totrade, in case more thanone venue is availableNYSENASDAQBATS
A few trading venues for US equity markets ARCA-NYSE: electronic platform of NYSE (ex- Archipelago) BATS: (Kansas) BEX: Boston Equity Exchange CBSX: CBOE Stock Exchange CSXZ: Chicago Stock Exchange DRCTEDGE: Direct Edge (Jersey City, NJ) ISE: International Securities Exchange ISLAND: Acquired by Nasdaq in 2003 LAVA: belongs to Citigroup NSX: National Stock Exchange (Chicago) NYSE: New York Stock Exchange TRACKECN: Track ECN
Reg NMS ( National market system’’)Order Protection Rule (Trade-thru rule) - protects visible liquidity at the top ofbook of automated market centers (SROs ADF participants) from being tradedthrough by executions outside each market's BBO.Access Rule - caps access fees for top of book access at .003Sub-Penny Rule - prohibits market centers from accepting quotes or orders infractions under .01 for any security priced greater than 1.00.Market Data Rule - changes the allocation of market data revenue to SROs forquotes and tradesSRO: NYSE, NASD, FINRAADF: Alternative Display Facility/ consolidation of NYSE/NASDAQ
The three steps in algorithmic tradingAlgorithmic trading strategy(Macrotrader)Order placing algorithms(Microtrader)Smart routing in case of more than one availableTrading venue
Time-weighted average price (TWAP)Equal amount of shares in each period of time.Example: 100,000 shares TWAP/all day13005005-minute consecutive intervals
Volume-weighted average price(VWAP)Volume is greater in the beginning and at the end of the day
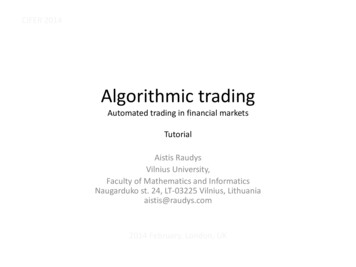
Volume-weighted average price(VWAP)Volume changes in the course of the day (less volume in the middle).VWAP: To execute a large order, the way in which we split itdepends on the time of day (minimize impact)Objetive: obtain an average price weighted by volume’’Algorithm:1. estimate the average volume traded in every 5 minute interval2. In each time-interval, execute an amount proportional to the normative volumefor that intervalProperties:1. the algorithm always concludes (trade sizes are known in advance)2. volume function is estimated using historical data. This may not correspondexactly to ex-post VWAP.
0%1,5001.5%1,0001.0%5000.5%00.0%Timet2VWAP (t1 , t 2 ) V (t ) P(t )t t1 V (t )t2t t1% of Day Volume3,0003.0%VWAP TradingVolume Prof ile
Percentage of Volume (POV) The PoV (Percentage of Volume) algorithm addresses the problem of VWAP by using theactual traded volume of the day as benchmark. The idea is to have a contant percentageparticipation in the market along the trading period. If the quantity that remains to be traded is Q, and the participation ratio is , the algoalgo computes the volume V traded in the period (t- ΔT, t) and executes a quantityq min(Q,V* )3000Pov TradingTraded 511:5012:2513:00Time13:3514:1014:4515:20
V (t ) total volume traded in the market up to time tQ(t ) number of shares that remain to be traded. ( Q(0) initial quantity)Q(t t ) Q(t ) min V (t ) V (t t ) , Q(t ) dVdV dQ ;Qt t 0 dtdtdt dQdV 0; Q t t 0dt dtdQdV Q T Q 0 V T Q 0 V T dtdtdQdVp (t ) p (t ) dtdtT 0T 0TdQdVp (t ) p (t )dtdt0TdQdVp (t ) p (t )dtdt 0Q 0 V T POV is similar toWVAP if ratio is small(Or is it? More later )
Almgren-Chriss ( Expected Shortfall’’)Market impact combined with urgency in execution’’ ( price risk)dp(t ) av t dt dZ t dQ t v t dtp t p (t ) b v t Dynamic price model withprice impact ( permanentimpact’)Execution price ( temporary impact’)T T TdQ t dQ t dQ t E E p t dt E p(t ) b dt dtdt 0 dt 0 02V Expected executioncostT22 Q0 Qtdt Execution risk0min E V QOptimization problem
Analytic solution 2 sinhT t a b Q t Q 0 2 sinh T a b Q t sinh 1 ,Q 0 sinh T 2a b, tTOmega: proportional to execution time, varies directly with risk-aversion andvolatility, inversely to market impact elasticitiesOmega (price risk)/(impact risk)
Case 0 , TWAP (VWAP)Quantity thatremains to tradeImpact risk price riskAlgorithm TWAP orVWAPTime elapsed
Shares remainingCase 10Significant market riskExecution must befasterTime elapsed
Shares remainingCase 20Faster executionTime elapsed
Shares remainingCase 100 Slam’’ the market!Time elapsed
Generalizations of Almgren-Chrissorder-splitting algorithm Incorporate intraday volume in the impact model (modification of VWAP) Incorporate drift in the price model (momentum) Incorporate exchange fees, rebates and other costs Almgren-Chriss & generalizations are now part of the standard toolkit thatexecution brokers offer to clients
Examples of quant strategiesthat make use of algorithms Index and ETF arbitrage Statistical arbitrage ( Stat Arb’’) Liquidity providing ( Market making’’) Volume providing ( High-frequency, selective, market-making’’) High frequency trading and price forecasting
ETFs-- ETF: similar to mutual funds (holding vehicles) but which trade like stocks-- Short-selling, margin financing allowed.-- Began like equity index & basket trackers, then generalized to currencies andcommodities-- Authorized participants may create or redeem ETF shares at NAV, enforcing thetheoretical relationship between the ETF and the underlying basket-- creation units’’: 25K to 100K shares-- Authorized participants are typically market-makers in the ETFs (but not always).
Arbitrage of ETFs against the underlying basketStock N*1. Buy/sell ETFagainst the underlying share holdings***ETF2. Creation/redemption of ETFsto close the tradeStock 3Stock 2Stock 1This requires high-frequency algorithmictrading to lock-in arbitrage opportunities
Statistical ArbitrageLong-short shares/etfs – market neutralunit: 1M/usdMinSectorETFNum of StocksInternetHHH2210,350104,5001,047Real 549,9101,089Oil ExplorationOIH427,05971,6601,010Regional 08Consumer 90192,5001,025Consumer 2001,000January, 2007TotalAverageMarket CapMax
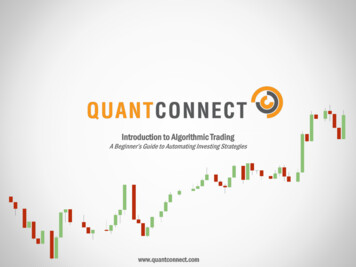
Statistical Arbitrage (II)systematiccomponentidiosyncraticcomponentdSi t dI t i i t Si t I t i t i dt dX i t Stock return is compared to the return onthe corresponding sector ETF (regression,co-integration)Residuals: modeled as a mean-revertingprocessdX i t i mi X i t dt i dWi t Ornstein-Ulembeck( AR-1)Example of sampling window 3 months ( 60 business days)
X(t) process for JPM/XLF (Financial sector ETFfrom State Street)3210-1-2-3
Constructing Stat Arb strategies-- Diversified universe of stocks, good choice ’’ of shares/ETF pairs-- Buy or sell the spread (pair) according to the statistical model-- Risk-management using real-time VaR-- Execution: VWAP-- Taking volume into account is important to avoid adverse selection’’(the reason for divergence of X(t) in practice)
Example of Stat-Arb portfolioETF
lLiquidity providing (highfrequency)LiquidityprovidingStrategic placing of limit/cancel orders (liquidity) in the order book
HF Pairs trading? Intraday evolution of FAZ & FAZ(inverse leveraged ETFs)
Algorithmic trading andthe flash crash’’ (May 6, 2010)5 de Maio 2010The reasons behind the crash of 2:15’’ were studied in a joint CFTC/SEC reportavailable online.Institutional trader sold 75,000 S&P E-mini contracts in 15 minutes PoV.* Drop in S&P futures, SPY etf, etf components* Withdrawal of autonomous MMs; stub quotes’’* HFTs provide a lot of volume but not a lot of liquidity ( hot potato trading’)
Forecasting prices in HF? Models for the dynamics of order books Modeling hidden liquidity in the market (not visible in the OB) Computing the probabilities of price changes (up or down)given liquidity on the bid side and ask-side(Avellaneda, Stoikov, Reed, 2010: pre-published in SSRN, Oct-10)BidQ(bid) x AskQ(ask) y100.01527 100.0331Simple formula thatwe are testing with HFdataP H x2H ( x y)H hidden liquidity’’
Bid – 1 tickBest bid (Y)Best ask (X)Ask 1 tickPrice level
New Bid- 1 tickNew Bid (Y)New askPrice level
Bid – 1 tickBest bid (Y)Best ask (X)Ask 1 tickPrice level
Level 1 QuotesQuote size depletion may be a precursor for a price move.Does imbalance predict prices?
(0, 1)Bid size increases(-1,0)(0, 0)Ask size increases(0,-1)( 1,0)
Mathematical framework: DiffusionApproximation for Quote Sizes (Level I)yt T 0X bid sizeY ask sizeX t WtYt Z tt T 1E dWt dZ t dtxA price change occurs when (i) one of the sizes vanishes and(ii) either there is a new bid or a new ask level
Probability that the Ask queue depletes before the Bid queue 1 y x 1 tan 1 x y 1 u x , y 1 2 1 tan 1 1 0 1 u x, y x tan 1 y 2u x, y xx yp x, y , H u x H , y H Probabilityof an upwardprice change.H hidden liquidity’.
Estimating hidden liquidity in differentexchanges (ability to forecast price moves)Sample 010 9:30:231/4/2010 9:30:231/4/2010 9:30:231/4/2010 9:30:241/4/2010 9:30:241/4/2010 change242 T242 T242 T271 P271 P271 PEstimated H across marketsTickerXLFQQQQJPMAAPL (s 1)AAPL (s 2)AAPL (s 3)NASDAQ 90.650.310.60.640.310.690.63
Estimation Procedure Separate the data by exchange One trading day at a time Bucket the quotes (bid size, ask size) by deciles For each bucket (i,j) compute the frequency of price increases u ij Count the number of occurrences of each bucket d ij Perform a least-squares fit with the model 1 j i 1 tan 101 j i 2H1 min d ij uij 1 H , 2 1 ij 1 1 tan 1 2
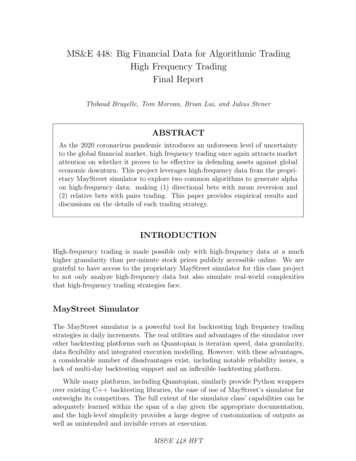
Empirical Probabilities for upward price moveconditional on the quote (XLF)
Fitted model (XLF)
Difference between empirical andfitted probabilities
Estimating hidden liquidity (H) QQQQ0.210.040.18JPM0.170.170.11AAPL (s 1)0.160.90.65AAPL (s 2)0.310.60.64AAPL (s 3)0.310.690.63Is H stable?
USD-BRL Futures (DOLc1)
Bovespa Index Futures (INDc1)
Mini Bovespa Index Futures (WINc1)
Conclusions Over 50% of all trades in the US equity markets are algorithmic. Algorithmic execution ofblock trades is an important tool allowing for systematic and disciplined execution of size The main idea is to split large orders into smaller ones according to available marketliquidity, generally following volume (TWAP, VWAP, PoV) Algorithmic trading is essential to implement quant strategies such as stat arb andETF arb With DMA and low-latency trading, we see the emergence of autonomous market-makers HFT traders provide volume but not necessarily liquidity when needed. Neitherdo the autonomous MMs (flash crash). Can we detect good liquidity’’ ? Regulation on HFT and electronic market-making is being drafted and implemented as wespeak. Recently, stub quotes were forbidden by the SEC. Other measures to regulate HFtrading will follow. Algorithmic trading, DMA, autonomous market-making and HFT are here to stay and arerapidly expanding to new markets in Asia and Latin America.
Algorithmic trading: the use of programs and computers to generate and execute (large) orders in markets with electronic access. Orders come from institutional investors, hedge funds and Wall Str