Transcription
JPL D-103137ECOsystem Spaceborne Thermal RadiometerExperiment on Space Station (ECOSTRESS) MissionLevel 2 Product User GuideVersion 218 June, 2019Glynn Hulley, Robert FreepartnerECOSTRESS Algorithm Development TeamJet Propulsion LaboratoryCalifornia Institute of Technology 2019 California Institute of Technology. Government sponsorship acknowledged.Paper copies of this document may not be current and should not be relied on for officialpurposes. The current version is in the ECOSTRESS DocuShare Library (*) at /Library-509(*) Access limited to user groupNational Aeronautics andSpace AdministrationJet Propulsion Laboratory4800 Oak Grove DrivePasadena, California 91109-8099California Institute of Technology
This research was carried out at the Jet Propulsion Laboratory, California Institute of Technology, under acontract with the National Aeronautics and Space Administration.Reference herein to any specific commercial product, process, or service by trade name, trademark,manufacturer, or otherwise, does not constitute or imply its endorsement by the United StatesGovernment or the Jet Propulsion Laboratory, California Institute of Technology. 2019. California Institute of Technology. Government sponsorship acknowledged.Note:The users' guide is designed to be a living document that describes the ECOSTRESS LandSurface Temperature and Emissivity (LST&E) product. The document describes the current stateof the art, and is revised as progress is made in the development and assessment of the LSTproduct. The primary purpose of the document is to present an overview of the ECOSTRESS L2data product to the potential user. For more detailed information on the physical basis andalgorithm details please see the Algorithm Theoretical Basis Document (ATBD).2
Change History LogRevisionEffective DatePrepared byDescription of ChangesDraft6/4/2018Glynn HulleyVersion 110/23/2018Glynn HulleyVersion 206/18/2019Glynn HulleyUser Guide first draft based onMxD21/VNP21 productsRemove bit 4 from cloud maskproduct (table 7). Other small editsand clarifications in document.Updates to account for MSU failureanomaly.3
ContactsReaders seeking additional information about this product may contact the following:Glynn C. Hulley (PI)MS 183-509Jet Propulsion Laboratory4800 Oak Grove Dr.Pasadena, CA 91109Email: glynn.hulley@jpl.nasa.govOffice: (818) 354-29794
ContentsFigures . 6Tables . 61Introduction . 71.1 File format for L2 products . 71.2 LST&E and Cloud Product . 81.3 Product Availability . 92ECOSTRESS L2 LSTE Product . 92.1 Algorithm Description . 92.2 Scientific Data Sets (SDS) . 122.3 Attributes. 132.4 Quality Assurance (QA) . 153ECOSTRESS L2 Cloud Product . 173.1 Algorithm Description and Bit Mask Interpretation . 173.2 Scientific Data Sets (SDS) . 183.3 Attributes. 184References . 195
FiguresFigure 1. Example ECOSTRESS L2 Land Surface Temperature (LST) scene over the southwestern USA generated fromsimulated data. . 9Figure 2. Schematic detailing the flow of the ECOSTRESS LST PGE within the JPL Science Data System. . 11TablesTable 1: Summary of the ECOSTRESS LST&E product. 8Table 2: ECOSTRESS input products and ancillary data required to produce the L2 LST&E product. . 11Table 3. The Scientific Data Sets (SDS) in the ECOSTRESS L2 product. . 12Table 4. Standard product metadata included in all ECOSTRESS products. . 13Table 5.Product specific metadata for the ECOSTRESS L2 product. . 14Table 6. Bit flags defined in the QC SDS in the MxD21 L2 product. (Note: Bit 0 is the least significant bit). . 15Table 7. The SDSs in the ECOSTRESS L2 Cloud product. . 18Table 8. The metadata definition in the ECOSTRESS L2 Cloud product. . 186
1 IntroductionThis is the user guide for the ECOSTRESS Level-2 Land Surface Temperature and Emissivity(LST&E) products. The L2 product uses a physics-based algorithm to dynamically retrieve boththe LST&E simultaneously for the five ECOSTRESS thermal infrared bands at a spatialresolution of 70 70 m. The algorithm is based on the ASTER Temperature EmissivitySeparation (TES) algorithm, which uses full radiative transfer simulations for the atmosphericcorrection, and an emissivity model based on the variability in the surface radiance data todynamically retrieve both LST and spectral emissivity. The TES algorithm is combined with animproved Water Vapor Scaling (WVS) atmospheric correction scheme to stabilize the retrievaland improve accuracy in hot and humid conditions. Simulations and validation results availablein the ATBD have shown consistent accuracies at the 1 K level over all land surface typesincluding vegetation, water, and deserts.The ECOSTRESS L2 product will include a swath product in standard geographic (lat, lontagged) format. The algorithms and data content of the LST&E and cloud products are brieflydescribed in this guide, with the purpose of providing a user with sufficient information about thecontent and structure of the data files to enable the user to access and use the data, in addition tounderstanding the uncertainties involved with the product and how to interpret the cloud maskinformation. Overviews of the file formats and provided first followed by descriptions of thealgorithm and product contents including all metadata. Publications and documents related to theECOSTRESS LST&E and cloud products are listed in the final section.On September 29th 2018, ECOSTRESS experienced an anomaly with its primary mass storageunit (MSU). ECOSTRESS has a primary and secondary MSU (A and B). On December 5th, theinstrument was switched to the secondary MSU and operations resumed with initial acquisitionsover Australia and wider coverage resumed on January 9th 2019. The initial anomaly wasattributed to exposure to high radiation regions, primarily over the Southern Atlantic Anomaly,and the acquisition strategy was revised to exclude these regions from future acquisitions. OnMarch 14th 2019, the secondary MSU experienced an anomaly, and acquisitions are temporarilyon hold. Work is underway to implement a direct streaming option, which will bypass the need formass storage units. The streaming acquisition mode will change the format of the data beingcollected. Specifically, the new collection mode will eliminate the 1.6 m (SWIR), 8.2 m (TIR),and 9.0 m (TIR) bands. To simplify product formats, the L1 and L2 products will continue tocontain the datasets for these bands, but the datasets will contain fill values. This will be seen inproducts generated after May 15th 2019, when the instrument resumes operations. These changesare described in the detailed product specifications.A description of the major components of the ECOSTRESS algorithm implemented in version 1of the LST&E Product Generation Executive (PGE) code are shown in Table 1 and described indepth in the ATBD available at https://ecostress.jpl.nasa.gov/products. The primary purpose ofthis document is to supply a user with sufficient information about the content and structure ofthe data files so that the users will be able to access and use the data with confidence.1.1File format for L2 productsThe ECOSTRESS LST&E and cloud products are distributed in HDF5 format and can be read inby HDF5 software. Information on Hierarchical Data Format 5 (HDF5) may be found at7
https://www.hdfgroup.org/HDF5/. The HDF format was developed by NCSA, and has beenwidely used in the scientific domain. HDF5 can store two primary types of objects: datasets andgroups. A dataset is essentially a multidimensional array of data elements, and a group is astructure for organizing objects in an HDF5 file. HDF5 was designed to address some of thelimitations of the HDF4. Using these two basic objects, one can create and store almost any kindof scientific data structure, such as images, arrays of vectors, and structured and unstructuredgrids. They can be mixed and matched in HDF5 files according to user needs. HDF5 does notlimit the size of files or the size or number of objects in a file. The scientific data results aredelivered as SDSs with local attributes including summary statistics and other information aboutthe data. More detailed information on HDF5 data types may be found in the L2 ProductSpecification Document (PSD) available at https://ecostress.jpl.nasa.gov/products.The ECOSTRESS LST&E and cloud data product files contain one set of Attributes (metadata)describing information relevant to production, archiving, user services, input products,geolocation and analysis of data, as well as provenance and Digital Object Identifier (DOI) of theproduct attached to the root group (the file). The attributes listed in Table 4 are not describedfurther in this user guide.1.2LST&E and Cloud ProductThe ECOSTRESS LST&E and cloud data products are produced in swath format, i.e. each pixelis lat/lon tagged. The image scene (swath) consists of 44 scans of the instrument mirror, witheach scan taking approximately 1.181 seconds, and each image scene taking approximately 52seconds. Each image scene starts at the beginning of the first target area encountered during eachorbit. Each orbit is defined as the equatorial crossing of an ascending International Space Station(ISS) orbit. The spatial resolution of each pixel is 70 70 m with 5632 pixels along track and5400 pixels per line for each scene. Table 1 shows a summary of the L2 product characteristics.Other data product levels briefly described: Level 1B (L1B) is a swath (scene) of measuredradiance data geolocated to latitude and longitude centers of 70m resolution pixels. A level 2(L2) product is a geophysical product retrieved from the L1B data that remains in latitude andlongitude orientation; it has not been temporally or spatially manipulated. The level 3 and 4 (L3,L4) ECOSTRESS products consist of a higher level geophysical variables output from models(evapotranspiration, evaporative stress index, water use efficiency) derived from the L2 andother ancillary data, and are output in the same latitude/longitude swath orientation.Table 1: Summary of the ECOSTRESS LST&E and cloud products.Earth Science Data onTemporalResolutionMapProjectionECOSTRESS L2 LSTEL25632 lines by5400 pixelsper line70 mSwathNone, (lat,lon tagged)ECOSTRESS L2 CLOUD8
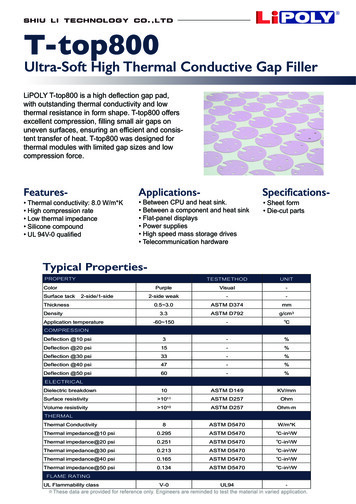
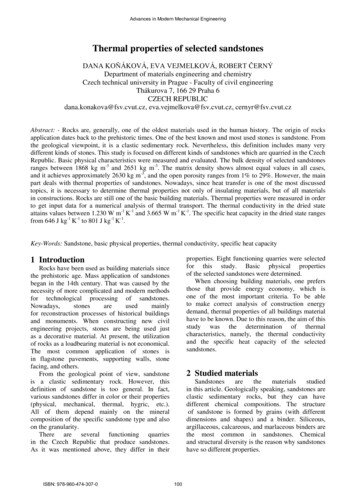
1.3Product AvailabilityThe ECOSTRESS L2 product will be made available at the NASA Land Processes DistributionActive Archive Center (LPDAAC)(https://lpdaac.usgs.gov/dataset discovery/ECOSTRESS),accessed via the Earthdata search engine (https://search.earthdata.nasa.gov/), or in the Data Pool.2 ECOSTRESS L2 LSTE Product2.1 Algorithm DescriptionFor a full detailed description of each module within the L2 PGE please see the ATBD athttps://ecostress.jpl.nasa.gov/products. The algorithm uses a physical-based Temperature andEmissivity Separation (TES) algorithm to retrieve the Land Surface Temperature and Emissivity(LST&E) products (Gillespie et al. 1998; Hulley and Hook 2011). The atmospheric correction ofthe ECOSTRESS thermal infrared (TIR) bands 1-5 are performed using the RTTOV radiativetransfer model (Matricardi 2008; Saunders et al. 1999) with input atmospheric profiles from theGEOS5 reanalysis product produced by the NASA Global Modeling and Assimilation Office(GMAO) (Rienecker et al. 2011). The GEOS5 data are provided on a 1/3 degree longitude, 1/4degree latitude spatial grid every 3 hours, with data provided in near real-time via ftp.Figure 1. ECOSTRESS L2 Land Surface Temperature (LST) scene on 4 August 2018. Cloudy pixels havebeen masked using the L2 cloud mask product and appear as white space within the scene.9
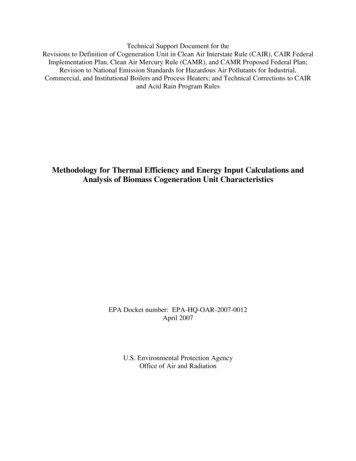
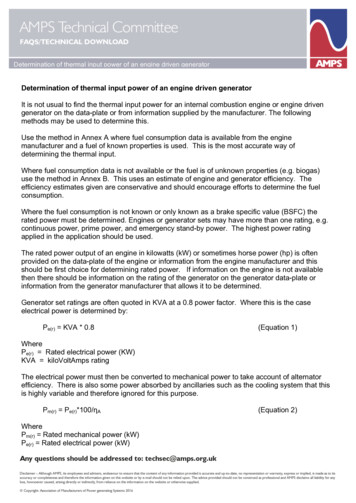
A Water Vapor Scaling (WVS) model is further employed to improve the atmospheric correctionaccuracy under conditions of heavy water vapor loadings on a pixel-by-pixel basis (Malakar andHulley 2016; Tonooka 2005). The ECOSTRESS LST&E product will be produced for allacquired ECOSTRESS scenes and for every pixel of data regardless of cloud. The L2 productalso includes a full set of error estimates for both the LST and all five emissivity bands generatedfrom an uncertainty model (Hulley et al. 2012). Figure 2 shows a schematic detailing the flow ofthe ECOSTRESS PGE within the JPL Science Data System (SDS) including the primary inputdatasets, and subprocesses.Due to the MSU failure anomalies, L2 products generated after May 15th 2019 will use a 3-bandversion of the TES algorithm with bands 2, 4 and 5. This will result in emissivity only beingproduced in those bands and the remaining bands will have fill values. The dropped bands willhave no effect on the cloud mask algorithm that only uses bands 4 and 5. The retrieved LST witha 3-band approach will also result in degraded accuracy when compared to the 5-band approach.Simulations show that total RMS errors will increase from approximately 1 K to near 1.5 K. Moredetails on these changes and uncertainty estimates are available by the science team.Data inputs to the ECOSTRESS L2 algorithm are listed in Table 2. An additional L2 cloud maskwill be provided and details of this product are shown in Table 3. Note that the L2 algorithm willrun on all pixels regardless of cloud, primarily due to the limitations of having only thermalbands available for the cloud mask detection algorithm. The result is that for certain difficult casescenarios (e.g. low warm clouds at night, cold clouds over cold surfaces such as ice/snow), thecloud mask could potentially overestimate/underestimate the clouds present in a scene. For casessuch as this the user would need to further explore the outputs from different cloud tests from thecloud mask 8-bit product detailed in section 3, and/or adapt and modify the cloud maskthresholds for their particular use case. In addition, longwave retrieved emissivity bands (e.g. 4and 5) are usually good indicators of cloud contamination. e.g. band 4 emissivity values less than0.9 should be regarded as suspect and possibly cloud contaminated in the presence of nearbycloud.The ASTER GED v3 emissivity product (Hulley et al. 2015) is used to assign the correctemissivity-dependent coefficients in the WVS model on a scene-by-scene basis. Details of thisprocedure are available in the ECOSTRESS ATBD.10
Figure 2. Schematic detailing the flow of the ECOSTRESS LST PGE within the JPL Science DataSystem.Table 2: ECOSTRESS input products and ancillary data required to produce the L2 LST&E product.Ancillary Data SetLong NameData UsedECOSTRESS L1BECOSTRESS Level-1Bcalibrated and geolocatedradiancesRadiance 1 5ECOSTRESS L1B GEOGeolocationLand/ocean maskElevationSensor and solar zenith anglesLatitude, LongitudeASTER GEDv3ASTER Global EmissivityDataset v3Emis 10.14NDVIGEOS5-FPAtmospheric reanalysisdata from the GlobalModeling and AssimilationOffice (GMAO)Pressure and geopotential heightTemperatureSpecific HumiditySurface Pressure11
2.2Scientific Data Sets (SDS)The ECOSTRESS Level-2 LST&E product contains 15 scientific data sets (SDSs): LST,LST err, QC, Emis1, Emis2, Emis3, Emis4, Emis5, Emis1 err, Emis2 err, Emis3 err,Emis4 err, Emis5 err, EmisWB, and PWV. All SDS data are output at native ECOSTRESS 70mresolution pixels. The * Err SDSs are calculated using a LST&E uncertainty simulator andincludes the maximum total uncertainty for a specific pixel based on view angle, total watervapor, and land cover type (Hulley et al. 2012b). Furthermore, a spatially and temporallyinterpolated Precipitable Water Vapor (PWV) estimate from GEOS5 data is included in the SDSas an indicator for the amount of water vapor present in the atmosphere, the primary drivingfactor for atmospheric correction uncertainty in retrieving LST&E. Details of each SDSincluding fill and scale factors are shown in Table 3.Table 3. The Scientific Data Sets (SDS) in the ECOSTRESS L2 product.SDSGroupLSTQCEmis1Emis2Emis3Emis4Emis5LST ErrEmis1 ErrEmis2 ErrEmis3 ErrEmis4 ErrEmis5 ErrEmisWBLong NameDataUnitstypeSDS (5632 lines, 5400 pixels)Land Surfaceuint16KTemperatureQuality control for uint16n/aLST and emissivityBand 1 emissivityuint8n/aBand 2 emissivityuint8n/aBand 3 emissivityuint8n/aBand 4 emissivityuint8n/aBand 5 emissivityuint8n/aLand Surfaceuint8KTemperature errorBand 1 emissivityuint16n/aerrorBand 2 emissivityuint16n/aerrorBand 3 emissivityuint16n/aerrorBand 4 emissivityuint16n/aerrorBand 5 0020.49
PWV2.3Precipitable WaterVaporuint16cm0-65535 00.0010.0AttributesArchived with the SDS are attributes (metadata) describing characteristics of the data. Contentsof these attributes were determined and written during generation of the product at JPL by theProcess Control System (PCS) and are used in archiving and populating the database at theLPDAAC to support user services. They are stored as very long character strings in parametervalue language (PVL) format. Descriptions of the attributes are given here to assist the user inunderstanding them. ECOSTRESS products consist of a set of standard metadata (Table 4) andproduct-specific metadata (Table 5). The product specific metadata in Table 5 give details onpercent cloud cover, cloud temperatures, percent good quality data, and average LST andemissivity values for the entire scene.Table 4. Standard product metadata included in all ECOSTRESS products.NameGroupTypeSize iableISSPlatformTypeStringvariableSpacecraftGroup name of ancillary file listPASS/FAIL (of productdata)NCSAHDF581.8.16ECOSTRESSECOSTRESS8L2 LSTE (L2 CLOUD)13
ariableStringvariable1Level 2 Land Surface Temperatures and Emissivity(Level 2 Cloud natePrimaryL2 LSTE (L2 CLOUD)88Table 5.Product specific metadata for the ECOSTRESS L2 product.NameGroupTypeSize ExampleL2 LSTE p.asm.inst3 3d asm Np.20140702 0000.V01Wavelengths used in the L2 retrieval for bands 1-6:1.6, 8.2, 8.7,9.0, 10.5, 12.0; 0 fill data14
2.4Quality Assurance (QA)Indicators of quality are described exclusively in the quality control (QC) SDS generated duringproduction. In addition to data quality, the QC SDS provides information on algorithm metricsfor each pixel (e.g. convergence statistics). The QC SDS unsigned 16-bit data are stored as bitflags in the SDS. This QC information can be extracted by reading the bits in the 16-bit unsignedinteger. The purpose of the QC SDS is to give the user information on algorithm results for eachpixel that can be viewed in a spatial context. The QC information tells if algorithm results werenominal, abnormal, or if other defined conditions were encountered for a pixel. The QCinformation should be used to help determine the usefulness of the LST and Emissivity data for ausers’ needs. The bit flags in the QC SDS are listed in Table 6 and consist of flags related to dataquality, cloud, TES algorithm diagnostics, and error estimates.A value for bits 1&0 00 in the QC bit flags indicates best quality, cloud-free data and generallyno further analysis of the QC bits is necessary. However, given the limitation of having thermalonly bands in the cloud mask algorithm, on some occasions false positive cloud may be detected,and for that reason the L2 retrieval runs on all pixels regardless of cloud, and the user may thenfurther inspect the cloud bit mask to tailor the results to his/her needs, or to even produce theirown cloud mask.Users may also include data of 'nominal quality' (bits 1&0 01) in their analysis, however,caution should be taken since either one of the following algorithmic conditions are met, andmore detailed analysis of other QC bits is recommended:1. The retrieved emissivity in both longwave bands 4 (10.6 micron) and 5 (12 micron) is 0.95 indicating possible cloud contamination.2. The pixel falls on a missing scan line in bands 1 and 5, in which the radiance was filledusing a spatial neural net technique (see Appendix A for more details). The user shouldcheck error estimates for this pixel to see if they fall within tolerable bounds.3. The pixel had transmissivity less than 0.4 indicating either possible cloud contaminationor high humidity, which would result in higher uncertainty in the TES retrieval. The useris encourage to check error estimates before using this pixel for science analysis.A value for bits 1&0 01 indicates cloud was detected, while a value for bits 1&0 11 indicatesthat the pixel was not produced due to poorly calibrated or missing radiance data, or the TESalgorithm failed to converge (rare).Table 6. Bit flags defined in the QC SDS in the MxD21 L2 product. (Note: Bit 0 is the least significantbit).BitsLong NameDescription1&0Mandatory QA flags00 Pixel produced, best quality01 Pixel produced, nominal quality. Either one ormore of the following conditions are met:15
1. Emissivity in both bands 4 and 5 0.95, i.e.possible cloud contamination2. Low transmissivity due to high water vaporloading ( 0.4), check PWV values and errorestimates3. Pixel falls on missing scan line in bands 1&5,and filled using spatial neural net. Check errorestimates.Recommend more detailed analysis of other QCinformation10 Pixel produced, but cloud detected11 Pixel not produced due to missing/bad data, orTES divergence, user should check data quality flagbits.3&2Data quality flag00 Good quality L1B data01 Missing stripe pixel in bands 1 and 510 not set11 Missing/bad L1B data5&4Cloud/Ocean FlagNot set. Please check ECOSTRESS GEO and CLOUDproducts for this information.7&6Iterations00 Slow convergence01 Nominal10 Nominal11 Fast9&8Atmospheric Opacity00 3 (Warm, humid air; or cold land)01 0.2 - 0.3 (Nominal value)10 0.1 - 0.2 (Nominal value)11 0.1 (Dry, or high altitude pixel)11 & 10MMD00 0.15 (Most silicate rocks)01 0.1 - 0.15 (Rocks, sand, some soils)10 0.03 - 0.1 (Mostly soils, mixed pixel)11 0.03 (Vegetation, snow, water, ice)13 & 12Emissivity accuracy00 0.02 (Poor performance)16
(Average of all bands)01 0.015 - 0.02 (Marginal performance)10 0.01 - 0.015 (Good performance)11 0.01 (Excellent performance)15 & 14LST accuracy00 2 K (Poor performance)01 1.5 - 2 K (Marginal performance)10 1 - 1.5 K (Good performance)11 1 K (Excellent performance)3 ECOSTRESS L2 Cloud ProductThe ECOSTRESS Level-2 Cloud product is output in a separate file to the LST&E product andconsists of an 8-bit flag of cloud mask and cloud tests shown in Table 7. The ECOSTRESS cloudmask is derived from the 5 calibrated thermal bands only as the SWIR band 6 used forgeolocation is uncalibrated and not suitable for cloud masking. Full details of the thermal testsand thresholds employed are available in the Cloud mask ATBD ithm Description and Bit Mask InterpretationThe ECOSTRESS cloud mask algorithm (ECOCLOUD) uses the five calibrated ECOSTRESSthermal bands in a multispectral cloud-conservative thresholding approach. The primary purposeof the uncalibrated VSWIR band 6 is for geolocation purposes and is not suitable for inclusion inthe automonous cloud detection algorithm since thresholds set would need to change from sceneto scene. However users could still use the VSWIR data to employ their own custom cloudmasks for their particular scene or use case.ECOCLOUD will use all available thermal tests currently used by the MODIS and VIIRS cloudmask algorithms. These include a threshold based on 11 micron brightness temperature, and athermal difference test based on differences between the 10.6 and 12 micron bands. All thesetests and thresholds used are detailed in the ATBD and we refer the users there for furtherdetails. Table 7 shows the data fields included in the 8 bit mask.Users can interpret the bit fields in a number of different ways depending on their specific usecase. For example:1. Read the first bit to determine if cloud mask was calculated or not. The cloud mask willnot be calculated for pixels with bad or missing radiance data.2. Read the second bit to determine if cloud was detected or not in either of tests 1-2 (1 cloud, 0 clear)3. If upon further analysis it appears that there are false positive detections, the user maytailor the final cloud mask as needed based on the outcome of cloud tests in bits 1-3.17
4. If upon further analysis it appears that there are pixels with undetected cloud, then theuser may employ their own tests using either modified thresholds, or tests not included inthe cloud mask. For this purpose a land/water mask is included in bit 4 since thresholdsmay differ depending on if the pixel is over a cooler or warmer surface. Refer to ATBDfor more details.3.2Scientific Data Sets (SDS)Table 7. The SDSs in the ECOSTRESS L2 Cloud product.Bit Field0Long NameCloud Mask FlagResult0 not determined1 determined1Final cloud plus region-growing(including region-growing by 5 pixels, andmorphological filling in ‘holes’ between clouds)0 no1 yes2Final cloud (either of bits 3 or 4 set)0 no1 yes3Band 4 brightness threshold test0 no1 yes4Band 4-5 thermal difference test0 no1 yes5land/water mask0 land1 water3.3AttributesTable 8. The metadata definition in the ECOSTRESS L2 Cloud product.NameGroupTypeSize ExampleL2 CLOUD LongFloat80.4518
4 ReferencesGillespie, A., Rokugawa, S., Matsunaga, T., Cothern, J.S., Hook, S., & Kahle, A.B. (1998). Atemperature and emissivity separation algorithm for Advanced Spaceborne Thermal Emissionand Reflection Radiometer (ASTER) images. Ieee Transactions on Geoscience and RemoteSensing, 36, 1113-1126Hulley, G.C., & Hook, S.J. (2011). Generating Consistent Land Surface Temperature andEmissivity Products Between ASTER and MODIS Data for Earth Science Research. IeeeTransactions on Geoscience and Remote Sensing, 49, 1304-1315Hulley, G.C., Hook, S.J., Abbott, E., Malakar, N., Islam, T., & Abrams, M. (2015).
Jun 18, 2019 · of the art, and is revised as progress is made in the development and assessment of the LST . (ISS) orbit. The spatial resolution of each pixel is 70 70 m with 5632 pixels along