Transcription
The Hogan RAW Assessment: Technical Manual v3Reece Akhtar, Brandon Ferrell, Dave Winsborough, & Uri OrtContents1.Conceptual Background .31.1. Employment Success .41.2. What Employers Want .41.3. An Integrative Model of Employability .51.4. Careers and Vocational Interests .62. The Hogan RAW Assessment .82.1. The Rewarding & Willing Scales .82.2. The Able Game .83. The Psychometric Properties of the Hogan RAW Assessment .103.1. Descriptive & Reliability Statistics.103.2. Distribution of RAW Scores.113.3. The RAW Dimensions .113.3.1.The Rewarding Scale .113.3.2.The Willing Scale .123.3.3.The Able Game .124. Validity .154.1. Construct Validity.154.2. Procedure & Sample .154.3. Instruments .154.4. The Construct Validity of the RAW Assessment .165. Analysis of Adverse Impact for the Hogan RAW Assessment .195.1. Defining Adverse Impact .195.2. Adverse Impact and the Hogan RAW Assessment .195.2.1.Age Differences .195.2.2.Sex Differences.205.2.3.Race/Ethnicity Differences.205.2.4.Adverse Impact Analysis in the Operational Use of the Hogan RAWAssessment .236. References .287. Appendix .311
FiguresFigure 1: The Determinants of Employability .6Figure 2: Example of the Shape Dance (Left) and Disco Number (Right) Games. .9TablesTable 1: Classical Scale Statistics for the Hogan RAW Assessment .10Table 2: Distribution of Hogan RAW Assessment Scores Across Levels .11Table 3: Intercorrelations, Descriptive Statistics & Internal Consistency Measures of theRewarding Items .11Table 4: Intercorrelations, Descriptive Statistics & Internal Consistency Measures of theWilling Items .12Table 5: Descriptive Statistics for the MindX Assessment .13Table 6: Correlations between the Gamified Assessment & Raven's Progressive Matrices.13Table 7: Correlations between the Gamified Assessment & The Hogan Business ReasoningInventory .14Table 8: Correlations between the Gamified Assessment & The International CognitiveAbility Resource .14Table 9: Intercorrelations between the Hogan RAW Assessment .16Table 10: Correlations between the Hogan RAW Assessment & the Hogan PersonalityInventory .16Table 11: Mini-Marker Correlates for the Rewarding & Willing Scales.17Table 12: Correlations between the Hogan RAW Assessment & Vocational Interests.17Table 13: Correlations between the Hogan RAW Assessment & Raven's Progressive Matrices.18Table 14: Mean Differences on the Hogan RAW Assessment by Age .20Table 15: Mean Differences on the Hogan RAW Assessment by Sex .20Table 16: Mean Differences on the Hogan RAW Assessment by Race/Ethnicity .22Table 17: Recommended Selection Decisions Rules for Using the Hogan RAW Assessment. 23Table 18: Recommended Selection Decisions Rules for Using the Three DimensionsSimultaneously .23Table 19: Selection and Adverse Impact Ratios for Using the Rewarding Scale .24Table 20: Selection and Adverse Impact Ratios for Using the Willing Scale .25Table 21: Selection and Adverse Impact Ratios for Using the Able Game .26Table 22: Selection and Adverse Impact Ratios for Using the Three DimensionsSimultaneously .27Table 23: Bivariate Correlations & Classical Scale Statistics for the Vocational InterestsInventory .312
1. Conceptual BackgroundA shift is underway in both the form of employment and the nature of the contract betweenemployers and employees, seen most easily in the rise of ‘zero hours’ contracts, the ‘gig’economy and the commodification of work via online platforms like Uber or Task Rabbit (DeStefano, 2015; Huws & Joyce, 2016). These disruptive technologies, combined with theemergence of artificial intelligence and robotics, and a long term decline in labor marketflexibility, has observers and job seekers worried that the nature of employment ispermanently changed (Molloy, Smith, Trezzi, & Wozniak, 2016). Further evidence suggestscompanies are hiring from the outside rather than growing their own talent and they areinvesting less in training (Cappelli, 2015). Although firms may complain about the difficultyin finding talent (Cappelli, 2015), the real issue is the poor job done in matching people toworkplaces and careers. The global economy is characterized by increasingly diverseemployment patterns, rising risk and uncertainty for many workers, as well as rapidlygrowing inequalities in rewards (Fuller & Stecy-Hildebrandt, 2014).The illiquidity of the labor market offers both business opportunities and the chance to helppeople avoid unemployment, especially the young, who are disproportionally impacted byeconomic cycles (Pallais, 2014). The Pulitzer Prize winning author J.R. Moeringher oncedescribed “the sadness and terror of joblessness” and called unemployment “bad for thesoul” (Lashinsky, 2012). Certainly the evidence is that unemployment, under-employmentand losing work creates a host of negative life outcomes, including long-term income losses,reduction in psychological and physical well-being, loss of psychosocial assets, socialwithdrawal, increased suicide risk, family discord, and lower levels of children's attainmentand health (Brand, 2015; Milner, Page, & LaMontagne, 2013; Roelfs, Shor, Davidson, &Schwartz, 2011). Work has benefits that extend beyond the purely economic (Fuller & StecyHildebrandt, 2014); workers derive structure, social connection, meaning, stimulation andeven enjoyment from their labors. Helping people into better careers and jobs is therefore aworthwhile endeavor.Although there are many causes of unemployment, typical analyses focus on cyclical versusstructural economic factors. Cyclical unemployment occurs when demand for goods andservices falls, which results in fewer jobs. Structural unemployment refers to a mismatchbetween the qualifications employers seek and the skills of the available labor force. Forexample, evidence suggests that both factors explain the current global trend towardincreasing underemployment and that structural unemployment has been on the rise in theUnited States for some time (Levine, 2013).While economic factors affect employment status, psychological factors associated withemployability are also known to be important (Fugate, Kinicki, & Ashforth, 2004; Hogan,Chamorro-Premuzic & Kaiser, 2013). For these reasons, finding and sustaining employmentis one of the most significant skills any adult can acquire. That is why we designed this toolas a means of understanding the likelihood of an individual succeeding or struggling ingaining employment, and to help test takers focus on jobs at which they are more likely todo well.3
1.1. Employment SuccessOrganizational psychology has had a lot to say about what it takes to do well in the world ofwork. We briefly review research showing that cognitive ability, educational attainment andpersonality interact to make some people do better at work and get ahead in their careers.The literature clearly shows that cognitive ability and personality both predict educationalperformance, which is associated with work success and job performance. For example alarge evaluation of the links between personality and income, occupational prestige, longterm unemployment, and occupational stability, concluded that personality scales predictwork-related outcomes and that the typical effect size of personality is similar to the impactof childhood socioeconomic status and IQ (Roberts, Kuncel, Shiner, Caspi, & Goldberg,2007). Similarly, Swedish economists examined the relationship of cognitive and noncognitive skills on labor market outcomes (Lindqvist, & Vestman, 2011) and found thatpersonality factors (e.g., responsibility, independence, persistence, emotional stability, andsocial skill) were, in combination, better predictors of wages, employment status, andannual earnings. Consistent with these conclusions, longitudinal research showed thatpersonality and IQ assessed in childhood each predicted occupational status in adulthood,yielding a multiple correlation of .64 (Judge, Higgins, Thoresen, & Barrick, 1999).Our point is that while macro-level economic factors impact success and failure at work, sodo individual factors. A large meta-analysis of research on career success (Ng, Eby,Sorensen, & Feldman, 2005) found that promotion, salary and career satisfaction wasdependent on two key elements: a) working hard and displaying relevant abilities and skills,and b) receiving sponsorship. The latter point is important as the conventional wisdom ofapplied psychology maintains that employers should be most interested in the degree towhich applicants possess smarts and useful personality characteristics (Baruch & Bozionelos,2011). Yet career success also depends on factors outside the control of individual actors;career success is affected by the political structure of organizations. Changes in leadershipare often accompanied by other staffing changes, and alliances can determine who getswhich job — or no job at all. The study by Ng et al. (2011) concluded that sponsorship bypowerful others was dependent on employees getting along with their managers, beingpositive and self-promoting, or in other words, their social skills. A well-designed Germanstudy found that job performance ratings are strongly predicted by the motive to get alongwith others and the motive to achieve status and power (Blickle et al., 2011). In a Dutchstudy of 315 entry level employees, occupational competence predicted income but thebest predictor of employability and career success was the ability to maintain sociallydesirable performance at work (Van der Heijde & Van der Heijden, 2006).1.2. What Employers WantIf career success depends in large measure with the employee’s ability to meet employerexpectations then it is important to understand what employers want in their employees —after all, hiring organizations ultimately decide who is employed. Surprisingly, the literatureon this is more sparse (Baruch & Bozionelos, 2011). Broadly, the modern workplace requiresworkers to have cognitive and affective skills, which employers are increasingly keen to seekstraight out of the box (Cappelli & Keller, 2014; Koenig, 2011). Below, we survey what canbe said about what employers want.4
The U.S. Department of Labor undertook a large scale study of what employers look for inprospective employees (The Secretary’s Commission on Achieving Necessary Skills, 1991).By surveying business owners, union officials, public employees, managers, and privatesector workers to determine the performance demands of modern employment, theyidentified five critical competencies sought by employers: (a) ability to identify and allocateresources; (b) ability to work with others; (c) ability to acquire and use information; (d)ability to understand complex interrelationships; and (e) ability to work with a variety oftechnologies.A comprehensive content analysis of employment adverts from the United States offersanother view of what employers look for (Hogan & Brinkmeyer, 1994). The content of over6000 job advertisements was analyzed, showing that nearly half of all jobs required goodinterpersonal skills. Social skill was vital in 71% of the jobs involving client contact, 78% ofthe jobs requiring coworker interaction, and 83% of managerial roles. The conclusion isclear: from the employers’ perspective, the single-most important characteristicdetermining employability is interpersonal skill or social competence.Looking at this matter from the perspective of what employers don’t want yields furtherinsights that underpin the previous discussion. A large-scale survey found that employerscomplain most about three kinds of worker deficiencies: (a) poor problem solving, (b) poorpersonal management, and (c) poor interpersonal skills (Bureau of National Affairs, 1988).In summary, the literature on what employers want in job candidates highlights theimportance of problem solving, social skills and being a motivated colleague. While thesemay seem to be common sense findings, the fact remains that people vary on thesedimensions, making some more attractive to employers, and others less so.1.3. An Integrative Model of EmployabilityWe characterize employability as the ability to gain and maintain a job in a formalorganization (Fugate et al., 2004). The deduction from the forgoing discussion is thatemployability is an attribution employers make about job seekers, which is based typicallyon a resume scan or interview — neither of which are very effective predictors of jobperformance (Chamorro-Premuzic & Furnham, 2010). The essential question is therefore:What determines whether a person will be perceived as having the potential to contributepositively to an organization?Job performance is primarily defined by supervisors’ ratings. In very general terms,supervisors want employees who are likeable. In addition, they favor employees who seemto learn quickly and show good judgment — and this helps explain the consistentcorrelations between cognitive ability and job performance (Kuncel, Ones, & Sackett, 2010).Supervisors also like employees who seem compliant, obedient, and conforming — and thishelps explain the consistent correlations between measures of conscientiousness and jobperformance (Chamorro-Premuzic & Furnham, 2010). These observations also account forthe positive manifold between personality, cognitive ability, educational performance, andjob performance.5
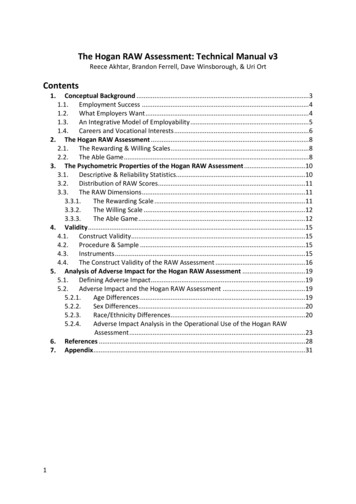
Our answer to the question of what determines a person’s level of employability will be afunction of (a) interpersonal skill (Lievens & Sackett, 2012) and perceived compatibility withthe values of the organization, team, or management (Edwards & Cable, 2009); (b) ability,know-how , and expertise (Schmidt, Hunter, & Outerbridge, 1986); and (c) ambition, drive,and work ethic (Mikulincer, Shaver, Simpson, & Dovidio, 2015). This model can be moresimply summarized using the acronym RAW (Hogan, Chamorro-Premuzic & Kaiser, 2013): aperson is more employable if they are (a) rewarding to deal with - Rewarding; (b) capable oflearning and performing the job - Able; and (c) driven and hardworking – Willing (see Figure1).Rewardingto deal withAbleEmployabilityto learn and solveproblemsWillingto work hardsocial & interpersonalcapabilityability and thinkingskillsconscientious andkeen to deliverFigure 1: The Determinants of EmployabilityImportantly, this model is compensatory. That is, employees with only average ability canstill succeed by being rewarding and productive; bright people with limited social skills maysucceed by being very productive; those who are charming, bright, and lazy will succeed asthey always do. But candidates who ‘‘tick all three boxes’’ can be expected to enjoy higherlevels of career success; candidates who are strong in two of the three areas should do well;those who are strong in only one can expect occasional unemployment; those who are weakin all three may find the world of work hard to navigate and a harsh environment.1.4. Careers and Vocational InterestsCareer success is proximally determined by the ability to gain employment in the first place– to get a foot on the career ladder. More distally, success depends on how it is defined.Salary, promotion, and individual career satisfaction represent conceptually distinct aspectsof career success (Ng et al., 2005). A person may earn a good wage or salary and yet findthemselves unhappy and unsatisfied at work; others may find work is a calling, and thatobjective indicators of success are irrelevant (Hall & Chandler, 2004). For that reason,models of job and career fit have emphasized the role of vocational interests and valueswhen predicting satisfaction and success (Ehrhart & Makransky, 2007; Holland, 1997; Stollet al., 2016). Importantly, research demonstrating the validity of interests and vocational fit6
in predicting relevant work behaviors, including job knowledge, job performance (VanIddekinge, Roth, Putka, & Lanivich, 2011).Holland’s (1997) taxonomy of vocational preferences has been the gold standard for over 40years. It provides an integrative framework that proposes that a set of six interest-basedcategories—Realistic, Investigative, Artistic, Social, Enterprising, and Conventional (RIASEC)can be used to understand work interests. Thus, all careers can be classified by preferencesfor certain types of tasks, environments and interactional styles:1. Realistic: People who have athletic or technical interests, prefer to work withobjects, machines, tools, plants and animals.2. Investigative: People who like to observe, learn, investigate, analyse, evaluate orsolve problems.3. Artistic: People who have artistic, aesthetic, and creative interests and prefer towork in unstructured environments exercising their imagination and creativity.4. Social: People who like to work with others to enlighten, inform, help, train, or curethem.5. Enterprising: People who like to influence, persuade, manage and lead others toachieve organizational or economic success.6. Conventional: People who like to work with data, carrying out tasks that requirefollowing procedures and paying attention to detail.Decades of research support the idea that people whose personality fits their workenvironments will be happier and more satisfied. It's also been shown that when switchingjobs, individuals move to environments and work that tends to suit their personality (Nauta,2010; Wille, De Fruyt, Dingemanse, & Vergauwe, 2015).Because both jobs and people can be classified with RIASEC it is possible to quicklydetermine any individual's career interests. Importantly, since RIASEC is used by the world'smost comprehensive listing of jobs, the US Department of Labor's O*Net, it becomespossible to match people to real careers and jobs. Using other data, like education level oraptitude, these matches can be refined to indicate jobs that fit their likely qualifications andaptitude. It is for these reasons that the RIASEC model complements any assessment ofemployability. It can be argued that putting the right people (those individuals with highemployability) in the right jobs (as indicated by their RIASEC preferences) will increase theirpotential to perform and be motivated at work.7
2. The Hogan RAW AssessmentGiven the economic, societal, and individual importance of employability (defined as theability to gain and maintain a job—Fugate, et al., 2004), it would be useful to have a validmethod for predicting peoples’ potential for employability, something that could be used toinform hiring and placement decisions. As described above, we identify three dimensionscontribute to peoples’ employability:1. Rewarding: Being able to get along with colleagues, having good interpersonal skills.2. Able: Being able to learn the job, developing expertise and relevant knowledge.3. Willing: Being able to work hard, and work to a high standard of performance.Individuals with high scores on all three dimensions are highly employable; individuals withlow scores on all three dimensions will have difficulty gaining and/or maintainingemployment.The following chapter describes the development of our RAW assessment. Subsequentchapters provide information regarding its psychometric reliability and validity, anddemonstrate that the assessment has no adverse impact when used in selection contexts.2.1. The Rewarding & Willing ScalesTo determine the item content for the two scales, we asked a group of Subject MatterExperts (SMEs) with advanced degrees in Industrial-Organizational Psychology to reviewSaucier's (1994) list of “mini-markers” (40 adjective markers for each of the Big Fivedimensions found in phenotypic personality description) and identify those that bestdescribe Rewarding and Willing, as defined by Hogan, et al. (2013). The SMEs convergednicely in their choices of mini-markers describing Rewarding and Willing individuals.To identify items to assess the two dimensions, we used archival data and correlated itemsfrom the Hogan Personality Inventory (Hogan & Hogan, 2007) and the Hogan DevelopmentSurvey (Hogan & Hogan, 2009) with the mini-markers. Items that correlated with theRewarding markers or the Willing markers were retained for further investigation. We usedfactor analysis to reduce the number of items; the analysis yielded a two-factor solution(Factor 1 Rewarding and Factor 2 Willing) with no cross-loading items and we retained12 items, six items for the Rewarding dimension and six for the Willing dimension. The twosix-item scales are uncorrelated. Participants respond to the items using a four point Likertscale (Strongly Agree, Agree, Disagree, Strongly Disagree), and each scale is scored bysumming the responses.Individuals with high Rewarding scores can be expected to be relaxed, easygoing andconfident, whereas people with low Rewarding scores are likely to be irritable, emotionallyvolatile and lacking self-confidence. Individuals with high Willing scores will hold themselvesto high standards, set lofty goals, and be highly disciplined. On the other hand, individualswith low Willing scores should seem disorganized, unreliable, and unconcerned about thequality of their work.2.2. The Able Game8
To assess Able, we partnered with MindX, a technology firm that creates game-basedassessments. Respondents find gamified ability assessments enjoyable (Lumsden, Edwards,Lawrence, Coyle, & Munafò, 2016).Specifically, we developed two cognitive ability games: “Shape Dance” and “DiscoNumbers”. Shape Dance is an abstract reasoning and mental rotation task. Players areshown two or more grids and must decide whether the grids are the same. The gamebecomes more difficult as players are given grids of different sizes, complexity, andorientations.Disco Numbers is a numerical reasoning and working memory game. Participants are showna sequence of numbers which they memorize and compute the sum of the sequence. Thisgame becomes more difficult as the sequences get longer and require more difficultmathematics.The participants’ goal in both games is to provide as many correct responses as possible; themaximum score in both games is 30. The average score across both games is our index ofthe Able dimension of employability. For information regarding the games’ scoring andvalidity, see Chapter 3.3.3. Finally, each game takes three minutes to complete. Participantsalso complete practice rounds to familiarize themselves with the games’ design andmechanics. Overall, the game session lasts around 10 minutes. Figure 2 are examples ofboth games at their easiest level of difficulty.When interpreting Able scores, individuals with higher scores easily solve problems, learnnew skills, and mentally manipulate information. Conversely, individuals with low scores arelikely to struggle to understand abstract concepts, to solve problems and acquire expertisequickly.Figure 2: Example of the Shape Dance (Left) and Disco Number (Right) Games.9
3. The Psychometric Properties of the Hogan RAW Assessment3.1. Descriptive & Reliability StatisticsTable 1 presents descriptive statistics for the dimensions of the RAW assessment, includingminimum and maximum observed scores, mean scores, standard deviations, skewness,kurtosis, and internal consistency, statistics1.To examine the psychometric properties of the dimensions, we obtained data from asample of 2,452 individuals. On average, participants were 36.27 years old (SD 11.88), and45.99% of the sample were male while 49.88% were female (4.13% of participants did notindicate their sex). Furthermore, 53.24% were in full-time employment, 13.37% were selfemployed, 11.55% were in part-time employment, 5.27% were students and 9.60% wereunemployed.Table 1: Classical Scale Statistics for the Hogan RAW .06.69Able.00.80.49.13-.66.70.46Note: Total N 2,452; Rewarding N 2,318; Willing N 2,312; Able 498; Min Minimumscore; Max Maximum score; M Mean; SD Standard Deviation; α Cronbach’s alpha.The Rewarding and Willing scales have a maximum score of 24; Able is scored using theaverage of correct responses across two games and has a maximum score of 1.00. As shownin Table 1, the observed scores for the Rewarding and Willing dimensions cover the entirerange of possible scores, while observed Able scores do not.These data indicate that the assessment has acceptable technical properties.1Skewness refers to departure from symmetry in a distribution of scores. When a distribution is normal andsymmetrical, skewness values are around zero. Positive skewness values indicate that most scores fall at thebottom end of a distribution, and negative skewness values indicate that most scores fall on the top end of adistribution. Skewness values greater than 1.0 or less than -1.0 generally indicate a significant departure fromsymmetry.Kurtosis refers to how peaked or flat a score distribution is relative to the normal distribution. When scores arenormally distributed, kurtosis values are around zero and we refer to them as mesokurtic. When thedistribution is sharper than the normal distribution, kurtosis values are positive and we refer to them asleptokurtic. When the distribution is broader than the normal distribution, kurtosis values are negative and werefer to them as platykurtic. Kurtosis values of more than twice the standard error indicate a significantdeparture from the normal distribution.Internal consistency is a form of reliability estimating how well variables—in this case the RAW dimensions—estimate a common attribute. When scales measure the same construct, internal consistency is high. Whenscales measure different constructs, it is low. Internal consistency is most commonly estimated usingCronbach’s alpha. Alpha estimates higher than .60 are acceptable and those higher than .70 are consideredgood.10
Although the Rewarding and Willing scales show acceptable levels of internal consistency,the internal consistency of the Able measure is low. This is not a significant problem for tworeasons. First, a principal components analysis of the proportion of wins to
personality and IQ assessed in childhood each predicted occupational status in adulthood, yielding a multiple correlation of .64 (Judge, Higgins, Thoresen, & Barrick, 1999). Our point is that while macro-leve