Transcription
PERSONNEL PSYCHOLOGY2014, 67, 313–350STAR PERFORMERS IN TWENTY-FIRST CENTURYORGANIZATIONSHERMAN AGUINISIndiana UniversityERNEST O’BOYLE JR.University of IowaWe argue that changes in the nature of work in 21st-century organizations have led to the emergence of star performers—a few individuals who contribute a disproportionate amount of output. We describehow stars negate the long-held belief that the distribution of individual performance is normal and, instead, suggest an underlying powerlaw distribution. In addition, we offer 9 propositions to guide futureempirical research on star performers and an underlying power law distribution of individual performance. We describe how the presence ofstars is likely to affect all individual-, team-, and firm-level management theories addressing individual performance directly or indirectly,but focus on specific implications for those addressing human capital,turnover, compensation, downsizing, leadership, teamwork, corporateentrepreneurship, and microfoundations of strategy. In addition, we discuss methodological considerations necessary to carry out our proposedresearch agenda. Finally, we discuss how a consideration of star performers has important implications for management practice.Since reassuming the role of Starbucks CEO in 2008, Howard Schultzhas achieved a market capitalization of 33 billion, more than 11 billionannual sales, and net annual profits of 1.7 billion (Starbucks Corporation, 2012). In a still struggling US economy where the average growth ofS&P 500 companies was .4% in 2011, Starbucks’ share price increasedby more than 40%. Thirty years earlier, a young Japanese programmernamed Shigeru Miyamoto developed a bizarre game involving a gorillaBoth authors contributed equally to this paper. We thank Frederick Morgeson and twoPersonnel Psychology anonymous reviewers for highly constructive and useful feedback.Also, we thank Adam Grant for sharing data described in Grant (in press) and Grantand Sumanth (2009). A previous version of this paper was presented at the meetings ofthe Academy of Management in Orlando, Florida (August 2013) and a much abbreviatedversion excluding figures, table, and other material was published in the 2013 Academy ofManagement Best Paper Proceedings.Correspondence and requests for reprints should be addressed to Herman Aguinis,Department of Management & Entrepreneurship, Kelley School of Business, Indiana University, 1309 E. 10th Street, Bloomington, IN 47405; haguinis@indiana.edu. C 2013 Wiley Periodicals, Inc.doi: 10.1111/peps.12054313
314PERSONNEL PSYCHOLOGYthrowing barrels for a near-bankrupt company named Nintendo. The success of Donkey Kong helped fund Nintendo’s launch of a home-gamingsystem where Miyamoto continued to work and develop some of the mostsuccessful franchises in gaming history, including Mario Brothers and theLegend of Zelda (Suellentrop, 2013). More recently, in Bangalore, India,dropout rates in the public school system were soaring due to students’malnutrition until an engineer named Shridhar Venkat overhauled the failing lunch program with a series of logistical and supply chain adaptations(Vedantam, 2012). Venkat’s continued enhancements of the program haveso significantly improved both children’s health and school attendance thatthe Bangalore Public School System is now a Harvard Business Schoolcase study.Schultz, Miyamoto, and Venkat typify star performers who consistently generate exorbitant output levels that influence the success or failureof their organizations and even society as a whole. Although their production is extraordinary, their prevalence is not (O’Boyle & Aguinis, 2012).In adddition, although it is likely that such star performers have existedthroughout history, their presence is particularly noticeable across manyindustries and organizations that make up the 21st-century workplace.They occupy roles ranging from frontline workers to top management.Moreover, their addition can signal the rise of an organization and theirdeparture can portend decline and even organizational death (Bedeian &Armenakis, 1998). We do not single out these elite performers based onsome bundle of traits or combination of ability and motivation. Rather,we conceptualize stars based on their output. What makes them special isthat their production is so clearly superior.In spite of their central role for organizational success, we do nothave a good understanding of star performers. In fact, their presence isoften treated as a data “problem” because the normal distribution cannot account for such extreme levels of productivity. Reliance on existingtheories of individual performance, which often rest on the assumptionthat performance is normally distributed (Hull, 1928; Schmidt & Hunter,1983; Tiffin, 1947), results in identifying these top performers as “anomalies” that must be fixed through data transformations or even deletion ofcases from the analysis (Aguinis, Gottfredson, & Joo, 2013). Moreover,supervisors involved in performance appraisal systems are often trainedto ignore stars and, instead, force a normal distribution on performancescores they assign to their subordinates (Motowidlo & Borman, 1977;Schneier, 1977).Situational constraints that restricted individual performance in thepast, such as geographic distances, lack of good communications, inability to access information and knowledge, and slow technological dispersion, are now being minimized by the Internet and flow of information
AGUINIS AND O’BOYLE315and knowledge around the world. The organizational hierarchy includingcontrol, command, and centralization has been replaced by an organic,web-like organizational structure (Cascio & Aguinis, 2008; Way, Lepak,Fay, & Thacker, 2010), and there is an increasing awareness that the majority of overall productivity is due to a small group of elite workers (Ready,Conger, & Hill, 2010). The result of this new organizational landscape isthat many of our theories so firmly rooted in the manufacturing sector,corporate hierarchy, and the human capital of the “necessary many” maynot apply to today’s workplace that operates globally and is driven by the“vital few.”The goal of our paper is to serve as a springboard for a research agendaon star performers. First, we define star performers based on their performance relative to others and discuss the role of time in the identification ofstars. Second, we offer a research agenda including nine research propositions to guide future empirical study of star performers. Third, we discussimplications for future theory and empirical research in several mainstream theories in the field of management and offer recommendationsregarding methodological approaches that will be instrumental regardingthe implementation of our proposed research agenda. Finally, we discussimplications of star performers and an underlying power law distributionof individual performance for management practice.Star PerformersStars are defined by their location on the production distribution. Accordingly, a star is a relative position and their identification is onlypossible by viewing them in relation to the productivity of others. In addition, time is an important element to star identification because starsare identified by their exceptional output over time and not just a singleexceptional result. The minimum amount of time required to identify astar performer is the same as the minimum amount of time needed forimportant results to be produced and observed in various organizationalcontexts. For example, the minimum amount of time that a CEO’s actions generate a stable estimate of firm financial performance is typicallyconsidered to be a quarter—and this is why the performance of CEOs isusually evaluated on a quarterly basis. As a second example, it usuallytakes 2 to 3 years for a researcher in the field of management to producea refereed journal article—and this is why many universities evaluate theperformance of their management professors based on a 2- to 3-year window. Although there are minimum time frames needed to identify starperformers, it is possible to also accumulate several such time windows toidentify star performers over longer periods of time such as the number ofcitations accumulated by researchers over 5-year windows and even over
316PERSONNEL PSYCHOLOGYtheir entire careers (e.g., Podsakoff, MacKenzie, Podsakoff, & Bachrach,2008).Finally, performance can be defined in terms of behaviors (i.e., howpeople do their work) or results (i.e., the output of people’s work). Ourdefinition of star performers is based on results, which does not considerthe traits that workers possess or how they do the job and, instead, focuseson what they produce. According to the performance management literature, a focus on results rather than behaviors is most appropriate when (a)workers are skilled in the needed behaviors, (b) behaviors and results areobviously related, and (c) there are many ways to do the job right (Aguinis, 2013). Although we readily acknowledge that for more traditionalindustries such as farming and manufacturing, which are still importantcomponents of the economy in the United States and other countries,these conditions may not fully apply, a focus on results seems appropriatefor a vast number of occupations and organizational settings in today’sknowledge-intensive economy dominated by the service industry.A practical consideration regarding the identification of star performers relates to sources of data regarding an individual’s output. This is notan issue unique to our paper but a topic that is relevant for all performancemanagement theories and practices that include a results component. Thus,there is an extensive literature that offers guidelines regarding this point(e.g., Aguinis, 2013, chapter 5; Cascio & O’Connor, 1974). Fortunately,due to today’s analytics movement as well as the sharp decrease in costof data storage technology (Davenport, Harris, & Shapiro, 2010), mostorganizations regularly collect data not only on employees but also oncustomers and many other issues. In fact, Berry and Linoff (2004) arguedthat firms are faced with the problem of too much data rather than too little.However, we readily acknowledge that it will not be possible to identifystar performers if data regarding results and outcomes are not available.Star Performers and the Performance DistributionWhen attempting to compare stars to average, or even very goodworkers, the output attributable to stars is inconsistent with what wouldbe expected using a traditional normal (i.e., bell-shaped) distribution. Forexample, in academics, where top-tier journal publication is one of themost influential antecedents to rewards such as salary and tenure (GomezMejia & Balkin, 1992), individuals whose publication record is three ormore standard deviations above the mean should be roughly .15% ofthe sample size according to a normal distribution. In other words, in asample of 10,000 academics, approximately 15 are predicted to be at orabove three standard deviations. However, O’Boyle and Aguinis (2012)found that the number of individuals above this threshold far exceeded
AGUINIS AND O’BOYLE317what would be predicted under a normal distribution. Across 54 scientificdisciplines, this star effect was found in both the natural sciences such asagriculture where a normal distribution predicted 35 academics when therewere actually 460, as well as social sciences such as clinical psychologywhere a normal distribution of performance predicted 16 individuals, butresults showed 162 academics above three standard deviations (O’Boyle &Aguinis, 2012).In challenging the prevalence of normality as a model to describe thedistribution of individual performance, several points need considering.First, normal is not the same as common or natural. This is not a new idea,and Thorndike (1913) noted that “there is nothing arbitrary or mysteriousabout variability which makes the so-called normal type of distributiona necessity, or any more rational than any other sort . . . Nature does notabhor irregular distributions” (pp. 88–89). Second, although the extantresearch typically finds and reports a normal distribution of individualperformance, most research involving individual performance uses supervisory ratings that reflect behaviors rather than results (Aguinis, 2013),and, for decades, supervisors have been trained to place workers alonga normal distribution (Motowidlo & Borman, 1977; Reilly & Smither,1985; Schneier, 1977). Finally, there is some research conceptualizingperformance in terms of results that has also shown a normal pattern.Specifically, Schmidt and Hunter compared the best and worst workers’productivity over 40 samples and concluded that, “[t]he low levels ofvariability for [the estimated population standard deviation] across jobsindirectly supports the assumption of normality of the output distribution”(Schmidt & Hunter, 1983, p. 410). However, of the 40 studies included intheir meta-analysis, 38 were conducted in the manufacturing sector.Given important changes in the economy from manufacturing toknowledge, organizations have changed from hierarchies to webs, capital has changed from land and resources to people and innovation,and work itself has changed from scripted duties to complex interactions. Accordingly, we may not be able to extrapolate the distributionof performance from 20th-century manufacturing environments to 21stcentury knowledge-based organizations. More specifically, the distribution of worker productivity seems to have changed from a normal distribution with limited variability to a distribution that allows stars to emerge(O’Boyle & Aguinis, 2012). One potential answer to the shape of production in the 21st-century workplace is a power law distribution. Althoughnormal distributions are defined by their midpoints, power law distributions are defined by their tails. Put differently, instead of a massive groupof average performers dominating production through sheer numbers, asmall group of elite performers seem to dominate production throughmassive performance.
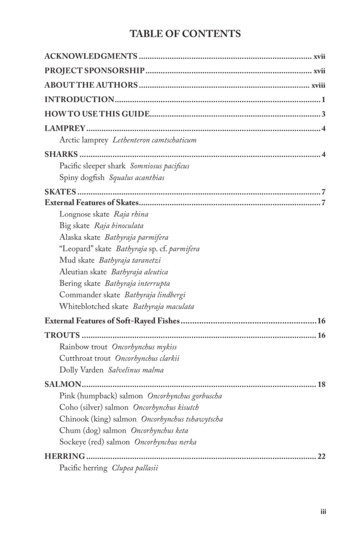
318PERSONNEL PSYCHOLOGYFigure 1: Normal Distribution Overlaying a Power Law Distribution.Power law distributions, such as the one overlaying a normal distribution in Figure 1, are found in a number of contexts such as biodiversity(Crawley & Harral, 2001), crime waves (Johnson, 2008), stock marketperformance (Gabaix, Gopikrishnan, Plerou, & Stanley, 2003), and increasingly among jobs that comprise the modern economy. For example,in entrepreneurship research, star effects are so extensive that nearly every metric of productivity including sales, profits, and growth requireslog transformations to create a distribution more aligned with theoreticaland statistical assumptions based on normality (e.g., Audretsch, Dagnino,Faraci, & Hoskisson, 2010). For scientists, inventions and innovationswhether quantified in frequency or returns on investment show a powerlaw distribution with the top decile capturing between 48% and 93%of the patents and National Science Foundation grants (Marsili, 2005;Scherer & Harhoff, 2000). In addition, sales positions and jobs withcomplex, nonscripted duties (e.g., dentists, physicians, attorneys) showextreme variances and highly skewed distributions relative to their bluecollar and low-complexity counterparts (Schmidt, Hunter, & Judiesch,1990). Even in industries where one might expect a normal distributionsuch as the military, given their emphasis on uniformity, hierarchy, andregimented activity, stars still emerge when performance is operationalized based on outcomes such as the number of downed aircraft (Toliver &Constable, 1998). Most recently, O’Boyle and Aguinis (2012) conducteda study involving 198 samples of academics, athletes, entertainers, and
AGUINIS AND O’BOYLE319politicians and found 94% of the samples better conformed to a powerlaw distribution than a normal distribution.In sum, evidence for a normal distribution of production is primarilyfound among two sources: low-complexity jobs that reflect the prominentindustries of the 20th-century workplace (Boisot & McKelvey, 2010;Schmidt et al., 1990) and samples that rely exclusively on ratings ofbehavior (as opposed to actual production or results). Alternatively, powerlaw distributions seem to best model productivity among the types ofjobs found in the sales, service, technology, research, and white-collarsectors as well as the high-complexity occupations and industries thatare increasingly dominating the 21st-century workplace. Accordingly, weoffer the following proposition:Proposition 1: In organizations that adapt to and typify the 21stcentury workplace of increased job complexity, reduced situational constraints, and flexible hierarchies,the distribution of individual performance will be better modeled by a power law compared to a normaldistribution.If star presence creates a power law distribution, their exit may eliminate it. However, if certain properties of power laws extend to individualperformance, then the shape of the distribution may remain unchangedeven if star performers leave. This is because dynamic systems, be theygenetic (Weng, Bhalla, & Iyengar, 1999), biological (Koch & Laurent,1999), ecological (Gallagher & Appenzeller, 1999), social (Barabasi &Albert, 1999; Watts, 2003), economic (Podobnik, Fu, Jagric, Grosse, &Stanley, 2006; Scheinkman & Woodford, 1994), or finance based(Andriani & McKelvey, 2009; Aoyama, Yoshikawa, Iyetomi, &Fujiwara, 2010; Arthur, 1994; Souma, et al., 2006), demonstrate a property of power laws known as scale invariance. Sometimes referred to asfourth dimension modeling or fractal geometry, the classic example isa cauliflower stalk where a branch can be cut from the stalk, a smallerbranch can be cut from the first branch, and so on. When the branchesare lined up, they all maintain the same shape and structure (Mandelbrot,1982).If the property of scale invariance extends to worker production,the shape of the performance distribution will be the same for growing, stagnant, and declining organizations. For example, consider starsin professional basketball. Michael Jordan led the Chicago Bulls to sixNational Basketball Association (NBA) championships in 8 years during which time he was named NBA’s Most Valuable Player five times.While a member of the team, the distribution of points scored conformedto a power law with Jordan at the tail of the distribution dominating
320PERSONNEL PSYCHOLOGYoffensive productivity. This is consistent with Proposition 1. But, whatmakes Michael Jordan a particularly interesting case is that he retiredtwice from the Bulls, once in 1993 and again in 1998. The effect at the organizational level following these retirements was disastrous, particularlyin 1998 when the Chicago Bulls went from winning three consecutivechampionships to becoming the worst team in their conference. However,despite the tremendous cost to organizational success and significant dropin individual player production (i.e., points per game), the right panels ofFigure 2 show that the shape of the point distributions for the 50 priorto Jordan’s retirement and 50 games after his retirement are nearly identical.1 The loss of Jordan had a profound impact on every aspect of theBulls’ performance and success, except the shape of the distribution ofindividual performance.Michael Jordan was a high-profile star that fundamentally altered theindustry he worked in, but star distributions and scale invariance maybecome increasingly common among 21st-century jobs. In the words ofBill Gates, “A great lathe operator commands several times the wage ofan average lathe operator, but a great writer of software code is worth10,000 times the price of an average software writer” (Veksler, 2010,point 2). There is empirical evidence to support Gates’ claim as the distribution of programmer performance follows a nonnormal distributionthat is consistent across task (e.g., debugging programs, writing code) andexperience (e.g., novice or experienced programmers; Curtis, Sheppard,Milliman, Borst, & Love, 1979; Darcy & Ma, 2005; DeMarco & Lister,1985; Sackman, Erikson, & Grant, 1968).As an additional example, a study involving the number of scholarlypublications produced by researchers in 178 radiology departments participating in the National Resident Matching Program found that a powerlaw distribution resulted in better-fit indexes compared to a normal distribution (Morelli & Bokhari, 2013). Moreover, results suggested scaleinvariance because a power law distribution had a better fit to the dataregardless of whether analyses were based on the total number of 14,219journal articles produced by 163 departments from 1987 to present oronly a subset of 4,252 journal articles produced by 142 departments thatappeared in the past decade only.Finally, scale invariance is also likely to be observed in jobs that require less training and credentials. For example, we gained access to performance data for call center representatives described by Grant (in press)and Grant and Sumanth (2009), and results showed that a power lawdistribution emerges whether looking at sales, revenue, or calls per hours.1Due to a player’s strike in the 1998–99 season that shortened the season to 50 games,we limit the comparison to the 50 games pre- and post-Jordan retirement.
Note. Each panel is overlaid with a normal and power law curves. Source. nba.com/statistics.Figure 2: The left panels show the points per game distribution of Chicago Bulls players in the season prior to MichaelJordan’s retirement in 1998 (top left panel) and the season following his retirement (bottom left panel). The right panels showthe total point distribution in the 50 games preceding Jordan’s retirement (top right panel) and the 50 games followingJordan’s retirement (bottom right panel). Each panel is overlaid with a normal (solid line) and power law (dashed line) curves.AGUINIS AND O’BOYLE321
322PERSONNEL PSYCHOLOGYIn sum, whether comparing the best organizations to the worst orexamining a single organization once or over time, power laws seem tostill model the individual performance distribution, and the addition orsubtraction of stars does not seem to influence its shape. Accordingly, weoffer the following proposition:Proposition 2: The addition or departure of stars will have extraordinary consequences on overall organizational productivity; but, due to scale invariance, the shape ofthe individual production distribution will continue toconform to a power law.Star Performers and the Performance-Value FunctionOur discussion thus far suggests that stars create a stable power law distribution of production that models many occupations in the 21st-centuryeconomy. This idea not only changes our conception of individual performance but also the value placed on performance at the tails of the distribution. Star performers often earn exceedingly large compensation relative toaverage workers and even workers that perform only slightly below stars.For example, there is increasing concern in both the academic literatureand popular press about the increases in CEO compensation (Cowherd &Levine, 1992; Crystal, 1991). Putting aside understandable critiques aboutgolden parachutes or disproportionate compensation relative to other organizational members (e.g., a CEO who earns hundreds of times more thanthe average worker), critics assert that, among the population of CEOs,presumed differences in performance are not large enough to justify theobserved differences in CEO compensation (Baron & Pfeffer, 1994). Putdifferently, a CEO earning 10 million a year is not 10 times better thana CEO earning 1 million. This view is grounded in the belief that thereis a linear relation between performance (i.e., individual production) andvalue (i.e., firm performance). As such, X amount more performance onlyjustifies X amount more compensation. Because performance is assumedto be normally distributed and CEO compensation is heavily skewed, theconclusion is that top CEO earners are overpaid relative to other CEOs.This is an additive model of production where incremental differences inperformance yield similarly incremental differences in value regardless oflocation in the distribution.Our conceptualization of star performers offers an alternative explanation to understand the skewed CEO compensation that has been establishedthrough market-based mechanisms. If the performance–value (P–V) function is exponential rather than linear, as shown in Figure 3’s top panel,a highly paid CEO making 100 times more than the average CEO does
AGUINIS AND O’BOYLE323Figure 3: Graphic Representations of Propositions 3 and 4.Note. The top panel shows an exponential relation between individual performance andvalue overlaying a linear relation, and the bottom panel shows that the performance–valuerelationship is moderated by the degree of a position’s proximity to an organization’sstrategic core competence.not have to perform at a level that is 100 times higher to justify theircompensation. Instead, top CEOs only need to perform slightly betterthan the next best performer. This is because at the tails, marginally lessperformance is a poor substitute for superior performance such that minordifferences in performance create dramatic differences in value (Kelley &Caplan, 1993; Lepak, Takeuchi, & Snell, 2003; Narin, 1993; Rosen, 1981).Furthermore, the complexity and dynamism of both industries and corporations in the 21st century create environments where among elites “certaintiny events get amplified into extreme outcomes” (Boisot & McKelvey,2010, p. 426).CEOs exhibit varying degrees of individual performance and are presumably matched to varying sized organizations based on said performance (Zajac, 1990). The largest organizations will recruit the top CEOs
324PERSONNEL PSYCHOLOGYand compensate them exponentially more than smaller organizations.Beyond their capacity to pay more, larger organizations compensate theirCEOs more because they have more at stake than smaller organizations.For CEOs in large corporations in the United States, compensation increased 600% between 1980 and 2003 (Gabaix & Landier, 2008). Thisrepresents many millions of dollars in pay raises for these top CEOs, butthis must be contextualized with the fact that among these same firmsthe six-fold increase in pay corresponded to a six-fold increase in marketcapitalization (Gabaix & Landier, 2008). The small differences in CEOperformance among firms at the tails yielded exponential differences invalue for the organizations that employed them.Consistent with our arguments, in industries such as entertainment andin certain occupations such as CEO, labor economics research shows anexponential P–V function (Ikeda, Aoyama, Iyetomi, Fujiwara, & Souma,2008). Moreover, it seems that nonlinear P–V functions may become thenorm as in industries and occupations beyond entertainment and CEObecause many jobs in the knowledge economy require a great deal ofinnovation and cannot be scripted as easily as those jobs in the manufacturing economy (Cascio & Aguinis, 2008). In other words, it seems that the21st-century workplace no longer restricts variance in the same manneras the 20th-century workplace, and this creates the potentiality for stars todistance themselves so greatly from the average worker in terms of valueadded (Lepak & Snell, 2002; Oldroyd & Morris, 2012). Accordingly, weexpect that many occupations in the 21st-century workplace will conformto a similar exponential relation between performance and value. For example, sales managers typically find that 80% of unit sales are attributableto 20% of their workforce (Aoyama et al., 2010). An examination acrossmultiple industries at multiple time points suggests that the P–V functionis exponential with the top decile of performers contributing an averageof 30.1% of the total production, whereas the top quartile produced inexcess of 50% (O’Boyle & Aguinis, 2012). The best performers dominateproduction, but the difference in their individual output relative to theirpeers is often small when contrasted with the differences in resulting valueto the organization (Crain & Tollison, 2002). Returning to the top panelof Figure 3, small differences at the tails of the performance distributionlikely create very large differences in value. Using conservative estimates,we propose that:Proposition 3: Within similar organizational positions, the relationbetween performance and value will follow an exponential function with approximately 30% of valuevested in the top decile of workers and 50% of valuevested in the top quartile.
AGUINIS AND O’BOYLE325Star Performers and Their Position and Work EnvironmentThe nature of the P–V relationship is likely to be moderated by a starperformer’s position and work environment. For example, a member of thehousekeeping staff in a large accounting firm might perform at a very highlevel, but star effects will be limited because although his performanceis great so is the distance between his output and organizational-leveloutcomes. All things equal, organizations should strive to staff the bestpossible people, but the tasks, duties, and responsibilities most relevantto firm-level outcomes are those that will yield the greatest star effects(Huselid, Beatty, & Becker, 2005; Oldroyd & Morris, 2012).The need to consider a star’s position and work environment is consistent with strategic core theory, which posits that the relationship betweenindividual productivity and firm performance is moderated by its proximity to core competence (Delery & Shaw, 2001). For example, Cappelliand Crocker-Hefter (1997) examined top organizations across a variety of industries (e.g., sports, consulting, retail) and found that the corecompetencies that led to competitive advantage were only possessed bya small subset of org
STAR PERFORMERS IN TWENTY-FIRST CENTURY ORGANIZATIONS HERMAN AGUINIS Indiana University ERNEST O'BOYLE JR. University of Iowa We argue that changes in the nature of work in 21st-century organi-zations have led to the emergence of star performers—a few individ-uals who contribute a disproportionate amount of output. We describe