Transcription
International Petroleum Taxationfor the Independent Petroleum Association of AmericaDavid Johnston, Daniel Johnston & Tony RogersDaniel Johnston & Co., Inc. Hancock, New HampshireJuly 4, 2008
Thank You.Chairman:Vice Chairman:Treasurer:President & CEO:Immediate Past Chairman:H.G. “Buddy” KleemeierBruce VincentDiemer TrueBarry RussellMike LinnGovernment RelationsVice President ofGovernment RelationsLee O. FullerVice President of Federal Dan NaatzResources & Political AffairsVice President ofCrude Oil & Natural GasRegulatory AffairsSusan GinsbergDirector of GovernmentRelations & Industry AffairsJoel NoyesLegislative & PAC ManagerCortney HazenLegislative AssistantRyan UllmanLegislative AssistantBrent GolleherBusiness Development, CapitalMarkets & MembershipVice President of William V. MoyerBusiness Development,Capital Markets & MembershipDirector of Member ServicesLuAnne TylerInformation Services / InternationalVice President of Economics& International AffairsFrederick LawrenceMeetingsVice President of MeetingsTina HamlinDirector of MeetingsChristin McGrathMeetings ManagerCaroline HawkinsMeetings Marketing ManagerMeetings CoordinatorJoanie RylanderNikki McDermottCommunicationsVice President of PublicAffairs & CommunicationsDirector of Public AffairsJeff EshelmanNicole DaigleStaff EditorBrendan BradleyCommunications &Administrative AssistantLindsey BlessumEducational CenterDirector of EducationEducation CoordinatorIPAA would like to extend its gratitude to David Johnston, Daniel Johnston andTony Rogers for putting this study together. IPAA continues to supplement theInternational Primer that was released in 2002 with detailed studies of particularissues of interest. IPAA has worked with the authors to provide further substance onthe chapter in the International Primer dealing with contracts, financial terms andtaxation. Follow-up IPAA international surveys over the past few years indicatedthat members were particularly interested in additional details on this importantarea. The Committee believes that this study will support our Committee’s missionof “providing educational and information services to IPAA members engaged in orinterested in international business opportunities.”IPAA would also like to thank the members of the International SteeringCommittee for their continued dedication to the issues that have been delineatedby IPAA membership. The Committee’s Chairman and Vice Chair along withSteering Committee members have generously provided their valuable time for theseprojects, which will help with planning on upcoming events such as the NAPE International Forum that are directed at internationally-oriented independent producers. Should you have comments or recommendations regarding future topics ofinterest, please do not hesitate to contact us.William D. SchneiderChairman, International Committee, IPAAVice President - InternationalNewfield Exploration Company363 North Sam Houston Parkway, EastSuite 2020Houston, TX 77060-2421Tel: (281) 847-6000Fax: (281) 405-4242Tara LewisVice Chair, International Committee, IPAAPresidentRosetta Energy Partners2911 Turtle Creek BoulevardSuite 250Dallas, TX 75219Tel: (214) 219-2998Fax: (214) 522-9531Frederick J. LawrenceStaff Liaison to International Committee andVice President of Economics & International AffairsIndependent Petroleum Association of America1201 15th Street, NWSuite 300Washington, DC 20005Tel:(202) 857-4722Fax:(202) 857-4799Email: flawrence@ipaa.orgDoris RichardsonRaul RiveraFinancial ServicesDirectorDaniel WatfordAdministrationVice President of AdministrationIT Manager and WebmasterTherese McCaffertyKirk FriedmanDisclaimer: This International Petroleum Taxation supplement has been preparedonly as a suggested guide and may not contain all of the issues that may be encountered by parties in the oil and natural gas operations. Use of the InternationalPetroleum Taxation supplement or any variations thereof shall be at the sole discretion and risk of the parties. IPAA disclaims any and all interest or liability whatsoever for loss or damages that may result from the use of this supplement.
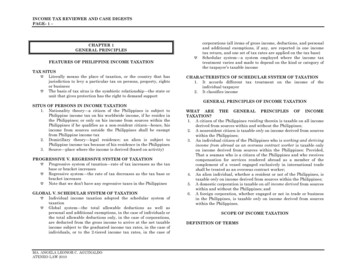
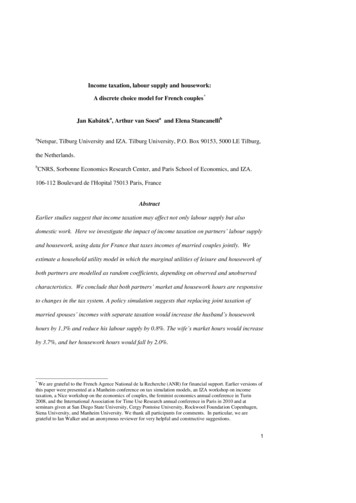
IntroductionCompared to petroleum industry in theUnited States, the international sector ischaracterized by (1) significantly greatergeopotential (than the super-matureUS basins), (2) various and diverse petroleum fiscal systems, and (3) diversemeans by which governments allocatelicense rights to IOCs. The larger fieldsize distribution overseas is attractivebut many independent oil companiesare hesitant to confront strange andcomplex fiscal systems and governmental relationships.GeopotentialAround the WorldBy any measure the US basins that areopen (unlike the Offshore along theEast Coast, Florida and California aswell as much of the Alaska Arctic) arebeyond comparison with the rest ofthe world in terms of exploration anddevelopment maturity. This is illustrated to a certain extent with a summary/comparison of drilling densityaround the world as shown in Figure1. By world standards most of the USis super-mature and field-size distributions overseas are orders-of-magnitudegreater than much of what is availabledomestically. For example, average discovery size worldwide the past 10 yearsor so has been around 100 MMBOE.Test rates per well in the various international discoveries worldwide averagearound 4,000 to 5,000 BOPD for oildiscoveries and 20-30 MMCFD for gasdiscoveries.1Licenses are also larger overseas withaverage block size of around 500,000acres. Frontier blocks are typically onthe order of 3-4 million acres or more.2Historically there have been somevery large licenses granted but generally speaking these numbers are fairlytypical.Cost of doing business is unsurprisingly higher in the international sector but with the economy-of-scale that1 Johnston D., “International ExplorationEconomics, Risk and Contract Analysis”PennWell Books, Tulsa, 20032 Johnston D., Johnston D., “InternationalPetroleum Fiscal Systems and PSCs” CourseWorkbook, 2008comes with larger discoveries the costper-barrel is often quite attractive.Political/commercial risks take ona new dimension overseas especiallywith such diverse cultural and socialdifferences that exist. Additionally, theubiquitous distrust of oil companies inthe US is also found overseas and sometimes magnified by cultural, economic,and religious dynamics.Petroleum Fiscal SystemsAround the WorldPetroleum fiscal/contractual systemsFigure rica7,0601,000or regimes around the world have formany years been classified into twomain categories.The basis of this classification is legalregarding transfer of title to hydrocarbons to the oil company. Unlike the USand Canada, the law in other countriesgrants the State title to all hydrocarbonsor mineral rights. Within the framework of various agreements betweeninternational oil companies (IOCs)and governments IOCs can sometimesobtain title to at least a portion of thehydrocarbon production. There are twomain families of agreements betweengovernments and IOCs:Recoverable Conventional OilRegionOriginal%1992 a7661United States11326Latin America1112120Russia12657Middle East5067660100%100%990United States600,20012Relative PetroleumPotential - OriginalLatin America41,88050-300Russia (FSU)148,99070Total Wells DrilledThrough 199250,000 Wells 50,000 WellsCountryCurrent producing oil wellsAverage BOPD/WellMiddle East6,2902,000-7,000Source: Grossling, B., Nielsen, D., “In Search of Oil” January, 1985. Updated and revised by the author(D. Johnston) with information from Oil & Gas Journal Energy Database, the Oil & Gas Journal WorldwideProduction Report, 27 Dec., 1993, Vol. 91, No. 52, and Oil Industry Outlook, Ninth Edition 1993-1997.1
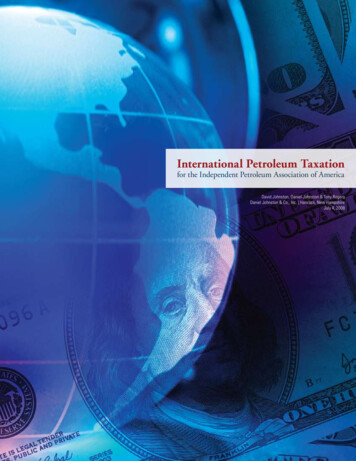
While these various categories reflectcontracts or systems of different styles,there is often substantial variation between contracts or systems within agiven category. Some systems are considered to be “hybrids” which havecharacteristics of more than one category. For example many PSCs (like thosein Indonesia, Nigeria, Malaysia, India,China and Russia) also have royaltiesand/or taxes included in their standardagreements.From a financial point of view thesimilarities can easily outweigh thedifferences between these various categories. From an economic or financialperspective the same objectives can beachieved under all systems.Concessions or LicensesRoyalty/Tax SystemsA Concession (or License) is an agreement granting an IOC or consortiumthe exclusive right to explore for andproduce hydrocarbons within a specific area (License Area or Block) for agiven time period. In exchange for theserights the IOC may have paid a signature bonus or a license fee to the HostGovernment. The Host Government’scompensation will typically includeroyalty and tax payments if hydrocarbons are produced. This type of systemis used, for example, in the US, UK,France, Norway, Australia, Russia,New Zealand, Colombia, South Africa,and Argentina. Nearly half of the countries worldwide use a concessionary (orroyalty/tax) system. Within this groupof countries there is considerable diversity with regard to various fiscal devices,royalty and tax rates, number of layersof tax and other features such as “incentives” like investment allowances andcredits.Production SharingContractsProduction sharing contracts or agreements (PSCs or PSAs) give an IOC orconsortium (known as the Contractor)the right to explore for and produce hydrocarbons within the Contract Area orBlock for a specified time period-muchthe same as a R/T license. The IOC assumes all exploration risks and costs in2exchange for a share of the oil and/orgas produced.Under this type of system, as with aLicense, if the IOC’s exploration effortsdo not yield a commercial discovery,the IOC is not reimbursed by the HostGovernment. However, in the eventof commercial discovery, productionis split between the parties accordingto formulas in the PSC that are eitherstatutory (fixed), negotiated, or securedthrough competitive bidding.Unlike a License, the HostGovernment typically receives a largeshare of oil and/or gas, which can becommercialized and monetized according to the Host Government’s development programs and economic needs.These agreements were introduced inIndonesia in the mid 1960s and formany years became the fiscal-systemof-choice for many countries. Theyare now also used in Malaysia, India,Nigeria, Angola, Trinidad, the CentralAsian Republics (of the FSU), Algeria,Egypt, Yemen, Syria, Mongolia, China,and many other countries. Slightly overhalf of the governments with hydrocarbon production worldwide use PSCs.Risk Service ContractsA Risk Service Contract is a type ofagreement whereby an IOC performsexploration and/or production servicesfor the Host Government within a specified area for a fee. At all times the HostGovernment maintains ownership ofthe hydrocarbons produced and usuallythe IOC (Contractor) does not acquireany rights to oil and or gas, except wherea Contractor is paid its fee in kind (oiland or gas) or is given a preferential rightto purchase production from the HostGovernment. Pure service agreementsare rare between an IOC and a foreigngovernment but some do exist like theIranian buy-backs, which are very similar to an engineering procurement andconstruction (EPC) contract. Othercountries that use service agreementsinclude Saudi Arabia, Philippines, andKuwait. True pure service agreementsare like those between a service company (Schlumberger or Halliburton)and an IOC.Evolution and Developmentof the IndonesianPSCs and RSAsIndonesia holds a special place in theindustry when it comes to internationalpetroleum exploration and fiscal design.In the 1960s and 1970s, Indonesia wasat the center of the international exploration industry. At that time there weremany fewer countries granting exploration rights to foreign companies thanthere are now. Back then, SoutheastAsia was one of the most active andestablished regions in the internationaloil patch. Indonesia represented nearlyhalf of that activity in terms of drillingactivity, contracts signed, and production. Almost anyone involved in international exploration in the 1970s andearly 1980s had some experience withIndonesia and the Indonesian-typecontracts.The early Indonesian PSCs wererelatively simple. The contractor couldrecover costs out of gross production(usually with some limit known as acost recovery limit). This was called“cost oil.” After cost recovery and remaining oil (known then as “equity oil”now called “profit oil”) was “shared”between the State and the contractor.Unrecovered costs would be carried forward and recovered in later periods depending on production rates and prices.Many countries followed Indonesia’slead but modified their systems to include royalties and income taxes to bepaid directly. Later Indonesia also modified their system to include taxes paiddirectly by the Contractor.Comparative AnalysisService Agreements R/T Systems - PSCsFrom a mechanical point of view thereare practically no differences betweenthe various systems. The hierarchy ofarithmetic such as (1) generation ofproduction and revenue followed by (2)royalty or royalty equivalent elements,followed by (3) cost recovery, tax deductions or reimbursement, etc. and(4) profits-based mechanisms such asprofit-oil sharing and/or taxes are for allpractical purposes found in almost allsystems.The distinguishing characteristic of
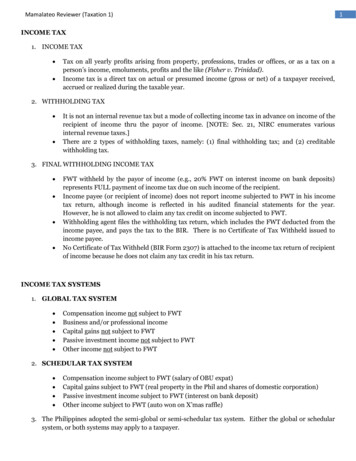
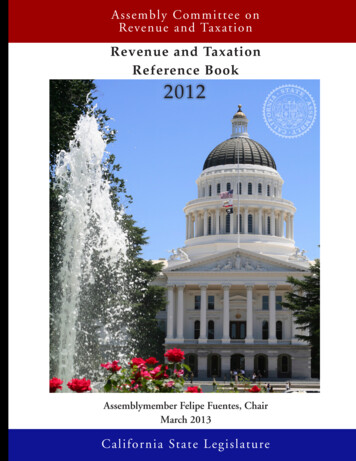
each is where, when and if ownershipof the hydrocarbons transfers to theoil company. Numerous variations andtwists are found under both the royalty/tax (concessionary) systems and thecontractual-based themes (PSCs andRSAs). The taxonomy of petroleum fiscal systems is outlined in Figure 2.Figure 2The legal classification of petroleum fiscal regimes is the most common. However, legalaspects are secondary to a nation’s philosophical attitude toward their mineral resources.Legal Classification ofPetroleum Fiscal RegimesKey DifferencesThe first branch deals with “title” to mineral resources.Royalty/Tax Systems allow title to hydrocarbons to transfer at the wellhead.Transfer of Title of Hydrocarbons With Royalty/Tax systemstitle transfers at the wellheadthe IOC takes title to grossproduction less royalty oil With PSCs title transfers atthe export point or “fiscalization point” the IOC takes titleto cost oil and profit oil With Service Agreementstitle does not transferThe philosophical differences betweenthe two main families (PSCs and R/Ts)are evident in the contract language andmanagement structure found. WithPSCs and RSAs the term “contractor”is used to represent the IOC or consortium of IOCs. The term is used in thesame context as the terms “tenant” or“sharecropper”.ContractualBased SystemsRoyalty/Tax SystemsThe primary difference here depends upon whether “reimbursement”and “remuneration” is in “cash” (Service) or in “kind” (PSC).With PSCs, title to hydrocarbons transfers at the export point.ServiceAgreementsProductionSharing ContractsUnder the Peruvian type PSC “gross production” is divided. In theIndonesian type PSC costs are recovered and “profit oil” is divided.Divided primarily upon whether remuneration is basedupon a flat fee (Pure) or profit (Risk). Some have both.There Are NumerousSimilaritiesWhile the differences between thevarious fiscal/contractual arrangementsare extremely important, they becomeeven more important when consideringwhat constitutes a modern petroleumagreement between an IOC and a hostgovernment. For all practical purposesit does not matter whether the agreement is a PSC, RSA or R/T system. Asa practical business matter the following issues must be addressed either inthe agreement itself or in the petroleumand/or tax laws and regulations of thecountry.Provisions Common to AllSystems (in one fashion or another) Initial License Area andRelinquishment Provisions Minimum Work Program andExpenditure ObligationsPeruvian TypeIndonesian TypeUnused cost oil — ”ullage”, treated as separatecategory of profit oil. Taxes “in lieu” paid by NOC.Pure ServiceHybridsRisk ServiceEgyptian TypeSource: Johnston, D., “International Exploration Economics, Risk, and Contract Analysis” PennWell Books, 2003 pg 10. Term, Termination,and Force Majeure Currency Exchange Controlsand Repatriation of Proceeds Investing Entity and ParentCompany Guarantees Fiscal Incentives andDisincentives Health, Safety and Environment Stability and Legal Statusof the Agreement Applicable Law and Forum Rules and Procedure regardingEstablishment of Commerciality Allocation of Production Measurement and Valuationof Hydrocarbons Non-Arms-length Sales Considerations for Natural Gas Communications and Language Reports and Studies Use of Infrastructure Training and Transferof Technology Importation and ImmigrationConsiderations Confidentiality Assignment of Interests Abandonment/Site RestorationProvisions and Procedures Control of Operations3
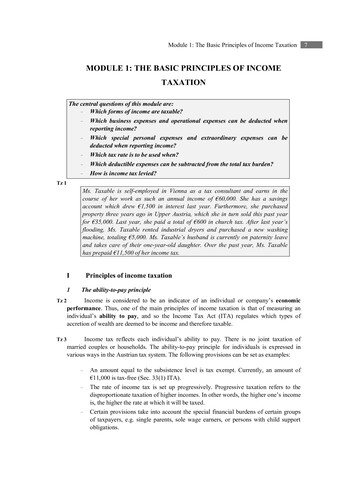
Hydrocarbons Ownershipand Ownership Transfer Ownership of Assets Dispute Resolution Mechanisms Export and Sale of ProductionWhen it comes to treatment of thesevarious elements, each of the variousapproaches can be similar althoughmany differences exist. There is no reason why there would necessarily be a bigdifference.The budget process, procurementpractices and regulations, authorization-for-expenditures, reporting requirements, auditing, and the approvalsprocess can be similar from one systemto another. Also, while there are numerous conventions for capitalizing costs(amortization and/or depreciation) suchas straight-line, unit-of-production, anddeclining-balance, for example, theseare found in many systems.Accounting AspectsDivision of Revenuesand ProfitsBasic accounting principles are virtuallyuniversal across the full range of petroleum fiscal systems. Almost all systemshave at least one “profits-based” mechanism which could include such thingsas profit oil sharing as well as specialpetroleum taxes and/or corporate income taxes. Profit-based mechanismslike these require measurement and accounting for both revenues and/or production as well as the costs associatedwith exploration, development, andoperations.The division of profits is a key aspect ofany contract. This is determined prior tocontract signing like so many elementseither through (1) competitive bidding,(2) negotiations, or (3) through statutes(by law i.e. “fixed terms”). In fact, itis usually the first thing agreed upon.While much of the discussion of the division of profits focuses on “economic”profits (gross revenues less costs associated with obtaining those revenues),timing is everything.There are four main means by whichTable 1: Fiscal System Comparison4R/T SystemPCSsRSAsType of ProjectsAll types: Exploration,Development, EORAll types: Exploration,Development, EORAll types but oftennon-explorationOwnership of FacilitiesInternational Oil CompanyGovernment NOCGovernment NOCProduction FacilitiesTitle TransferNo transfer“When landed” orupon commissioning“When landed” orupon commissioningIOC Ownership ofHydrocarbons(Lifting entitlement)Gross productionless royalty oilCost oil profit oilNone may have preferential right to purchaseRepatriation of ServiceCompany EquipmentYesYesYesIOC LiftingEntitlement (%)Typically around 90%Usually from 50-60%None (by definition)HydrocarbonTitle TransferAt the wellheadDelivery Point FiscalizationPoint or Export PointNoneFinancial ObligationContractor 100%Contractor 100%Contractor 100%GovernmentParticipationYes Not commonYes CommonYes Very CommonCost Recovery LimitNoUsuallySometimesGovernment ControlLow TypicallyHighHighIOC ControlHighLow to ModerateLowgovernments get a piece of the pie(“take”) or as it is also commonly called“rent”:1. Signature Bonuses2. Royalties3. Profits-based elements(profit oil split and/or taxes)4. Government ParticipationThe general view is that unless a government is desperately in need of upfront cash it is better off in the longrun obtaining its share of production orrevenues (or rent) with back-end-loadedelements like profit oil, taxes or government participation. While the moreregressive elements (bonuses and royalties) will ensure that some of the government’s take comes sooner (rather thanlater) the government is likely to endup with less if the system is too heavilyfront-end-loaded (i.e. regressive).Signature BonusesNearly half of all countries with hydrocarbon fiscal systems use signature bonuses as part of their system. In the US,signature bonus bidding is the meansby which the Federal Government allocates licenses. Signature bonuses usually contribute a small part of the overallgovernment take (or rent). For example,in the cash flow model in Table 2 a 40million bonus would amount to justhalf of one percent of gross revenues.In the following cash flow model andflow diagrams bonuses are not included.There are many other kinds of bonusessuch as those triggered by a discovery,or attainment of commercial status,production startup, commissioningof facilities or achievement of certainproduction thresholds such as accumulated production or specified production rates. These other bonuses arealso usually relatively insignificant butunlike a signature bonus which constitutes part of the “risk capital” the otherbonuses are part of the “reward side ofthe equation.”Signature bonuses can range fromas little as 20,000 to over 1 billion.It is difficult to estimate an “average”but there are some trends. For example,where signature bonus bidding is thesole criteria for license allocation bonuses can often be quite large. When
bonuses are not the only bid parameterthey are usually smaller i.e. less than 5MM. There are many famous bonusessuch as the 300 MM bonuses each forthe first three ultra-deepwater licenses(Blocks 31, 32 and 33) in Angola. Allother bonuses are typically contingentupon some measure of success andtherefore oil companies usually onlyhope they will be able to pay thesebonuses. Signature bonuses, becausethey are part of the risk capital, are notpopular.Government ParticipationOne unique element found outside ofNorth America is what is known as government participation (or “governmentcarry” or “government risk-free carry”).Nearly half of the governments worldwide use this option as part of their system. Typical government participationis where a national oil company (NOC)or the equivalent has the right and/oroption to take up a working interest in adiscovery if it is deemed to be commercial. It is not a popular thing with IOCsbut it is a fact-of-life. In about half ofthese arrangements the NOC will reimburse its share of “past costs” at thepoint at which it “backs-in”. Past costsinclude all costs incurred from the effective date of the agreement to the commerciality date. The other half of thecountries do not reimburse past costsbut they do allow these costs to be costrecovered and/or tax deducted (usually).Typically from the moment the NOC“backs-in” (at the commerciality point)it “pays-its-way” or is said to be “headsup” or “straight-up” just like any otherworking interest holder (except that itrepresents the Host Government).Government participation is one ofthe more dramatic elements of a fiscalsystem when it comes to such issues as:(1) control and (2) technology transfer.Being a working interest partner usually means that the NOC (if that isthe entity participating) has better access to data and information and theNOC personnel can attend OperatingCommittee Meetings and TechnicalCommittee Meetings. It is in meetingslike this where significant insight canbe gained into IOC decision makingas well as industry standards and practices. Also, NOC personnel can gainexperience. This can be especially powerful for new governments with littleexperience in the oil industry.Royalties and ProfitsBased MechanismsThe other two (of the four) main meansby which governments get a piece of thepie include royalties and profits-basedelements. These are the heart-and-soulof most arrangements between IOCsand host governments and constitutearound 90% of the rent received byhost governments around the world.The following discussion as well as flowdiagrams and cash flow model illustratewhere these elements fit in the typicalhierarchy of operations that exist whenhydrocarbons are sold, revenues aregenerated and the pie is divided. Thefollowing discussion, flow diagrams andcash flow model are all based on the following assumptions:Basic AssumptionsField Size100 MMBBLSOil Price 80/BBLCosts20% of GrossRevenues3In order to illustrate how similar the basic systems can be, this discussion compares a PSC with an R/T system whichare similar except for a few things; terminology and one mechanical aspect(the cost recovery limit).First: Gross Revenues(or Gross Production)Fiscal System AnalysisPSC R/TTerminologyTerminologyRoyalty (10%)Royalty (10%)Cost RecoveryLimit (60%)No Limit toTax DeductionsGvt. Shareof P/O (50%)First Tax (50%)Income Tax(30%)Second Layerof Tax (30%)3 This includes both capital expenditures(Capex) and operating costs (Opex) “fullcycle” i.e. over the life of the field.Fortunately the determination of grossproduction is relatively easy to measureand/or monitor. Gross revenues on theother hand can be a bit more daunting if hydrocarbons are not sold in an“arms-length” transaction. In the eventof non-arms-length sales many PSCs orR/T systems require an artificial measure of price based on a “basket” or“cocktail” of known “marker crudes”adjusted for crude quality.Second: RoyaltyIn the language of the industry, royaltiescome “right off the top.” Royalty determination can be a bit more complicatedbecause often hydrocarbons are typically not sold at the wellhead. Insteadthey are often sold downstream fromthe wellhead. So many governmentswill allow the contractor (or IOC) todeduct transportation costs associatedwith getting the hydrocarbons from thepoint-of-valuation for royalty determination purposes (the wellhead) to thepoint of sale. If the government allowsthe full range of deductions associatedwith the transportation function theywill consist of three basic components:1. Capital costs associated withthe transportation function(depreciated)2. Operating costs3. Cost of capitalNote: Neither the flow diagram northe economic model have assumed any“netbacking” or deductions for royaltydetermination purposes.Third: Cost Recoveryand/or DeductionsAfter royalty payments the IOC is allowed to “recover costs” or take taxdeductions. These costs consist of twocomponents:1. Capital costs (depreciated)2. Operating costsIt is typically this aspect of a petroleumagreement that will undergo scrutiny bygovernment auditors to ensure that onlylegitimate costs are included. Almost allsystems have specific costs that will not5
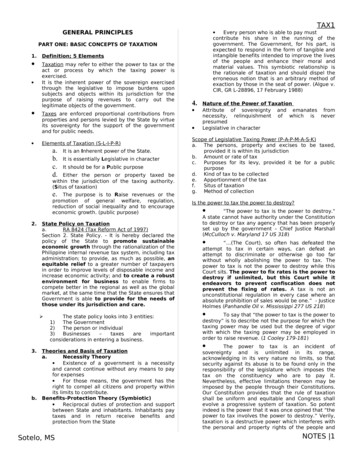
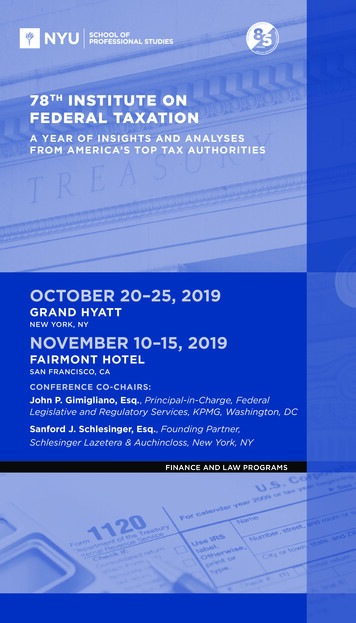
Table 2: “Typical Fiscal System” Cash Flow Projection 80.00/BBL 100 MMBBL FieldYearAnnual OilProduction(MBBLS)Oil Price( /BBL)GrossRevenues( M)Royalty10% ( M)NetRevenue( M)CapitalCosts ( M)Opex ( M)Depreciation ( M)C/R C/F( M)CostRecovery( M)ABCDEFGHIJ1- 80.00---50,000----2- 80.00---175,000----3- 80.00---275,000----41,172 11,750 01564,000610,693 40879,730 54 58 32 80.00586,56058,656527,904-51,629--51,629116,672 80.00533,76053,376480,384-49,682--49,682126,072 80.00485,76048,576437,184-47,912--47,912135,525 80.00442,00044,200397,800-46,299--46,299145,028 80.00402,24040,224362,016-44,833--44,833154,576 80.00366,08036,608329,472-43,499--43,499164,164 80.00333,12033,312299,808-42,284--42,284173,789 80.00303,12030,312272,808-41,178--41,178183,447 80.00275,76027,576248,184-40,169--40,169193,138 00,0007,200,000825,000775,000825,000100,000be allowed for cost recovery or allowedas deductions.In this example it is assumed thatcosts as a percentage of gross revenuesare 20%. A relatively typical percentagefor projects during the 1980s and 1990sworldwide was from 30 to 40%. For example with an oil price of 20.00/BBL30% comes to 6.00/BBL which wouldlikely consist of capital costs on the order of 3.00/BBL and operating costsof around 3.00/BBL. For most conventional developments during thesedecades operating costs and capitalcosts were often about equal (full cycle).Now with higher oil prices, costs haveincreased significantly. Assuming thatcosts are equal to 20% of gross revenues6with 80/BBL crude (in these examples)equates to roughly 8.00/BBL each forCapex and Opex ( 16.00/BBL total).The contractor under a PSC wouldbe reimbursed at this stage (after royalty) with oil called “cost oil”. The contractor would expect to receive cost oilduring the life of the contract. Duringthe early years of production capitalcosts would represent most of the costoil. Operating costs would be recoveredthroughout the life of the contract. Thesame is true of a R/T system but insteadof cost recovery or cost oil it would becalled deductions.The one truly significant difference between R/T systems and PSCs(mechanically speaking) is that PSCs1,600,000typically have a cost recovery limit (alsocalled cost recovery ceiling, cost stop,capped cost recovery rate, and cost cap).In the example PSC cost recovery islimited to 60% of gross revenues (i.e. acost recovery limit of 60%). If operatingcosts, and depreciation amount to morethan this in any given accounting period, the balance is carried forward andrecovered later just like a tax loss carryforward (TLCF). It simply means thereis a limit to the amount of deductionsthat can be taken in any given accounting period for the purpose of determining the profit oil split. PSCs typicallyallow virtually unlimited carry forward(C/F). From a mechanical point ofv
“In Search of Oil” January, 1985. Updated and revised by the author (D. Johnston) with information from Oil & Gas Journal Energy Database, the Oil & Gas Journal Worldwide Production Report, 27 Dec., 1993, Vol. 91, No. 52, and Oil Industry Outlook, Ninth Edition 1993-1997. Canada 40,670 3