Transcription
Skeletal 0SCIENTIFIC ARTICLEComputed tomography‑based body composition profile as a screeningtool for geriatric frailty detectionOlga Laur1 · Michael J. Weaver2 · Christopher Bridge3 · Erika Chow7 · Michael Rosenthal4 · Camden Bay7 ·Houman Javedan5 · Mitchel B. Harris6 · Bharti Khurana7Received: 6 June 2021 / Revised: 31 October 2021 / Accepted: 31 October 2021 ISS 2021AbstractObjective To assess prevalence of CT imaging-derived sarcopenia, osteoporosis, and visceral obesity in clinically frail andprefrail patients and determine their association with the diagnosis of frailty.Materials and methods This cross-sectional study was constructed using our institution’s pelvic trauma registry and ambulatory database registry. The study included all elderly pelvic trauma patients and ambulatory outpatients between May 2016and March 2020 who had a comprehensive geriatric assessment and CT abdomen/pelvis within 1 year from the date of theassessment. Patients were dichotomized in prefrail or frail groups. The study excluded patients with history of metastaticdisease or malignancy requiring chemotherapy.Results The study cohort consisted of 151 elderly female and 65 male patients. Each gender population was subdividedinto frail (114 female [75%], 51 male [78%]) and prefrail (37 female [25%], 14 male [22%]) patients. CT-imaging-deriveddiagnosis of osteoporosis (odds ratio, 2.5; 95% CI: 1.2–5.5) and sarcopenia (odds ratio, 2.6; 95% CI: 1.2–5.6) were associated with frailty in females, but did not reach statistical significance in males. BMI and subcutaneous adipose tissue at L3level were statistically lower in the frail male group compared to the prefrail group. BMI showed strong correlation with thesubcutaneous area at the L3 level in both genders (Spearman’s coefficient of 0.8, p 0.001). Hypoalbuminemia and visceralobesity were not associated with frailty in either gender.Conclusion This proof-of-concept study demonstrates the feasibility of using CT-derived body-composition parameters asa screening tool for frailty, which can offer an opportunity for early medical intervention.Keywords Frailty · Body composition · Machine learning* Olga Laurolgaolaur@gmail.com1Department of Radiology, New York Presbyterian Hospital,Weill Cornell Medicine, 525 East 68(th) Street, New York,NY 10065, USA2Department of Orthopedic Surgery, Brigham and Women’sHospital, Boston, MA, USA3MGH & BWH Center for Clinical Data Science, Boston,MA, USA4Department of Radiology, Dana Farber Cancer Institute,Boston, MA, USA5Division of Aging, Department of Medicine, Brighamand Women’s Hospital, Boston, MA, USA6Department of Orthopedics, Massachusetts General Hospital,Boston, MA, USA7Department of Radiology, Division of Emergency Radiology,Brigham and Women’s Hospital, Boston, MA, USAIntroductionFrailty represents a dynamic multidimensional syndromeor state characterized by increased vulnerability to outsidestressors secondary to aging-related degeneration of physiologic reserve and psychologic and social functioning [1].Frailty approximates patient’s biologic age—an active rateat which body is aging—which may be more relevant to theclinical practice compared to the chronological age. Frailpatients display increased vulnerability to adverse healthoutcomes, which have been shown to be independent ofage, comorbidity, and disability [2–5]. Frailty comes at ahigh cost to society, as frail patients are at increased riskof fractures, more likely to be discharged to a skilled nursing facility, more likely to be readmitted within 30 days,and have higher rates of postoperative mortality and complications compared to their robust elderly peers [6–11].13Vol.:(0123456789)
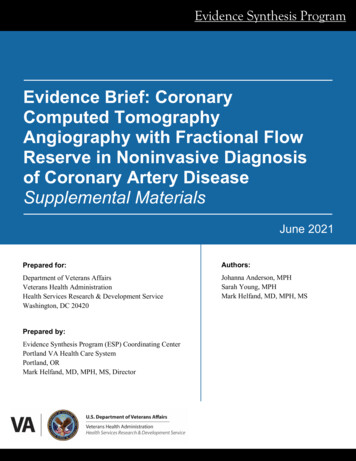
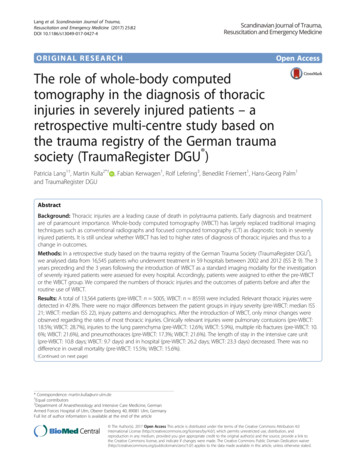
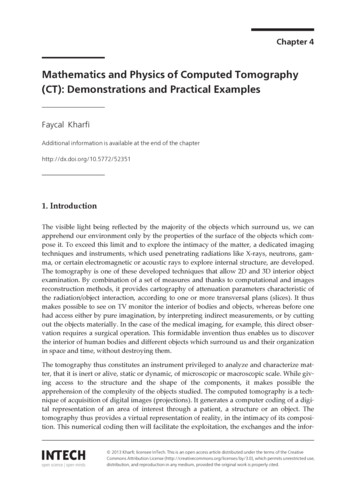
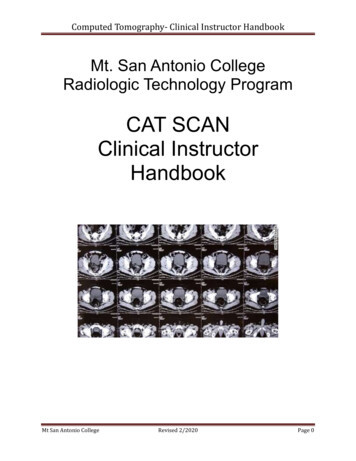
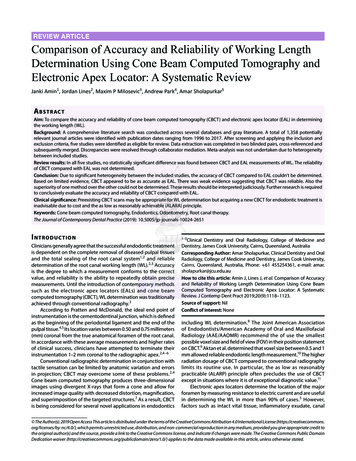
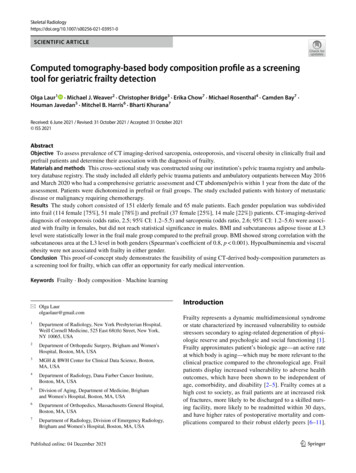
Skeletal RadiologyAccording to the United States Census Bureau, 1 in every 5Americans is projected to be older than 65 by the year 2030,with recent meta-analysis demonstrating the prevalence offrailty up to 18% in this age group and a significant increasein prevalence among those older than 85 years, especiallyin non-community dwelling older adults [12, 13]. Concurrently, the American College of Surgeons’ national traumadatabank has reported that adults of age 65 and older constitute 30.75% of all trauma-related incidents evaluated inthe emergency department by the surgical team [14]. Falls,which commonly occur with frailty, represented the mostcommon mechanism of injury, with the incidence increasingwith age. This evidence suggests that frailty is common andits prompt diagnosis is necessary for prevention of adverseevents and appropriate clinical management.Assessment of frailty has traditionally been accomplishedvia a comprehensive geriatric assessment [1, 15]. Duringthis assessment, patients are queried on how they move,function, think, medication use, and social support, amongother factors. At the end of the assessment, frailty status canbe determined by a more qualitative clinical frailty score(CFS) or a more quantitative and precise frailty index (FI)score, which recently entered clinical practice [15, 16].Currently, frailty is underdiagnosed [5]. Lack of time is amajor barrier to frailty screening, particularly at the frontlineof healthcare such as busy emergency department or primarycare physicians office with a heavy patient load [17]. Accessto a dedicated geriatric specialist represents another limitingfactor. Additionally, elderly patients are often considered tobe “difficult” interviewers secondary to a variety of factorssuch as deafness or dementia. Often, additional corroborative information from the relatives and caretakers is necessary to make an accurate assessment.Abdominal CT imaging may provide valuable insightsinto patients’ body composition by assessing the characteristics of the muscle, adipose tissue, and bone. These factorsmay represent surrogate markers of frailty, with prior studiesshowing osteopenia and sarcopenia being associated with ahigher risk of mortality in elderly patients, although theirfrailty status was not assessed by a comprehensive geriatric evaluation [18, 19]. If feasible, automated flagging ofpatients at risk of frailty provides multiple inherent advantages because it may be achieved in an instantaneous manner, does not rely on patient interviewing, and uses information obtained from an already existing study at no extra costto society.To our knowledge, this is the first study assessing CTderived imaging parameters of the adipose tissue, muscle, and bone in patients who had a clinical diagnosis offrailty or prefrailty assigned after a comprehensive geriatricassessment with a dedicated full physical exam and comprehensive history taking, which represents gold standardin frailty assessment as opposed to simplified questionnaires13or retrospective chart review for frailty approximation. Ourprimary objective was to assess prevalence of CT imaging-derived sarcopenia, osteoporosis, and visceral obesityin clinically frail and prefrail patients and determine theirassociation with the clinical diagnosis of frailty. We hypothesized that frail patients had a readily recognizable imaging phenotype characterized by osteopenia, sarcopenia, andvisceral obesity.Materials and methodsThis retrospective study was approved by the institutionalreview board and compliant with the Health Insurance Portability and Accountability Act. This study was not supportedby the industry.Study design and human subjectsIn our analysis, men and women underwent an independent cohort analysis given known differences in their bodycomposition [20]. Subject baseline characteristics weredescribed separately for prefrail and frail groups. CT imaging was processed by an automated machine-learning modeldeveloped at our institution, which determined the totalcross-sectional area of the muscle, visceral, and subcutaneous adipose tissue at third lumbar vertebral level (L3) foreach patient (Fig. 1) [21, 22]. Briefly, the machine learningmodel by Bridge et al. auto-segmented body compositionparameters at L3 vertebral level by utilizing a 2-step processusing a DenseNet convolutional neural network to select theappropriate CT slice, followed by U-Net convolutional neural network to perform segmentation. This model automatically analyzed aforementioned body composition parametersin a fraction of a second, which would be impossible withmanual segmentation. Of note, vertebral body attenuationof L3 was measured manually as it was not automated yet atthe time of data collection.Data sourceUsing our institution’s trauma registry, we identified 211consecutive patients of 65 years or older who were admitted with pelvic fractures between May 2016 and October2019. In addition, we queried the institutional database registry from August 2016 to March 2020 for all ambulatorypatients who had the “clinical frailty scale” phrase presentin their ambulatory report and had CT imaging in theirrecord. Two hundred sixteen patients constituted the finalcohort (102 trauma patients and 114 ambulatory patients)(Fig. 2). Inclusion criteria for both cohorts included comprehensive geriatric assessment and CT abdomen/pelvis imaging performed within 1 year from the time of the geriatric
Skeletal RadiologyFig. 1 a Axial CT imaging sliceat L3 vertebral level taken froma CT abdomen-pelvis with bcorresponding color-coded totalcross-sectional area of the muscle (red), visceral (yellow), andsubcutaneous (green) adiposetissue which was determined bythe automated machine learningsegmentation model developedat our institutionFig. 2 Study participant flow diagramevaluation regardless of the indication. Exclusion criteriaincluded history of metastatic disease or active malignancyrequiring chemotherapy, suboptimal automated body composition quantification as determined by manual review (forexample, an arm overlying the abdominal wall with a prominent streak artifact). Patients with an overlap between traumaand ambulatory cohorts were counted only once.The Canadian Study on Health and Aging (CSHA) Clinical Frailty Scale (CFS) was assigned to all patients by boardcertified geriatric medicine physicians in our institution.Briefly, determination of patient’s frailty state was based onthe reviewer’s clinical judgment upon completion of a comprehensive geriatric assessment, which among other factorsassessed patient’s movement status, function, thought process, medication use, social history, and personal assessmentof health, with frequent corroborative information from therelatives and caretakers. The Clinical Frailty Scale (CFS)was used to assess patient’s clinical frailty status until 201813
Skeletal Radiologyat our institution. CFS represented a qualitative approachof summarizing the key points of comprehensive geriatricassessment and was primarily based on the deficits in thefunctional category of activities of daily living (ADLs) andinstrumental activities of daily living (IADLs). Starting year2018, CSF has been replaced by the frailty index (FI) scoreat our institution, which instead of qualitative assessmentprovided quantitative measurement of all of the patient’sdeficits and believed to be the best tool in relaying patient’sfrailty status [15]. In these instances, the numeric value ofFI score was converted to CFS using established conversion criteria [23]. Using CFS, patients were stratified intothe well, prefrail, mild, moderate, and severely frail groups(Fig. 2). When dichotomizing groups, well and prefrailpatients were grouped into prefrail group, and the rest ofthe patients were grouped into the frail group.Data extractionThe electronic medical record was reviewed for demographic information, including age, sex, and race, as wellas biometric and laboratory parameters such as height,weight, BMI, and albumin level. Race of 17 patients (7.8%)as well as albumin level for 1 patient (0.4%) was unavailable for review. Albumin level of 3.5 mg/dL was considered to represent hypoalbuminemia [24]. Other indicatorsfor the trauma cohort (n 102, 47.2%) including injuryseverity score (ISS), total hospital days, total ICU days,and discharge site were extracted from the trauma registry.The degree of medical complexity was evaluated using theCharlson comorbidity index (CCI). Expired patients wereidentified via medical record review and 1-year mortalityfrom the time of injury was recorded.Exposure variablesSarcopeniaThe automated cross-sectional muscle area measurementat the L3 vertebral level contained psoas, paraspinal, andabdominal wall muscles. Skeletal muscle index (SMI) wasdefined as a total cross-sectional muscle area at the L3 vertebral level divided by patient’s height2 (cm2/m2). Based onprior literature, sarcopenia cutoffs in men and women weredetermined to be 53.0 cm2/m2 for men with BMI 25.0 kg/m2, 43 cm2/m2 for men with BMI 25.0 kg/m2, and 41.0 cm2/m2 for women regardless of BMI [25].occurred at the adjacent lumbar level). This was done by twoparticipating radiology residents and one radiologist whowere blinded to the results of frailty scoring. A threshold ofbone attenuation 90 HU was chosen to define osteoporosis[26].Visceral obesityAll patients were classified into four BMI groups basedon the Center for Disease Control guidelines: underweight(BMI 18.5 kg/m2), normal (BMI 18.5 and 25.0 kg/m 2), overweight (BMI 25.0–29.9 kg/m 2), and obese(BMI 30 kg/m 2). Visceral adipose tissue (VAT) wasdefined as an automated measurement of the adipose tissue area at L3 vertebral level and included adipose tissuebeneath the abdominal wall. Subcutaneous adipose tissue(SAT) was defined as an automated measurement of theabdominal wall adipose tissue area at the L3 vertebral level.Visceral obesity ratio (VOR) was measured as a ratio ofVAT over SAT. Additionally, visceral obesity was assessedby determining cross-sectional area at L3 level with visceralobesity cutoff 130 cm2 in men, and 110 cm2 in women[27–29].Statistical analysisOrdinal or nominal variables were presented as absolutenumbers with percentages of the total. Non-parametric datawere presented as median with inter quartile range. L3 vertebral body HU, SMI, VAT, and SAT were presented continuously and dichotomously as osteoporosis, sarcopenia, andvisceral obesity based on previously published body composition imaging marker cutoffs. Pearson χ2 test or Fisherexact test were used for categorical comparisons, as appropriate. Wilcoxon rank sum test was used for continuous variables. Two-tailed Spearman correlation was used for correlation analysis. To evaluate association with CT-derived bodycomposition markers with frailty, univariate logistic regression analyses were performed, with osteoporosis, sarcopenia, hypoalbuminemia, and visceral obesity as dependentvariables and frailty as independent variable. Binary logisticregression was performed for age and cohort status adjustment (trauma vs. ambulatory). Odds ratios (ORs) and 95%CI were provided. SPSS version 23.0 (SPSS Inc., Chicago,IL, USA) was used for all statistical analysis.Outcome measuresOsteoporosisA 1.5–2 cm2 region of interest was drawn manually overtrabecular bone at L3 vertebral level (in 6 cases (2.8%) ofcompression deformity or hemangioma, the measurement13Primary Outcome: To determine CT-imaging derived prevalence of sarcopenia, osteoporosis and visceral obesity in frailgeriatric patient group compared to the prefrail group andto assess their association with clinical diagnosis of frailty.
Skeletal RadiologySecondary Outcome: To determine prevalence of hypoalbuminemia in frail geriatric patient group compared to theprefrail group and to assess its association with clinical diagnosis of frailty.Otherwise, no statistically significant difference was identified in terms of demographic features or trauma-relatedcharacteristics in the prefrail and frail groups among bothgenders.ResultsFemale CT‑derived body compositionand anthropomorphic data—frail vs. prefrailBaseline characteristics of the study cohortThe study included 151 female and 65 male patients. Bothgenders were classified as frail (114 female patients [75%],51 male patients [78%]) or prefrail (37 female patients[25%], 14 male patients [22%]) (Fig. 2). There was a statistically higher rate of mortality at 1 year in frail patientscompared to prefrail patients (1 prefrail patient [2%] vs. 23frail patients [14%], p 0.019).Both frail female (years median, IQR 78.0 (71.5–83.5)in prefrail vs 84.0 (76.0–89.0) in frail group, p 0.004) andfrail male patients (years median, IQR 76.0 (72.8–82.0) inprefrail vs 82.0 (77.0–88.0) in frail group, p 0.03) wereslightly older compared to their respective prefrail groups(Table 1). The trauma subset of the female frail patient groupalso had higher CCI score (CCI score, IQR 4.0 (3.0–5.5)in prefrail vs. 6.0 (5.0–7.0) in frail group, p 0.001).Table 1 Demographic, laboratory, and CT-derived body compositioncharacteristics of prefrail and frail patients stratified by gender. Baseline characteristics labeled with * represent trauma cohort data onlyCharacteristicFemaleBaseline characteristics (n, median(IQR))Prefrail (N 37)Age, y78.0 (71.5–83.5)Race (white) (n, %)27 (75.0)Less than 60 days between geriatric 26 (70.3)evaluation and CT imaging (n, %)Injury severity score*13.0 (8.5–18.0)Total hospital days*5.0 (3.0–6.5)Total ICU days*2.0 (0.0–3.5)Charlson comorbidity index (CCI)* 4.0 (3.0–5.5)Discharge to home (n, %)*4 (19.0)Albumin (mg/dL)4.0 (3.2–4.3)BMI25.8 (22.7–28.4)Proportion of obese or underweight 7 (18.9)patients based on BMI (n, %)CT-derived body composition characteristicsL3 vertebra attenuation (HU)99.0 (76.0–127.0)Skeletal muscle index (SMI), cm/m2 41.6 (35.2–45.5)Visceral adipose tissue (VAT), cm2 118.6 (56.5–152.1)Subcutaneous adipose tissue (SAT), 205.0 (160.9–264.8) cm2Visceral obesity ratio (VOR)0.49 (0.27–0.73)Frail female patients had a statistically significant lower boneattenuation compared to the prefrail group (HU median, IQR99.0 (76.0–127.0) in prefrail vs 75.0 (48.5–121.3) in frailpatients p 0.03) (Table 1). BMI, skeletal muscle index(SMI), visceral adipose tissue (VAT), subcutaneous adiposetissue (SAT), or albumin levels did not show statistically significant difference between groups. When body compositionimaging parameters were dichotomized into groups of CTderived imaging diagnosis of osteoporosis, sarcopenia, andvisceral obesity, patients with osteoporosis (odds ratio, 2.5;95% CI, 1.2–5.5) and patients with sarcopenia (odds ratio,2.6; 95% CI, 1.2–5.6) had a statistically significant association with frailty (Table 2). The strength of the relationshipbetween osteoporosis and frailty persisted in females aftermultivariate adjustment (odds ratio, 3.1; 95% CI, 1.2–7.8).The strength of the relationship between sarcopenia andfrailty decreased slightly following multivariate adjustment(n 102, 47.2%; prefrail women n 21, frail women n 51; prefrailmen 9, frail men 21)P value MaleFrail (N 114)p valuePrefrail (N 14)Frail (N 51)84.0 (76.0–89.0)78 (76.0)76 (66.7)0.0041.00.8476.0 (72.8–82.0)13 (92.8)11 (78.6)82.0 (77.0–88.0)36(78.3)36 (70.6)0.030.430.8013.0(9.0–17.0)5.0 (4.0–7.0)3.0 (0.0–4.0)6.0 (5.0–7.0)3 (5.9)3.7(3.2–4.2)23.9(20.7–27.8)36 (31.6)0.700.480.310.0010.180.150.180.28.0 (4.5–19.5)6.0 (5.5–8.0)1.0 (0–3.0)5.0 (3.5–6.5)1 (11.1)4.1 (3.4–4.2)27.1 (25.5–27.9)2 (14.2%)10.0 (4.0–17.0)7.0 (3.5–10.0)3.0 (0–6.0)6.0 (4.5–7.0)0 (0.0)3.7 (3.0–4.2)24.0 (21.5–26.4)10 (19.6%)0.790.820.350.260.300.340.010.8375.0 (48.5–121.3)37.0 (32.3–42.8)91.4 (52.6–172.9)203.7 (129.3–302.3)0.030.060.580.63122.5 (92.5–140.3)47.1 (42.9–51.4)192.7 (133.1–302.8)188.8 (133.0–221.5)97.0 (67.0–137.0)42.3 (38.1–49.5)155.9 (74.3–280.4)137.1 (102.7–175.9)0.150.070.350.010.51 (0.33–0.66)0.850.97 (0.70–1.60)1.22 (0.74–1.77)0.5413
Skeletal RadiologyTable 2 Gender stratified odds ratio of the clinical diagnosis of frailtyin relation to CT-derived body composition imaging diagnosis ofosteoporosis, sarcopenia, and visceral obesity as well as laboratoryCT-derived and laboratorybody composition variablePrefrail (N, %)Frail (N, %)FemaleOsteoporosisSarcopeniaVisceral sceral obesityHypoalbuminemiaPrefrail (N 37)13 (35.1)16 (43.2)20 (54.1)11 (30.6)Prefrail (N 14)3 (21.4)9 (64.3)11 (78.6)4 (28.6)Frail (N 114)66 (57.9)76 (66.7)44 (38.6)49(43.0)Frail (N 51)22 (43.1)32 (62.7)29 (56.9)21 (42.0)Univariate OR (95% CI)p valueMultivariate OR (95% CI)p value2.5 (1.2–5.5)2.6 (1.2–5.6)0.5 (0.3–1.1)1.7 (0.8–3.8)0.020.010.100.193.1 (1.2–7.8)2.4 (1.0–5.5)0.6 (0.3–1.3)2.2 (0.9–5.5)0.020.040.181.002.8 (0.7–11.2)0.9 (0.3–3.2)0.4 (0.1–1.5)1.8 (0.50–6.6)0.140.920.140.364.1 (0.9–19.3)0.9 (0.2–3.3)0.3 (0.1–1.5)3.8 (0.7–19.4)0.080.850.150.11but remained statistically significant (odds ratio, 2.4; 95%CI, 1.0–5.5).CT-derived imaging diagnosis of visceral obesity showedno statistically significant association with frailty. Visceralobesity ratio (VOR) demonstrated predominance of subcutaneous over visceral adipose tissue in females in both prefrail and frail groups (VOR median, IQR 0.49 (0.27–0.73)in prefrail vs. 0.51 (IQR 0.33–0.66) in frail patients, p 0.9).Correlation analysis between CT-derived body compositionparameters, laboratory albumin levels, and BMI demonstrated strong correlation between BMI and SAT (r 0.82,p 0.001), and moderate correlation between BMI and VAT(r 0.69, p 0.001) and between VAT and SAT (r 0.67,p 0.001) (Table 3).Male CT‑derived body compositionand anthropomorphic data—frail vs. prefrailFrail male patients had a statistically significant lowerBMI compared to the prefrail group (BMI median, IQR24.0 (21.5–26.4) in frail vs. 27.1 (25.5–27.9) in prefrailgroup, p 0.009), as well as lower subcutaneous adiposetissue (SAT) (SAT median, IQR 137.1 (102.7–175.9) cm2in frail group vs. 188.8 (144.0–221.5) cm2 in prefrail group,p 0.01) (Table 1). Bone attenuation, SMI, and VAT didnot show statistically significant difference between thesegroups. Dichotomization of CT-derived body compositionparameters into groups of imaging-derived diagnosis ofosteoporosis, sarcopenia, and visceral obesity showed nostatistical association with frailty (Table 2).Visceral obesity ratio (VOR) in males demonstrated similar to higher visceral to subcutaneous adipose tissue ratioin in both groups (VOR median, IQR 1.22 (0.74–1.77) infrail vs. 0.97 (0.70–1.60) in prefrail patients, p 0.5), whichwas in contrast to females. Correlation analysis between CTderived body composition parameters, laboratory albumin13diagnosis of hypoalbuminemia in univariate analysis and multivariateanalysis adjusted by age and type of cohort (ambulatory vs. trauma)levels, and BMI demonstrated strong correlation betweenBMI and SAT (r 0.78, p 0.001), and moderate correlationbetween BMI and VAT (r 0.67, p 0.001) as well as VATand SAT (r 0.68, p 0.001) (Table 3).Female and male laboratory albumin levels—frailvs. prefrailAlbumin levels did not show statistically significant difference between female or male prefrail and frail groups(Table 1). Hypoalbuminemia showed no statistically significant association with frailty (Table 2).DiscussionIt has been well known that sarcopenia and osteoporosis,as determined by traditional methods of dual-energy X-rayabsorptiometry, are prevalent in frail patients [30–33]. Toour knowledge, this is the first study to date to assess CTderived body composition profile in patients with a clinicaldiagnosis of frailty or prefrailty as determined by a comprehensive geriatric assessment. Our results demonstratedthat osteoporosis and sarcopenia, as determined by CTderived body composition analysis, were common in bothgenders and might be able to discern frail patients fromprefrail patients, especially in females where the relationship between frailty and sarcopenia or osteoporosis reachedstatistical significance. These relationships did not reachstatistical significance in males, most likely due to a smallercohort size. Interestingly, although visceral obesity was notassociated with frailty in both groups, BMI and subcutaneous adipose tissue at L3 level were statistically significantlylower in male frail group compared to the prefrail group, andBMI showed strong correlation with subcutaneous area atL3 level in both genders.
Skeletal RadiologyTable 3 Correlation table between CT-derived body composition parameters and laboratory albumin measurement stratified by gender. Asterisk(*) represents statistically significant association with p 0.05FemaleL3 HUSMIAlbuminVATSATBMIL3 3 HUSMIAlbuminVisceralSubcutaneouareas areaBMIL3 4*0.060.68*BMI0.180.59*0.29*0.67*Assessment of frailty is important for both clinical and health care policy-making purposes. In trauma,frailty assessment may lead to identification of patientsat risk for adverse outcomes should a surgical procedurebe performed. For instance, frailty has been shown to besignificantly associated with mortality in a large cohortof emergency general surgery admission including bothhigh- and low-risk procedures, raising the importance ofpreoperative frailty assessment [34]. Assessment of frailtyhas gained a particular importance during COVID-19 pandemic where the possibility of rationing resources suchas ventilator machines has been discussed. Frailty washighlighted as an important tool to address this possibilitydue to its predictive power of disease outcome which wassuperior compared to age or comorbidities alone [35]. Interms of health care policy, knowledge of the prevalence0.78*of frailty in a given community may play a role in resourcedistribution, such as funding of the geriatrics departmentand tailoring range of services available.While elderly prevalence is projected to continue toincrease, estimated to constitute 21% of the US population by 2030, the number of geriatric providers per olderadult is expected to be almost halved by 2030 compared tothe 1980s [36]. Given that elderly patients with a complexmedical profile or trauma history frequently undergo CTexaminations, with ongoing annual growth in CT imagingutilization, it is likely that CT imaging will be much moreavailable than a geriatric appointment [37]. Utilization ofinformation gathered from CT imaging already availablein a patient’s medical chart represents an attractive strategy for flagging patients at risk for frailty who may benefit13
Skeletal Radiologyfrom a comprehensive geriatric evaluation, and thus be ofa significant benefit to society at no additional cost.On a larger scale, this study serves as a gateway topersonalized medicine. It may be viewed as a windowto peer to the possibilities of using CT-derived markersof body composition to assess patient’s well-being andsupplement radiology reports with additional informationthat may alter patient’s treatment or qualify patient fora geriatric workup and assistance with activities of dailyliving. This analysis will be attributed to the radiologistinterpreting the study and will be integrated with the finalreport, which will provide valuable information regardingpatient’s health at no extra cost. Further, such informationhighlights the important role of radiology in the field ofmedicine and patient care and solidifies its relationshipwith the field of orthopedics and geriatrics.It is important to highlight the notion that in this study,comparison was made between frail and prefrail population and it is likely that the association between frailtyand sarcopenia will only be magnified for both genderswhen compared to a healthy geriatric population. Forexample, the median SMI for both frail women and mencorresponded to approximately 25th percentile or lower ofthe age-matched SMI reference curve obtained in a recentpopulation study employing automated CT-derived bodycomposition analysis where patients with a diagnosis ormajor cardiovascular disease or malignancy were excludedfrom the study [21]. Although the strength between imaging-derived sarcopenia and frailty was reduced whenadjusted for age, using this approximation to a relativelyhealthy adult population, this study suggests that CTderived diagnosis of sarcopenia is common in both frailmen and women and will likely serve as a useful screeningtool in identifying frail patients and separating them fromtheir healthy peers.Similarly, given that this study shows that there may be adifference in bone attenuation even between prefrail and frailpatients, this difference will likely be only augmented whencompared to healthy elderly peers. Additionally, it is worthpointing out that most of the previous studies on frailty andosteoporosis were focusing on women, with little knownabout men. This study demonstrated that osteoporosis infrail men reached 43.1% and thus represents an attractivepoint of intervention as osteoporosis is frequently underdiagnosed and undertreated, especially in men [38].Hypoalbuminemia was common in frail groups of bothgenders, although its association with frailty did not reachstatistical significance. Hypoalbuminemia has been associated with a decline in muscle strength in the elderly,while SMI addresses a decline in muscle mass [39]. Further research is necessary to elucidate the usefulness ofadding laboratory findings such as hypoalbuminemia inthe automated frailty diagnosis given that it may provide13complimentary information regarding the state of sarcopenia in a frail patient.Although visceral obesity did not demonstrate an association with frailty, females and males showed differenttrends in the adipose tissue distribution, and SAT and BMIwere statistically significantly lower in the male frail groupcompared to the prefrail group. Given these findings, it islikely that future frailty detection algorithm developmentwill be gender specific. It is also likely that changes inBMI and adipose tissue distribution, particularly
Computed tomography‑based body composition prole as a screening . Materials and methods This cross-sectional study was constructed using our institution’s pelvic trauma registry and ambula- . or retrospective cha