Transcription
Younesy et al. BMC Bioinformatics 2015, 16(Suppl 1/S2RESEARCHOpen AccessVisRseq: R-based visual framework for analysis ofsequencing dataHamid Younesy1,2,5, Torsten Möller1,3, Matthew C Lorincz4, Mohammad M Karimi4,5*, Steven JM Jones2,4,6From 5th Symposium on Biological Data VisualizationDublin, Ireland. 10-11 July 2015AbstractBackground: Several tools have been developed to enable biologists to perform initial browsing and explorationof sequencing data. However the computational tool set for further analyses often requires significantcomputational expertise to use and many of the biologists with the knowledge needed to interpret these datamust rely on programming experts.Results: We present VisRseq, a framework for analysis of sequencing datasets that provides a computationally richand accessible framework for integrative and interactive analyses without requiring programming expertise. Weachieve this aim by providing R apps, which offer a semi-auto generated and unified graphical user interface forcomputational packages in R and repositories such as Bioconductor. To address the interactivity limitation inherentin R libraries, our framework includes several native apps that provide exploration and brushing operations as wellas an integrated genome browser. The apps can be chained together to create more powerful analysis workflows.Conclusions: To validate the usability of VisRseq for analysis of sequencing data, we present two case studiesperformed by our collaborators and report their workflow and insights.BackgroundSequencing data is the generic name for the datasetsacquired using high-throughput nucleic acid sequencingtechniques. This technology can be used to measure thebiochemical states of cells such as the expression levelsof genes or binding sites of proteins in DNA. For example, RNA sequencing (RNA-seq) measures the presenceand quantity of total RNA in a cell at a given momentin time and is widely used in gene expression analysis.Another example is ChIP-sequencing (ChIP-seq) whichis used to analyze protein interactions with DNA.Sequencing data come in a variety of formats. In thesimplest form, each dataset represents a numerical arrayof the size of a genome that varies by the species (onthe order of 3 billion for most mammals). Biologists areoften interested in studying these data in specific regionsof interest. The regions of interest are typically genomic* Correspondence: mkarimi@brc.ubc.ca4Department of Medical Genetics, The University of British Columbia,Vancouver, British Columbia, CanadaFull list of author information is available at the end of the articleintervals specified by features of biological interest suchas the location of genes or neighbourhoods of specificgenomic locations. These regions of interest are oftenstructured in a table with rows corresponding to theregions of interest and columns being the properties ofthose regions, such as the genomic location, biologicalID and quantified measures of enrichment of eachsequencing dataset within those regions.While computational methods to interpret these datacontinue to evolve, the rapidly changing computationaltool set for data analysis often requires significant computational expertise to use. The Bioconductor project [1]is an open source software repository which hosts a widerange of statistical tools developed in the R programmingenvironment [2]. Taking advantage of a rich set of statistical and graphical capabilities in R, numerous Bioconductor packages have been developed to address a varietyof data analysis needs. The use of these packages, however, requires a basic understanding of the R programming/command language and an understanding of thedocumentation accompanying each package. As a result, 2015 Younesy et al. This is an Open Access article distributed under the terms of the Creative Commons Attribution License (http://creativecommons.org/licenses/by/4.0), which permits unrestricted use, distribution, and reproduction in any medium, provided theoriginal work is properly cited. The Creative Commons Public Domain Dedication waiver ) applies to the data made available in this article, unless otherwise stated.
Younesy et al. BMC Bioinformatics 2015, 16(Suppl 1/S2R and the Bioconductor packages are primarily used bycomputer scientists and biologists that have a strongcomputational background, but remain inaccessible tomost biologists who would significantly benefit from theability to analyze such datasets. Hence, there is a clearneed for a framework with an accessible user interfacethat allows biologists easy access to analytical tools forgenomics data without requiring programming expertise.Many useful tools have been developed in recent yearsfor the visual analysis of biological data (e.g. MizBee [3],Pathline [4], or ChAsE [5]). What most of these tools havein common is that they have been designed to analyze andsolve specific biological questions. The goal of this paperis to push the envelop toward a more general-purposevisual analysis tool that can be applied to a broad range ofanalyses of sequencing datasets. This is not unlike suchsuccessful attempts as VTK [6], Prefuse [7], Polaris/Tableau [8], KNIME [9], Orange [10], Lyra [11] andCSIRO Workspace [12]. These systems attempt to bringdata analysis through visual means to a large audience.Most of these tools also provide some form of integrationwith R and enable enriching their interactive data miningand visualization components with the statistical capabilities in R, however they are mostly accessible to users whohave the technical skills for R development. In addition,they do not address the specific challenges associated withsequence analysis. Simple standards, such as integration ofa genome browser or support for sequencing data aremissing. Many of the tools for sequence analysis aremeant to be used by bioinformaticians (as opposed to forbiologists), and require programming skills. Those toolsaimed at the biologists, on the other hand, offer limitedanalytical tools and are hard to extend or generalize.Page 2 of 14R packages more accessible, however their scopes remainlimited to the specific modules they are designed for andit is difficult, if not impractical, for biologists to link several modules to create more complex workflows. In addition, due to the significant coding effort required tocreate the graphical layout for each library and to passthe data to and from the GUI, most R libraries stillremain without a graphical user interface.Visualization systems for biological data analysisSeveral visualization systems have been developed tomitigate the dependence of biologists on programmersand allow biologists to be more involved in computational analysis tasks. Genome browsers such as UCSC[30] and IGV [31] allow users to navigate across thegenome for detailed data inspection and exploration.While genome browsers are useful for viewing specificgenomic regions, they are not effective for global analysis and pattern discovery. Several systems such asCisGenome [32], seqMINER [33], Cistrome [34], EpiExplorer [35], Genomic HyperBrowser [36], FlowJo [37]and SeqMonk [38] have been developed to address theneed for global pattern analysis. The strength of thesetools lies in their ability to connect several analysismethods in a single application, but adding newly developed analysis pipelines is not easy and researchers mayfind themselves waiting for state-of-the-art algorithms tobe implemented within these packages. A more recentrelated tool is Epiviz [39] that provides an interactivegenome browser and data-analysis platform for functional genomics data. A scripting interface is also provided to invoke R functions and display the resultswithin the tool, however this extension remains accessible only to users with relevant technical skills.R-based visualization systemsThe lack of a graphical user interface (GUI) for themajority of the packages makes most of them inaccessible to biologists without programming expertise. Severalframeworks have been developed to provide graphicaluser interfaces in R. Packages such as RGtk2 [13], fgui[14], R-Tcl/Tk [15], gWidget [16], JGR [17] and SciViews-R [18] allow programmers to create graphicaluser interfaces for command-line R packages. They havebeen used in general purpose packages such as Deducer[19], R Commander [20], GrapheR [21] and Rattle [22]as well as packages for biological data analysis, such asSeqGrapheR [23], limmaGUI [24], affylmGUI [25] andOLINgui [26].With the increased popularity of web-based analysisapplications, several solutions such as shiny [27], ggvis[28] and googlevis [29] have been developed to provide aweb-based interface or an interactive implementation forR libraries. The graphical interfaces created by theselibraries provide means to make the individual underlyingConventional analysis workflowThe initial task in a typical analysis workflow is creatingthe data table for the regions of interest and sequencingdata specific to the study. For each sequencing dataset,biologists compute a summary of the values of thesequencing data near each region of interest. The methodfor computation varies based on the type of the datasetand the study and can be as simple as adding up allvalues within the genomic interval, or more sophisticatedmethods involving machine learning (e.g. Hidden MarkovModels or Baysian Networks) and non-linear normalization, but ultimately each dataset is generally summarizedto one or multiple columns in a table.Many tools (e.g. Galaxy [40] and SeqMonk [38])have been developed to create these data tables, whichcome with command line or graphical user interfaces.These tools do a satisfactory job of helping biologists withthe initial steps of data preparation such as quality control,sequence alignment, file format conversion and filtering.
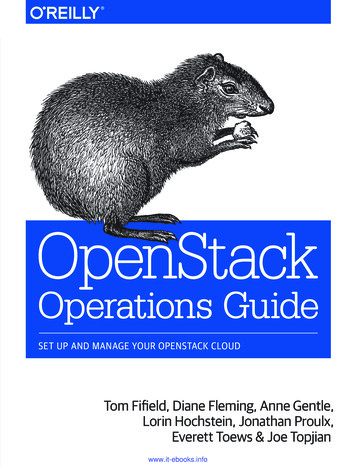
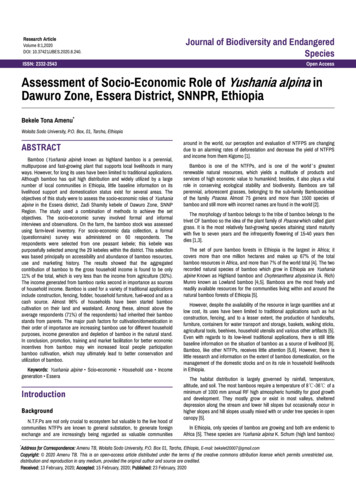
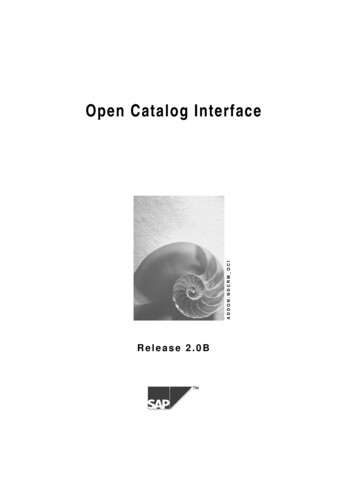
Younesy et al. BMC Bioinformatics 2015, 16(Suppl 1/S2However they provide limited functionality for exploratoryanalyses and visualization. Thus far, such analyses can onlybe provided through additional programming interfaces /languages, such as R.During the initial exploration phase, biologists frequently want to browse their datasets in a genomic context while studying the data table. Genome browsers area popular approach for visualizing genome-scale data inwhich each dataset is displayed as a histogram plot orheat map, often called a “track”, and multiple datasetscan be viewed simultaneously by stacking these tracks.The data tables exploration is often performed in common spreadsheet applications such as Microsoft Exceland involves sorting columns and looking and verifyingthe information at known regions of interest. Simultaneous use of the genome browser and table view isoften a tedious task requiring switching back-and-forthbetween various applications while copy-pasting namesor locations of genomic addresses from one applicationto the other.Biologists employ a variety of computational methodsfrom simple numerical calculations on the columns tomore advanced generic or domain specific statistical ormachine learning algorithms. Many biologists are comfortable doing the simple calculations supported bymost spreadsheet software packages. However usingmore advanced techniques requires familiarity with programming or scripting environments, making them inaccessible to most biologists.Results of the computations are then illustrated inplots such as histograms, bar charts, scatter plots andheat maps. Based on those results biologists often repeatand iterate the analyses with more refined subsets, forinstance with rows for which a computed p-value islower than a certain threshold.Page 3 of 14appropriate for presenting our results. We held formativeinterviews with biologists from three centres (BC Genome Sciences Centre, UBC Life Sciences Institute andlater UBC Biomedical Research Centre), to understandtheir analysis workflow and the limitations of their existing tools. Our collaborators then evaluated the earlywire-frame prototypes like the one shown in Figure 1(created using Wireframe Sketcher [42]) and later iterated on several interactive prototypes built using Javaand libraries in IGV [31] to read sequencing data formats.Our main rationale behind using a desktop platform(Java) as opposed to the a web platform (JavaScript) wasbeing able to handle the inherently large sequencing datasets (Gigabytes) while providing an interactive userexperience, a similar rationale behind popular desktopgenomic viewers such as IGV [31].As we progressed through our design we realized thatall three groups of our collaborators required a moregeneral purpose system that was capable of solving several biological data analysis problems and flexibleenough to adapt to new challenges. Our requirementseventually boiled down to: Not requiring programming skills to use Inherent support for sequencing data Integration of a base set of analysis methods suchas dimensionality reduction (PCA, MDS), clustering(Kmeans, hierarchical), and RNA-seq analysis tools. Integration with a genome browser Ease of adopting new analysis methods(extensibility)In the following sections we will discuss our designdecisions in more detail:R appsMethodsIn this section we will present the general frameworkand the design choices we made for VisRseq. We startwith an overview of our design process and the tasksidentified during the requirement analysis stage. Wethen present the R apps framework, which offers asemi-auto generated and unified graphical user interfacefor computational R packages and repositories such asBioconductor [1]. We will then give an overview of theinterface and its ability to chain apps together to createanalysis workflows.DesignVisRseq was developed through an iterative user-centreddesign process. In our approach we followed a designstudy methodology [41], however as the developed solution converged toward a more general purpose framework, we realized a system’s paper format would be moreThere are two types of apps in VisRseq: R apps andnative apps. Every R app consists of an R script file withthe caller functions accompanied by a JSON file specifying the parameters to be passed to the R script. Nativeapps are created in Java and are pre-compiled with theframework to allow interactive graphics. They are discussed in the following section.We had three main design goals when creating the Rapps. The first was to provide an accessible interface forbiologists to use libraries in R, without requiring programming expertise. The second was to allow users tolink the R apps with the interactive components. Thethird was to minimize the effort required by R developers to create the R apps user interface for new or existing R libraries.At the core of an R app is an R document which contains the required script to perform the desired functionality. It is up to the developer of the app to decide
Younesy et al. BMC Bioinformatics 2015, 16(Suppl 1/S2Page 4 of 14Figure 1 Wire-frame prototype. A later stage wire-frame prototype created using the WireframeSketcher software.which parameters will be exposed to the user. Theseparameters will be assigned unique parameter names(exposed to the user of the app and therefore can be different from internal names). The parameter names andtheir types are then placed in a file in JavaScript ObjectNotation (JSON) format with the same name prefix andwith the .json extension.Table 1 shows the current supported variable types,the corresponding R type and the generated GUI component. An optional icon can also be specified by providing a .png file with the same name prefix.Once VisRseq starts, it searches through a specific directory for all *.R files with an accompanying .json fileand populates the Apps pane in the main user interface. Adefault gray box is used as the apps icon if an image withthe app’s name is not found. When the user drags an appinto the workspace, the app’s .json file is parsed and thegraphical user interface is automatically created usingJava’s Swing library. In addition to providing a unified userinteraction model, our intention was to minimize theeffort required by developers to create apps. Unlike thepreviously mentioned related work on creating user interfaces for R, which required users to write the code for theactual graphical interface, we have kept the requirementsto the minimum of specifying the input parameter namesand types.Once the user specifies the parameters and hits theRun button, an R session is created using the Rserve[43] library. Rserve is a TCP/IP server which allows client programs to use facilities of R from various languages including Java without the need to initialize R orTable 1. Supported types for input parametersvariable typeR data typeGUI ng with ame / matrixJTextFieldVariable type definition keywords, corresponding R data types and thegenerated GUI component.
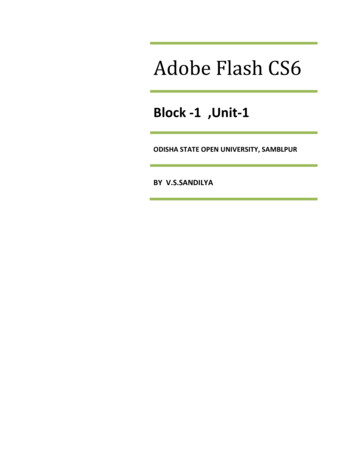
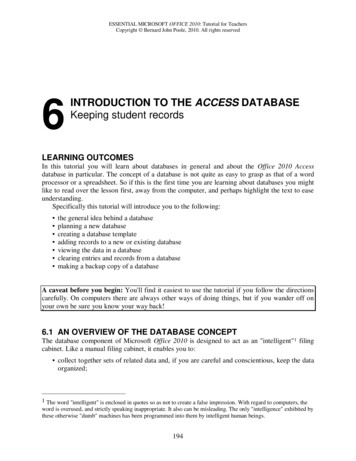
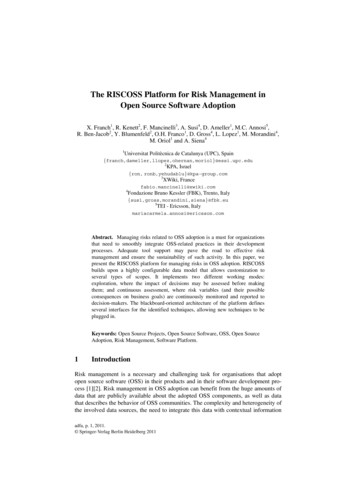
Younesy et al. BMC Bioinformatics 2015, 16(Suppl 1/S2link against R library. The input data table and user specified parameters are passed to the R session and theR code is executed line by line. The textual output ofthe R is directed to a console pane and the final graphicaloutput is displayed in the pane assigned to the specificapp. A progress animation is displayed inside the app’spane while the code is running and the user may terminate running the app by pressing the cancel button.Apps may also have output variables. Currently wesupport column, table or file output. If the user specifiesa name for the output (i.e. the name for the column,table or file), the output of the app is read back fromthe R session. A user may specify a new name to createa new column, table or file or use an existing name tooverwrite one. These outputs can also be used as inputsin other apps, allowing the users to link several apps.In addition to the auto-generated GUI, more experienced users may also browse and modify the R code byselecting the “Code” tab above the parameters pane.This will show a syntax highlighted text editor with theR code that can be edited and executed within the tool.While this is not meant to be a full featured R development environment such as RStudio [44] it is useful formore technical users as a quick way of browsing theR code and making small modifications to the appswithout requiring to exit the tool.By default the input data is loaded to the R sessionbefore the execution of the R script, but an app developer can place a line in the script with ###applyParameters to specify when exactly the parameters shouldbe loaded. Since the R script is processed line by line,commands or structures extending over multiple lineswill not execute properly. To resolve this, users caneither place the lines of code inside a {{ }} block orsimply put the code in a separate R file and use R’ssource() command to include the code.As mentioned, our goal is to minimize the effort of Rdevelopers to create R apps. Thus the informationrequired to create the GUI is kept to the minimum ofspecifying the variable’s name and type (in fact specifyingthe type is also optional when the input is a string). However the app developer has the option to enrich the interface by specifying the following additional information: categories: grouping variables together. Theycan be collapsed or expanded by default. label: specifying the label shown in the GUI. Ifnot specified, a label will be generated from the variable name by replacing the underscore “ ” characterswith space “ “ and removing the “input“ prefix, if any. info: specifying details about the variable to beshown as a tool tip text. default: specifying a default value for the variable displayed in the initialized GUI.Page 5 of 14 min / max: specifying the valid input range forthe integer and numeric variables. items: showing a list of string items to choosefrom. ui: customizing the user interface. Currently, thisis only implemented for file variables where specifying “load“ or “save“ will create a load or save dialogbox. Additional options are planned to be added tothe system to add more customization to other variable types, such as choosing between a spinner or slider for numerical columns or between combo boxand radio groups for items.A simple R appTo show the simplicity of creating R apps we walkthrough a simple 2D plot that uses R’s default plottingfunctionality. Figure 2(a) shows the R code for a simple2D plot. It takes two required parameters, input xand input y, the column names used for and y, andthree optional parameters, input color for the pointcolors, input log for selecting logarithmic scale andinput title for the plot title.Figure 2(b) shows the input parameters specified inJSON format. The type specified for input x and input y is column numerical which indicates the GUIshould list only the numerical columns of the input table,while the type of input color is specified as columnso any column is a valid selection. For input log a listof four strings ("”, “x“, “y“, “xy“) is specified with the firstone being the default. The type for input title is notspecified so it will be considered a string input by default.The graphical user interface generated from the parameter specification is shown in Figure 2(c) and the graphical output of running the app with example inputparameters is shown Figure 2(d).Thus far we have implemented several plotting and analysis apps as well as widely used packages from the Bioconductor project. Among those, are DESeq [45,46] andEdgeR [47] which are popular packages used for differential expression analysis using RNA-Seq data statistics. Wespent about half an hour for simple apps such as the PieChart and BarPlot apps and about two hours for the twoBioconductor apps as they required going through eachpackage’s documentation and samples. These approximatetimes are just for the initial creation of the apps with basicfunctionality and naturally we had to spend additionaltime iterating on each app with the users to improve theusability or to add new functionality.Native appsThe basic mental model of our views is a table that tiesall views together. However, during our requirementanalyses, our users frequently asked for an interactive
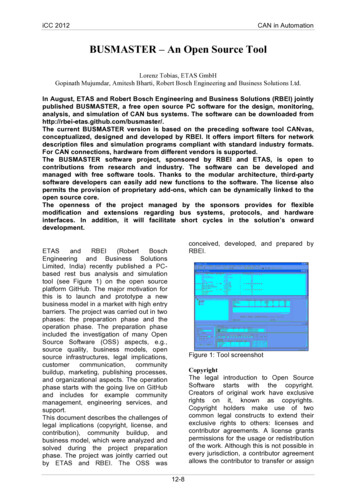
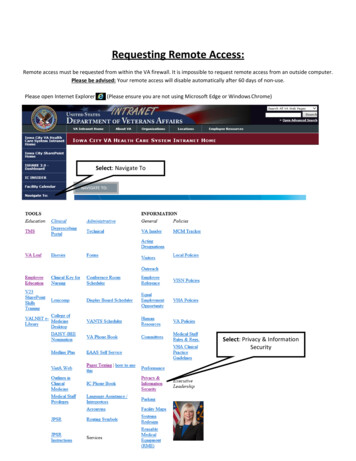
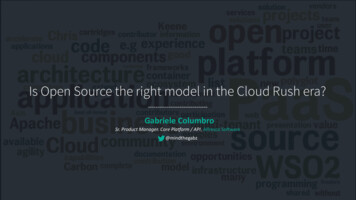
Younesy et al. BMC Bioinformatics 2015, 16(Suppl 1/S2Page 6 of 14Figure 2 Components of SimplePlot R app. (a) The R code. (b) The input parameters in JSON format. (c) The auto-generated UI. (d) Thegraphical output after running the app.interface for some of the apps to allow interactive navigation as well as brushing operators to select subsets.Since R doesn’t provide such interactivity, we realizedthe tool would not be completely useful without interactivity at least for basic plot types. The ones with popularrequest were histogram, scatter plot, Venn diagram anda genome browser.Table view: displays a data table in a layout commonin spreadsheet software (Figure 3(a)). Clicking a columnheader shows a popup menu allowing users to performseveral tasks such as sorting the table by that column,removing, or editing columns (e.g. changing the equation for calculated columns).Histogram: provides a standard interactive frequencyplot (Figure 3(b)). Any numerical table column can beused for the x-axis. The y-axis can have optional transformations such as log, cumulative distribution functionand percentage. Users can perform standard panningand zooming interaction or directly specify exact values.The histogram plot offers a range filter that can be usedto create a subset of the rows with their value fallingwithin the range. Users can choose to have more thanone segment for each range filter and specify whetherthe ranges should be equally spaced or have equal number of items. Once a filter is created it persists for thattable and it is updated whenever the data values change.Scatter plot: shows an interactive 2d scatter plot(Figure 3(c)). Users can specify multiple columns to thehorizontal or vertical axis to effectively create a scatterplot matrix. Users can select a group of points and create a subset using the rectangle, polygon and quad filterprovided. Similar to the histogram range filter, the scatter plot filters will persist and update as the data ischanged.Venn diagram: shows approximate area preservingEuler diagrams or symmetric Venn diagrams (up to 5sets) for the subsets assigned to the plot (Figure 3(d)).Users can toggle between the two modes. The transitionfrom one mode to the next is animated. The diagram isupdated when any of the subsets change.Genome browser: we integrated IGV [31] a widely usedgenome browser (Figure 3(e)). Users can load the tracks
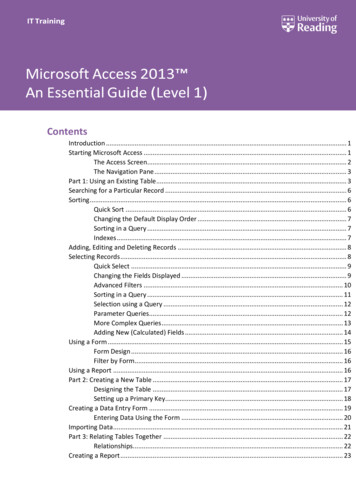
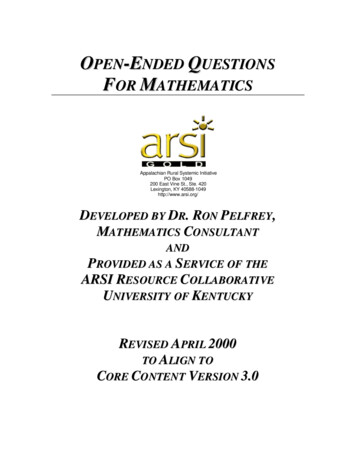
Younesy et al. BMC Bioinformatics 2015, 16(Suppl 1/S2Page 7 of 14Figure 3 Interactive Apps. (a) Table view. (b) Histogram plot. (c) Scatter plot. (d) Venn/Euler diagrams. (e) IGV genome browser.that are displayed in the genome browser into their datatables. For tables that have columns with genomic location, clicking on the rows in the Table app or on thepoints in the Scatter plot app navigates the GenomeBrowser to the corresponding genomic location.These apps are currently implemented natively in Java.We plan to investigate the possibility of creating theinteractive apps utilizing the capabilities of frameworkssuch as D3.js [48] and BioJS [49] to allow for easier integration of new interactive apps, however, that willrequire overcoming several technical challenges such asembedding JavaScript based visualizations within a Javaapplication.It is also worth mentioning that while we were awareof the inferiority of some of the visualization techniques(e.g. pie charts and Venn diagrams) we included themas they were requested by our collaborators and used intheir workflows.The VisRseq graphical user interfaceThe VisRseq graphical user interface is shown in Figure 4.It is split into several panes exposing the different functionalities provided in the framework.At the left-hand is the Data Pane (Figure 4(a)) whichdepicts current data tables loaded in the system. Theright-hand panel contains the Apps pane on the top(Figure 4(b)) and the Parameters pane on the bottom(Figure 4(c)). The Apps pane contains the icons for themodules available to the user; we will refer to them as“apps” throughout the rest of the paper. The Parameterspane shows the input parameters for the currentlyselected app. At the center is the workspace area (Figure4(d)), where the panes for the currently running appsare laid out. Each pane is customized based on the utilities of each app, but for most apps it displays a graphical output. The textual output of apps is displayedin the Console pane at the bottom of the workspace(Figure 4(e)).Figure 4 shows an example layout after some analysissteps. Users may change the layout of the panes to customize it based on their display size or workflowrequirements. For example, we observed some userspreferring to overlap the parameters and apps pane intoa tabbed pane to utilize the entire horizontal spacewhen specifying parameters. In the following sectionswe will describe the interface in more detail.Data paneAs previously mentioned, VisRseq’s internal data is atabular data model: a collection of records with namedattributes of a given data type. Users can create tableseither from the feature files containing genomic regionsor load text files in comma separated format. Duringanalysis, subsets may be created through filtering, preserving the inherit hierarchy of these sets.Table columns are either data columns created fromsequencing data, calculated columns, or output columnsof apps. VisRseq provides an interface with a variety ofoptions to process and normalize sequencing data inBAM [50] and WIG [51] formats. This was one of thefirst features in the working prototype and was much
Younesy et al. BMC Bioinformatics 2015, 16(Suppl 1/S2Page 8 of 14Figure 4 VisRseq interface. (a) Data pane. (b) Apps pane. (c) Parameters pane. (d) Workspace populated with several app panes. (e) Consolepane.appreciated by our collaborators as it enabled them touse their own as well as available public datasets fortheir analysis. Inspired by the calculation option in mostspreadsheet software, we added a calculator interfaceusing a similar syntax to Microsoft Excel that our collaborators were well familiar with. As discussed previously, R apps may also be used to create new columnsor overwrite columns of an existing table (e.g. a computed cluster id or p-value).Apps paneApps are the analysis modules of VisRseq. The Apps panehosts an iconic view of the available apps. Individual panesfor any App are created by dragging the app’s icon anddropping it at the desired location in the workspace. Ahighlight box shows the placement of the new pane as theuser drags and moves the app over the workspace area.Once an app pane is added to the workspace, the userassigns the input table to the app by dragging the desireddata node from the Data pane into the app’s pane.Parameters paneWhenever the user clicks on the output pane of an app,the parameters pane is updated to show the parametersfor the app. As previously explained, the user interfacefor the parameters of R apps is automatically generatedfrom a JSON file describing the in
R-based visualization systems The lack of a graphical user interface (GUI) for the majority of the packages makes most of them inaccessi-ble to biologists without programming expertise. Several frameworks have been developed to provide graphical user interfaces in R. Packages such as RGtk2 [13], fgui [14],