Transcription
IMPRESSIONSSTUDYSTUDYV.3V.4A cost analysis of promotional productsversus other advertising mediaReleased at the 2013 ASI Power SummitA PDF of this report (plus end buyer-friendly, downloadable charts) can be found at asicentral.com/study Copyright 2013 Advertising Specialty Institute. All Rights ReservedThis report may be reproduced and used in presentations by active supplier, distributor and decorator members of theAdvertising Specialty Institute (ASI) to educate the public about advertising specialties. Such use must not alter theinformation and must set forth the following legend: “Research provided by the Advertising Specialty Institute, 2013,All Rights Reserved.” No other use is permitted without the express written consent of ASI.
le of ContentsIntroduction. . . . . . . . . . . . . . . . . . . . . . . . . . . . . . . . . . . . . . . . . . . . . . . . . . . . . . . . . . . . . . . . . . . . . . . . . . . . . . . . . . . . . . . . . . . . . . . . . . . 3 Section OneProduct Popularity. . . . . . . . . . . . . . . . . . . . . . . . . . . . . . . . . . . . . . . . . . . . . . . . . . . . . . . . . . . . . . . . . . . . . . . . . . . . . . . . . . . . . . . . . . 4Product Spotlight: Writing Instruments. . . . . . . . . . . . . . . . . . . . . . . . . . . . . . . . . . . . . . . . . . . . . . . . . . . . . . . . . 5Product Spotlight: Shirts. . . . . . . . . . . . . . . . . . . . . . . . . . . . . . . . . . . . . . . . . . . . . . . . . . . . . . . . . . . . . . . . . . . . . . . . . . . . . . . . . 6Product Spotlight: Bags. . . . . . . . . . . . . . . . . . . . . . . . . . . . . . . . . . . . . . . . . . . . . . . . . . . . . . . . . . . . . . . . . . . . . . . . . . . . . . . . . . 7Product Spotlight: Calendars. . . . . . . . . . . . . . . . . . . . . . . . . . . . . . . . . . . . . . . . . . . . . . . . . . . . . . . . . . . . . . . . . . . . . . . . . . 8Product Spotlight: Desk Accessories. . . . . . . . . . . . . . . . . . . . . . . . . . . . . . . . . . . . . . . . . . . . . . . . . . . . . . . . . . . . . . 9Product Spotlight: Caps/Headwear. . . . . . . . . . . . . . . . . . . . . . . . . . . . . . . . . . . . . . . . . . . . . . . . . . . . . . . . . . . . . . . . 10Product Spotlight: Drinkware. . . . . . . . . . . . . . . . . . . . . . . . . . . . . . . . . . . . . . . . . . . . . . . . . . . . . . . . . . . . . . . . . . . . . . . . . 11Product Spotlight: USB Drives. . . . . . . . . . . . . . . . . . . . . . . . . . . . . . . . . . . . . . . . . . . . . . . . . . . . . . . . . . . . . . . . . . . . . . . . 12Product Spotlight: Health & Safety Items. . . . . . . . . . . . . . . . . . . . . . . . . . . . . . . . . . . . . . . . . . . . . . . . . . . . . . . 13Product Spotlight: Outerwear. . . . . . . . . . . . . . . . . . . . . . . . . . . . . . . . . . . . . . . . . . . . . . . . . . . . . . . . . . . . . . . . . . . . . . . . . 14Staying Power. . . . . . . . . . . . . . . . . . . . . . . . . . . . . . . . . . . . . . . . . . . . . . . . . . . . . . . . . . . . . . . . . . . . . . . . . . . . . . . . . . . . . . . . . . . . . . . . . 15Promo Products are Passed Along — Usefulness is Key. . . . . . . . . . . . . . . . . . . . . . . . . . . . . . . . . . 16How Many Items Do People Own?. . . . . . . . . . . . . . . . . . . . . . . . . . . . . . . . . . . . . . . . . . . . . . . . . . . . . . . . . . . . . . . . . . 18 Section TwoRecipients’ Views on Advertisers. . . . . . . . . . . . . . . . . . . . . . . . . . . . . . . . . . . . . . . . . . . . . . . . . . . . . . . . . . . . . . . . . . . 19Swaying Opinions. . . . . . . . . . . . . . . . . . . . . . . . . . . . . . . . . . . . . . . . . . . . . . . . . . . . . . . . . . . . . . . . . . . . . . . . . . . . . . . . . . . . . . . . . . . . 20Ad Specialties Generate New Business. . . . . . . . . . . . . . . . . . . . . . . . . . . . . . . . . . . . . . . . . . . . . . . . . . . . . . . . . . . 21Location of Promotional Products. . . . . . . . . . . . . . . . . . . . . . . . . . . . . . . . . . . . . . . . . . . . . . . . . . . . . . . . . . . . . . . . . . 22 Section ThreePromotional Products Make an Impression. . . . . . . . . . . . . . . . . . . . . . . . . . . . . . . . . . . . . . . . . . . . . . . . . . . 23The Cost-Effectiveness of Ad Specialties. . . . . . . . . . . . . . . . . . . . . . . . . . . . . . . . . . . . . . . . . . . . . . . . . . . . . . . . 25Demographics. . . . . . . . . . . . . . . . . . . . . . . . . . . . . . . . . . . . . . . . . . . . . . . . . . . . . . . . . . . . . . . . . . . . . . . . . . . . . . . . . . . . . . . . . . . . . . . . . 26 2013 Advertising Specialty Institute . All Rights Reserved.2
The ASI Ad Impressions Study was first launched in 2006 by ASI’s researchteam to give its members powerful data that proves ad specialties are one ofthe most high-impact, cost-effective ad mediums available.Through thousands of live and online interviews with businesspeople and college students in key cities in the UnitedStates, Canada, Europe and Australia, the study gauges consumer perceptions of promotional products and how theyinfluence buying decisions; highlights the popularity of key promo product categories by demographic group (such asage, race, sex and gender); reveals the cost-per-impression of top advertising specialty product categories; and shows thecost-per-impression of promotional products compared to other forms of advertising media, like radio, TV and Internetadvertising. The study is conducted by ASI annually. MethodologyThis report contains results from the 2012 study and additional research whichtook place in 2013. For the 2013 phase of the study, conducted during Maythrough July of 2013, ASI’s research team and business partners interviewedbusinesspeople in nine metro areas: Atlanta, Boston, Houston, Phoenix, SanFrancisco, Madrid, Rome, Berlin/Düsseldorf and Sydney. In Germany, ASIpartnered with PSI (Promotional Product Service Institute) to administer thesurveys, while Pantheon Systems conducted the research in Sydney, Australia.Respondents in all regions were asked questions about the promotional productsthey had received, including how many they had, how they used them, why theykept them, and their impressions of the advertisers that gave them the items.ASI’s researchteam polled 7,000 consumers in 21metro areas toprove the powerof promotionalproducts.Further, an online panel survey was conducted among recipients of advertising specialties in those same geographic areasto augment the sample from the man-on-the-street interviews. All respondents were at least 18 years old.Results from the 2012 ASI Ad Impressions Study have been incorporated here so that additional metro areas can beincluded in the analysis as well as providing a more robust view of the U.S. Last year there were 12 metro areas: New York,Chicago, Miami, Los Angeles, Seattle, Dallas, Philadelphia, London, Paris, Toronto, Vancouver and Montreal. This bringsthe total number of metro areas covered by the report over the two-year period to 21, eight of which took place outsideof the U.S. There are responses from eight different countries in the report.The total combined number of interviews, both in person and online, for both waves of this study is 7,145. How This Report is OrganizedThis report contains three sections: “Product Popularity” (Pages 4 to 18) highlights the most popular promotional products by category, and includesdetailed demographic breakdowns by geography, gender, race, age, income and political affiliation. For example, on the“Product Spotlight: Writing Instruments” section on page 5, you’ll note that women are significantly more likely thanmen to own a logoed pen or pencil, and over one-half of Caucasians own branded writing instruments. This section willbe a helpful tool for distributors to use in guiding their clients toward products that will be the most impactful in theirmarketing efforts. “Recipients’ Views on Advertisers” (Pages 19 to 22) reveals important information showcasing how longbusinesspeople hold onto logoed items; what they do with items they don’t wish to keep; and how many totalpromotional items they own, broken out by a variety of demographic groups. This section provides hard data to combatobjections from buyers who may think that promotional items are “throwaways” or “afterthoughts” in a marketingcampaign, and may not understand their true value. “ Promo Products Make an Impression” (Pages 23 to 25) highlights the industry products that deliver the bestcost-per-impression and compares the cost-per-impression of ad specialties to other forms of media, like Internet andradio advertising. This is a great tool distributors can use to convince end-buyers to allocate more of their marketingdollars to promotional products.While this report includes the study’s highlights, ASI members can go online at www.asicentral.com/study for a researchtool that will allow them to gain access to the full study data.Note: All demographic breakdowns (age, race, gender, etc.) reflect U.S. consumers only. Respondents from other countriesare represented in aggregate. 2013 Advertising Specialty Institute . All Rights Reserved.3
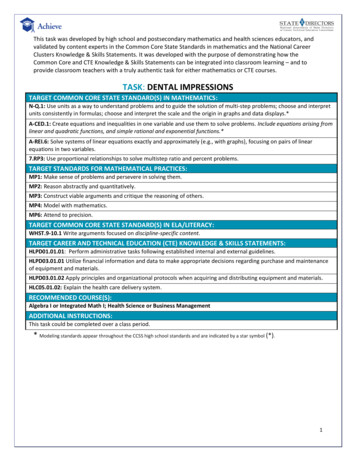
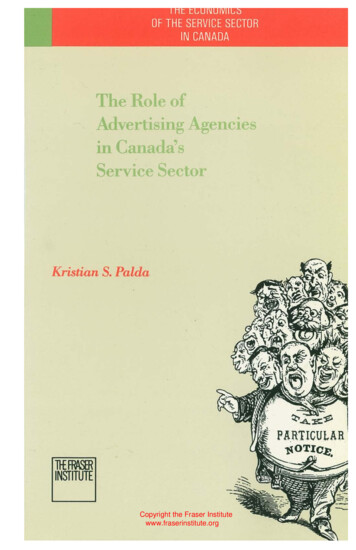
Section OneProduct Popularity KeyTakeawaysFor this section, respondents were asked to provide up to three promotional items they had received in the last 12months. Promotional items were defined as items that include pens, T-shirts, mugs, calendars or any items that havea logo or message from an advertiser on them; they are usually given away for free to consumers in hopes of positivelyinfluencing their purchasing preferences or their attitudes toward the advertiser.WRITING INSTRUMENTSSHIRTSBAGS24%CALENDARS21%DESK/OFFICE ACCESSORIES 12%CAPS/HEADWEAR 10%DRINKWARE 9%USB DRIVES/FLASH DRIVES19%HEALTH & SAFETY PRODUCTS 8%OUTERWEAR 11%WRITING INSTRUMENTSSHIRTSBAGSCALENDARSDESK/OFFICE ACCESSORIES 13%CAPS/HEADWEAR19%DRINKWARE 15%USB DRIVES/FLASH DRIVESHEALTH & SAFETY PRODUCTS 15%OUTERWEAR17%40%44%31%31%34%56%SYDNEYWRITING INSTRUMENTSSHIRTS34%BAGS23%CALENDARS25%DESK/OFFICE ACCESSORIES17%CAPS/HEADWEAR 10%DRINKWARE20%USB DRIVES/FLASH DRIVES16%5.8HEALTH & SAFETY PRODUCTS 6%OUTERWEAR 6%WRITING INSTRUMENTS35%SHIRTSBAGS31%CALENDARS31%DESK/OFFICE ACCESSORIES34%32%CAPS/HEADWEARDRINKWARE15%USB DRIVES/FLASH DRIVES25%HEALTH & SAFETY PRODUCTS 13%OUTERWEAR 9%52% 46%43% WRITING ICE ACCESSORIES28%CAPS/HEADWEAR 14%DRINKWARE17%USB DRIVES/FLASH DRIVES18%HEALTH & SAFETY PRODUCTS 12%OUTERWEAR17% 2013 Advertising Specialty Institute . All Rights Reserved.ROMEMADRID50%44%BERLINWRITING INSTRUMENTSSHIRTSBAGS31%CALENDARS22%DESK/OFFICE ACCESSORIES22%19%CAPS/HEADWEARDRINKWARE21%USB DRIVES/FLASH DRIVES 11%HEALTH & SAFETY PRODUCTS 9%OUTERWEAR 10%LONDONWRITING ICE ACCESSORIES16%CAPS/HEADWEAR21%DRINKWARE13%USB DRIVES/FLASH DRIVES 12%HEALTH & SAFETY PRODUCTS 11%OUTERWEAR16%PARISUSACANADAAs the chart below reveals, writing instruments were most commonly cited, as one-half (50%) of promotionalproduct recipients in the 12 cities in the U.S. reported getting at least one in the prior 12 months, similar to the 52%that reported getting them in Sydney. There are also significant differences in cities in other countries, such as53% of study respondents in Rome who received a shirt, higher than any other metro area, or 66% that had writinginstruments in Philadelphia.WRITING ICE ACCESSORIES24%CAPS/HEADWEAR28%DRINKWARE 15%USB DRIVES/FLASH DRIVES24%HEALTH & SAFETY PRODUCTS 15%OUTERWEAR 11%4
Product Spotlight: Writing Instruments50%66%/1 10thof a cent2013PhiladelphiansLogoed pens and pencilstie bags for the lowestcost-per-impression inthe United States.56%of Caucasianconsumers ownbranded writinginstruments – thehighest percentageof any racialdemographic.continue towriting instrumentsthe most. 66% say theyown a branded pen orpencil, vs. 50% in theU.S. overall.5,788Rome generates the most productimpressions of any European city.DOWN UNDERMore Women thanMen Own PromoPens & Pencils53%Writing instrumentsare more popularthan in the U.S.52% ofAussies owna brandedwritinginstrument.52%47% 2013 Advertising Specialty Institute . All Rights Reserved.5
62%Product Spotlight: Shirts44%TEE IT UP!Although they’repopular among allage groups, youngerconsumers aremost likely to own abranded shirt.OF U.S. CONSUMERSOWN A PROMOTIONAL SHIRT48%21-3445%35-4433%45-5435%55 46%Vivasay they owna promotionalshirt, vs. 44%in the U.S. Italia!AtlantaRomans love their gelato. . .and their promo tees.53% of consumers inRome own branded shirts —the highest percentage ofany of the 21 metro areasin the survey.GEORGIA53%40%46%Independent41%The Vote Is In46% of independent voters report owninga promotional shirt. 40% of Democrats and41% of Republicans make the same claim. 2013 Advertising Specialty Institute . All Rights Reserved.Of the 12 U.S. metro cities wherepeople were polled, consumers inAtlanta lead the way.Men Own MorePromo ShirtsThan Women45%40%52%of Latinoconsumers owna promotionalT-shirt, the mostof any racialdemographic.6
Product Spotlight: Bags 1/10 of a centth31%Logoed bags tie withwriting instrumentsas having the lowest costper-impression of anypromotional item in theUnited States.OF U.S. CONSUMERSOWN A PROMOTIONAL BAG33%27% 27%Bags generatemore impressionsin the United Statesthan any otherpromotional item.Independent5,98337%Politically Speaking33% of Democrats ownlogoed bags, compared to27% of Republicans and27% of Independents.Women are morelikely than men toown branded bagsBy the BayIn the United States,San Franciscans aremost likely to own apromotional bag.38%The percentage ofAfrican Americanswho own promobags – the highestpercentage of anyracial demographic.36% of consumers therehave received one inthe last 12 months. 2013 Advertising Specialty Institute . All Rights Reserved.Income GapPeople who makeless than 50,000are most likely tocarry promo bags.35% 50,00024%33%30% 50,000 - 99,00 100,000 7
Product Spotlight: Calendars27% of consumers in Houstonown promotional calendars.That’s five percentage pointsabove the U.S. average.26%IndependentThe Votes are InIndependent voters weremost likely to report havingcalendars.Staying PowerNot surprisingly, calendars areheld onto longer than all otherpromotional products — ninemonths on average, comparedto seven months for theaverage ad specialty.22%9 mo.7 mo.OF U.S. CONSUMERSOWN A PROMOTIONAL CALENDAROnDisplay29% 27%76% of consumers who own calendarssay they display them prominently intheir homes or offices. 2013 Advertising Specialty Institute . All Rights Reserved.21%Northern ExposureOf all the metro areas, consumersin Montreal have the most brandedcalendars.24%15%Promotional calendars aregreat branding tools.76%22%55 45-5435-4421-34Better With AgeBranded calendars areespecially popularamong older consumers.37%HAVE ONEIN THEIRPOSSESSION NOW8
Product Spotlight: Desk Accessories25%Go Blue!Democrats are the mostlikely among the majorpolitical parties to owndesk accessories.The percentage of U.S. Asian consumerswho own desk accessories, the most of anyracial demographic group.25%19%Trending YoungYounger consumersare more likely tohave desk accessoriesthan older ones.25%20% 19%16%Independent18%44%22%21-34 35-44 45-54OF U.S. CONSUMERSOWN A LOGOED DESK ACCESSORYWomen Vs. MenWomen are more likely than mento own desk accessories.Women55 Men24% 18%34%OF SYDNEY RESIDENTSADORN THEIR DESKS WITHPEN SETS, LOGOED PHONECHARGERS, BUSINESS CARDHOLDERS AND THE LIKE.ABCAustralians are the most likely tohave a branded desk accessory. 2013 Advertising Specialty Institute . All Rights Reserved.9
Product Spotlight: .Madrid14%12%11%The Aussies Win!Consumers in Sydney,Rome and Canada allBerlinown more caps thanthose in the U.S.ParisLondon has the fewestLondon cap-wearers.20%25%27% 50,000 50,000 - 99,000Why do people keepbranded hats? Amajority do so becausethey’re useful, butlooks matter, too. 42%say they also keepcaps because they areattractive.19%OFU.S. CONSUMERSOWN A PROMOTIONAL CAP 100,000 23%Dollar SignsLooking to target high earners? A capmight do the trick. Those who earn 100,000 are more likely to wear abranded hat.Seeing Red22% of Republicans ownMen at WorkMale consumers are farmore likely than females toown a branded cap.21%18%16%promotional hats, versus 20% ofIndependents and 18% of Dems.21-34years35-44years45-54years55 yearsHats off to Gen XersCaps are most popular among the35- to 44-year-old segment. 2013 Advertising Specialty Institute . All Rights Reserved.24%14%10
Branded drinkwareis just as likely to bekept in the office asin the homeProduct Spotlight: DrinkwareDrinks inthe Desert39%MuggingOf all of the metro areas surveyed, Phoenix residentslove their logoed mugs and glasses the most.It Up36%Branded drinkware is just as likely tobe kept in the office as in the home.35-4421-3425%Consumers under 35 ownmore drinkware than theirolder counterparts.24%17%Vs.45-5455 20% 20%More womenown brandeddrinkwarethan menCampaign Cupsof consumers there ownpromotional drinkware.19%21%OF U.S.CONSUMERSOWN BRANDEDDRINKWAREDemocrats report owning more drinkware than members of otherpolitical parties.23%21%19%Independent 2013 Advertising Specialty Institute . All Rights Reserved.11
Product Spotlight: usB DrivesOF U.S. CONSUMERSOWN A LOGOEDUSB DRIVEDeep PocketsSix-figure earners aremore likely to own alogoed USB drive thanthose in othereconomic groups. 50,00010% 50,000 - 99,00012% 100,000 18%11%8%14%of Asian consumersin the U.S. own brandedUSB Drives, leading theway among all racialdemographic groups.Independent11%13%Democrat Techie?13% of democratic voters ownbranded USB drives; 8% ofRepublicans own them and11% of Independents havethem on hand.Men are More Likelyto Own a BrandedUSB Drive ThanWomen Paris27%14%Merci!Parisians are far more likely toown promotional USB drivesthan consumers in other cities:27% own them vs. 11% ofU.S. consumers.Trending YoungYounger consumersare more likely to owna promo USB drivethan their oldercounterparts. 2013 Advertising Specialty Institute . All Rights Reserved.8%13% 11% 8% 7%21-34 years35-44 years45-54 years55 years12
Product Spotlight: Health & Safety Items17%82%IT’S A TIE!17% of Berlin residentsown promotional healthand safety products, themost in Europe.of U.S. consumerscan immediatelyremember theadvertiser’s nameon the safety productthey own.17% of San Franciscansown promotional healthand safety items, the mostin the United States.9% GERMANY UNITEDSTATESOF U.S. CONSUMERSOWN PROMOTIONALHEALTH & SAFETY PRODUCTS11%14%of African Americanconsumers own brandedhealth and safety items,the most of any racialdemographic group.9%YOUTHFULCHOICES21-34 years 2013 Advertising Specialty Institute . All Rights Reserved.7%7%Consumers between21 and 34 were themost likely to own alogoed health andsafety product.35-44 years45-54 years55 years13
Product Spotlight: OuterwearOF9%In theMoneyU.S. CONSUMERSHAVE PROMOTIONAL OUTERWEARBundle Up!Outerwear recipientsthink very favorablyabout the advertiser —especially in Sydney,where 86% ofconsumers think morepositively about anadvertiser afterreceiving apromotional jacket.Total RecallJackets have the bestadvertiser recall of anypromotional product. Awhopping 95% of thosewho own logoedouterwear can recallthe advertiser’s name.48%8% 50,00095%U.S.A.Those with householdincomes above 100,000 are slightlymore likely to havebranded outerwearthan those withlower incomes.10% 50,000 – 99,00012% 100,000 To the Left10%Democrats are morelikely to have logoedjackets than membersof other political parties.7% 6%Business-BuilderIn the U.S., nearly half (48%) of all outerwear recipients saythey were more likely to do business with an advertiserafter they were given a logoed jacket. 2013 Advertising Specialty Institute . All Rights Reserved.14
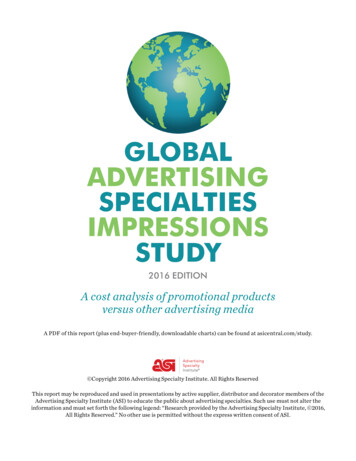
Staying PowerIn addition to identifying the logoed items they had kept, respondents were asked how long they kept the mostrecently-obtained item of each product type. On average, ad specialty items are kept for nearly seven months in theU.S. Overall, calendars are typically held the longest - about nine months on average. Writing instruments are held theshortest amount of time at just over five months. FunfactThe longest time an item was kept was in Madrid, where calendars were kept nearly 13 months. The shortest was inRome, where writing instruments were kept only 4.1 months.Number of Months Promotional Items are KeptCALENDARS9.0OUTERWEAR7.37.1DRINKWAREUSB DRIVES6.96.86.6BAGSAVERAGECAPSDESK/OFFICE ACC.SHIRTSHEALTH/SAFETYWRITING INSTRUMENTS0.0 Key2.06.06.05.85.55.34.06.08.010.0Takeaways One of the advantages promotional products have is that just one item can deliver a message for a far longer timeperiod than other forms of advertising. Advertisers can reinforce their brand or a call to action for an average ofseven months, and even longer on some products such as calendars and outerwear. Perhaps not surprisingly, calendars are kept for a long period. This offers advertisers obvious advantages, butbecause of their longevity, steps should be taken to keep the product noticed. For example, a changing image eachmonth is key; so is positioning an advertiser’s logo in a prominent spot on each page. 2013 Advertising Specialty Institute . All Rights Reserved.15
Promo Products are Passed AlongSince the study was first conducted in 2008, U.S. recipients of ad specialties are increasingly passing them along,extending the advertisers’ reach. In fact, 63% of respondents in the U.S. said that when they receive a logoed itemthey no longer wish to keep, they give it to someone else. Canadian and Australian respondents were more likely togive an item to someone else (64%) than any other group examined. FunfactGermans are the most likely to discard promotional products they no longer wish to keep; 28% disposed of them ascompared to 17% in the U.S. Consumers in London are the least likely to throw away promotional arisBerlinRomeMadridSydneyThrow it away17%18%15%21%28%23%22%18%File the item away20%18%18%21%16%29%24%18%Give the item tosomeone else63%64%67%59%56%48%54%64%In the United States, consumers in Dallas are the mostlikely to pass along the item to someone else: 75% passalong promotional items they don’t wish to keep.Most Likely to Give an Item to Someone Else Dallas 75% KeyChicago71%70%Miami Seattle 68%Takeaways Promotional products are not simply thrown away. Items are kept because they’re useful, or given to someone whocan use them. Advertisers’ messages often go beyond the initial target. As awareness of recycling in the U.S. has become more prevalent, so has the desire to pass along unwantedpromotional products. 2013 Advertising Specialty Institute . All Rights Reserved.16
Usefulness is KeyConsumers will be much more likely to keep a promotional product that is useful, according to the survey.About eight in 10 (77%) of product recipients indicated that an item’s usefulness is the primary reason to keep it.In addition, 29% of recipients said they kept an item because it’s attractive, and 29% say they keep a promotionalproduct simply because it’s “enjoyable to have.” Interestingly, it’s nearly as important for outerwear to be attractive(60%) and enjoyable to have (51%) as it is to be useful (70%). In addition to being useful, the need for caps to be bothattractive (42%) and enjoyable to have (41%) is also high.Reasons for Keeping Products: U.S.UsefulAttractiveEnjoyableto havePoint irts64%37%36%3%USB 9%29%5%Average FunfactIn Rome, ad specialties were kept because they were attractive 35% of the time, the highest of any metro 0%Attractive29%25%33%27%31%35%32%26%Enjoyableto have29%20%23%25%21%27%20%22%Point of reference5%6%4%4%3%11%7%5% 2013 Advertising Specialty Institute . All Rights Reserved.17
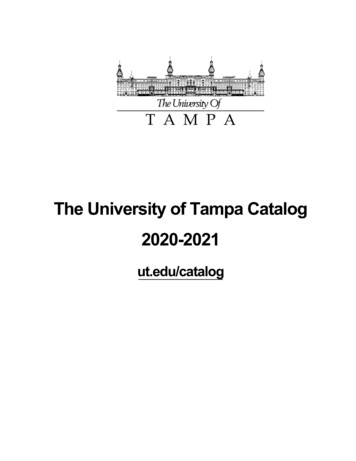
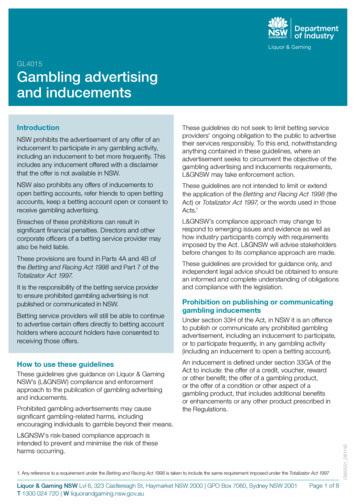
7.78.3Canada9.6 about 10 ad specialties.Typically, people haveHispanicAmericanAsianAsians haveAfricanmoreItalyad specialtiesCaucasianthan any other group.9.1Who owns the most ad specialties?Typically, peopleFrance have about 10 ad specialties.average number of items owned8.1Asianshavemoread specialtiesthan any other any7.4How Many Items Do People Own?United StatesSpain7.2Females in Spain have the most ad specialties,while females in Germany have the least.In the study, respondents7.7were asked how many logoed items they currentlyhad in their homes and/or offices. heU.S.ownanaverageof9.8promotional products. The number variesResidents of Dallas own7.4accordingto U.S.city, country, gender, race, income,the most promoproducts.9.39.6age and political affiliation.ItalyUnited StatesAustraliaCanadaCanadaGermanyItaly67% 68% 70%7.8 LondonGermany67%U.KMales aged 55 own the greatest number of ad specialties .8.17.7Australia7.471% 75%7.268% 70%Own 8.5PromotionalProducts71% 75%Females in Spain have the most ad specialties,while females in Germany have the least. 50,000- 99,999Who owns themost ad specialties? 100,000 People who make:average number of items ownedUnited States9.8Own ctsOwn 10.0Own 10.8PromotionalPromotionalMales aged 55 own the greatest number of adProductsProductsIn the U.S., as income increases, so does the number of ad specialties owned.Spain10.8ad specialties?Who owns Ownthe most 100,000 9.9United States9.79.99.39.69.89.7 50,000 50,000 100,000 9.1does the9.1me increases, sonumber of ad specialtiesowned.- 99,9999.39.6Own 8.5Own 10.0Own8.110.88.5HispanicAfrican AmericanCaucasianAsian9.1 ProductsProductsTypically, people have about 10 ad specialties.8.58.1Asianshave more ad specialties than any other group.7.97.47.78.3owned.7.8In the U.S., as income increases, so does the number of ad specialties7.27.97.4average number of items ownedUnited y10.79.59.310.19.321-34 50,00045-5455 50,000U.S. Females- 99,999 50,0005 own the greatestnumberof ad Ownspecialties.Own8.510.0 50,000Promotional21-34ProductsOwn35-448.5 45-54PromotionalU.S. MalesProducts- 99,999Promotional55 ProductsOwn 10.0PromotionalProducts21-3435-4445-5455 9.221-3435-4445-5455 Residents of Dallas own Males aged 55 own the greatest number of athe most promoproducts.U.S. MalesU.S. Females11.29.510.310.0aged 55 own the greatest number of aMales7.210.79.3Males aged 55 own the greatest number of ad specialties. 10.310.1 100,000 LondonOwn10.8 100,000 Promotional35-4445-54ProductsOwn 10.8PromotionalU.S. FemalesProducts67%55 In the U.S., as income increases, so does the number of ad specialties owned.Males aged 55 own the greatest number of ad specialties.In the U.S., as income increases, so does the number of ad specialties 0.7 10.2People who make:21-3435-4455 8.7 Key10.7Chicago10.7Females in Spain have the most ad specialties,Germanywhile females in Germany have the least.People who make:Males10.0AustraliaFemales in Spain have the most ad specialties,while females in Germany have the least.45-5410.7 nited StatesU.KRepublicans have more ad specialtiesthan Democrats or Independents.68% 70%71% 75%9.2Republicanl 50,000- 99,999 make:LondonMiamiMiami8.3SeattleSeattleSpainPeople who make:9.1FranceDallasDallasU.K9.1Residents of Dallas own 7.2the mostpromo products.Francen Spain have the mostad specialties,emales in Germany8.5 have the least.Democrats reported having the mostpromotional items in 2012 (10.5), a changefrom the prior year. Deeper supportamongRepublicanshave more ad speciaDemocrats for President Obama thanthethan Democratsor IndependentRepublican challenger Mitt Romney could bepart of the reason why.Who owns the most ad specialties?United Statesaverage number of items ownedSpain9.8 be more successful. While promotional products are 9.9 nowing the target audience can help any marketing initiativeK11.2Italywidely valued, some groups have more than others, either by interest or opportunity.9.810.710.7 10.2Institute 2013 Advertising SpecialtyReserved.11.2. All Rights9.59.310.19.310.78.7 10.7 CanadaU.KUnited States9.710.310.09.69.2CanadaItaly18
Section Two: Recipients’ Views on AdvertisersRecipients’ Views on AdvertisersFor this section, we asked respondents whether they could identify the advertisers on the promotional items theycurrently owned. The result: Nearly nine in 10 (86%) U.S. recipients of promotional merchandise can identify theadvertiser on the item, the highest of any country in the study. As the graphic below reveals, of all major productcategories, outerwear has the highest recognition of all promotional items: 95% of respondents who have logoedouterwear can name the advertiser on the items. Overall, wearables as a whole maintain a very high advertiserawareness rate, taking the top three spots.On Average86%Rememberthe AdvertiserOwners of ad specialtiesrecall the advertiser 86%of the time. Funfact KeyTakeawaysAdvertiser awareness is high in other countries as well. In Canada, 85% of respondents can identify the advertiser.In all other countries in the study, recipients
age, race, sex and gender); reveals the cost-per-impression of top advertising specialty product categories; and shows the cost-per-impression of promotional products compared to other forms of advertising media, like radio, TV and Internet advertising. The study is conducted by ASI annually. Methodology