Transcription
Platforms and Algorithmsfor Big Data AnalyticsChandan K. ReddyDepartment of Computer ScienceWayne State Universityhttp://www.cs.wayne.edu/ reddy/http://dmkd.cs.wayne.edu/TUTORIAL/Bigdata/
What is Big Data?A collection of large and complex data sets which are difficultto process using common database management tools ortraditional data processing he four dimensions (V’s) of Big DataBig data is not just about size. Finds insights from complex,noisy, heterogeneous,streaming, longitudinal, andvoluminous data. It aims to answer questionsthat were previouslyunanswered.The challenges include capture,storage, search, sharing &analysis.
Data Accumulation !!!Data is being collected at rapid pace due to theadvancements in sensing technologies.Storage has become extremely cheap and hence no onewants to throw away the data. The assumption here is thatthey will be using it in the future.Estimates show that the amount of digital data accumulateduntil 2010 has been gathered within the next two years. Thisshows the growth in the digital world.Analytics is still lagging behind compared to sensing andstorage developments.
Why Should YOU CARE ?JOBS !!- The U.S. could face a shortage by 2018 of 140,000 to190,000 people with "deep analytical talent" and of 1.5million people capable of analyzing data in ways thatenable business decisions. (McKinsey & Co)- Big Data industry is worth more than 100 billion- Growing at almost 10% a year (roughly twice as fast asthe software business)Digital World is the future !!- The world will become more and more digital and hencebig data is only going to get BIGGER !!- This is an era of big data
Why we need more Powerful Platforms ?The choice of hardware/software platform plays acrucial role to achieve one’s required goals.To analyze this voluminous and complex data, scalingup is imminent.In many applications, analysis tasks need to produceresults in real-time and/or for large volumes of data.It is no longer possible to do real-time analysis on suchbig datasets using a single machine running commodityhardware.Continuous research in this area has led to thedevelopment of many different algorithms and big dataplatforms.
THINGS TO THINK ABOUT !!!!Application/Algorithm-level requirements How quickly do we need to get the results?How big is the data to be processed?Does the model building require several iterations or a singleiteration?Systems/Platform-level requirements Will there be a need for more data processing capability in thefuture?Is the rate of data transfer critical for this application?Is there a need for handling hardware failures within theapplication?
Outline of this TutorialIntroductionScalingHorizontal Scaling PlatformsPeer to PeerHadoopDilpreet Singh and Chandan K. Reddy,"A Survey on Platforms for Big DataAnalytics", Journal of Big Data, Vol.2,No.8, pp.1-20, October 2014.SparkVertical Scaling PlatformsHigh Performance Computing (HPC) ClustersMulticoreGraphical Processing Unit (GPU)Field Programmable Gate Array (FPGA)Comparison of Different PlatformsBig Data Analytics and Amazon EC2 Clusters
OutlineIntroductionScalingHorizontal Scaling PlatformsPeer to PeerHadoopSparkVertical Scaling PlatformsHigh Performance Computing (HPC) clustersMulticoreGraphical Processing Unit (GPU)Field Programmable Gate Array (FPGA)Comparison of Different PlatformsBig Data Analytics and Amazon EC2 Clusters
ScalingScaling is the ability of the system to adapt toincreased demands in terms of processingTwo types of scaling :Horizontal ScalingInvolves distributing work load across manyserversMultiple machines are added together toimprove the processing capabilityInvolves multiple instances of an operatingsystem on different machinesVertical ScalingInvolves installing more processors, morememory and faster hardware typically withina single serverInvolves single instance of an operatingsystem
Horizontal vs Vertical ScalingScalingAdvantagesDrawbacksHorizontalScaling Increases performance in Software has to handle all the datadistribution and parallelsmall steps as neededprocessing complexities Financial investment toupgrade is relatively less Limited number of software areavailable that can take advantage Can scale out the systemas much as neededof horizontal scalingVerticalScaling Most of the software caneasily take advantage ofvertical scaling Easy to manage andinstall hardware within asingle machine Requires substantial financialinvestment System has to be more powerfulto handle future workloads andinitially the additionalperformance goes to waste It is not possible to scale upvertically after a certain limitDilpreet Singh and Chandan K. Reddy, "A Survey on Platforms for Big Data Analytics",Journal of Big Data, Vol.2, No.8, pp.1-20, October 2014.
Horizontal Scaling PlatformsSome prominent horizontal scaling platforms:Peer to Peer NetworksApache HadoopApache Spark
Vertical Scaling PlatformsMost prominent vertical scaling platforms:High Performance Computing Clusters (HPC)Multicore ProcessorsGraphics Processing Unit (GPU)Field Programmable Gate Arrays (FPGA)
OutlineIntroductionScalingHorizontal Scaling PlatformsPeer to PeerHadoopSparkVertical Scaling PlatformsHigh Performance Computing (HPC) clustersMulticoreGraphical Processing Unit (GPU)Field Programmable Gate Array (FPGA)Comparison of Different PlatformsBig Data Analytics on Amazon EC2 Clusters
Peer to Peer NetworksTypically involves millions of machines connected in a networkDecentralized and distributed network architectureMessage Passing Interface (MPI) is the communication schemeusedEach node capable of storing and processing dataScale is practically unlimited (can be millions of nodes)Main DrawbacksCommunication is the major bottleneckBroadcasting messages is cheaper butaggregation of results/data is costlyPoor Fault tolerance mechanism
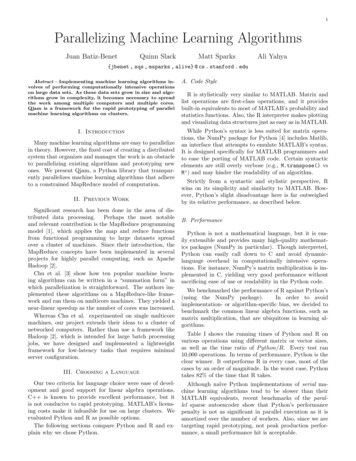
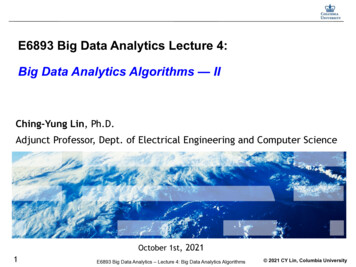
Apache HadoopOpen source framework for storing and processing large datasetsHigh fault tolerance and designed to be used with commodity hardwareConsists of two important components:HDFS (Hadoop Distributed File System)Used to store data across cluster of commodity machines whileproviding high availability and fault toleranceHadoop YARNResource management layerSchedules jobs across the cluster
Hadoop Architecture
Hadoop MapReduceBasic data processing scheme used in HadoopIncludes breaking the entire scheme into mappers and reducersMappers read data from HDFS, process it and generate someintermediate resultsReducers aggregate the intermediate results to generate the finaloutput and write it to the HDFSTypical Hadoop job involves running several mappers and reducersacross the cluster
Divide and Conquer rker”“worker”r1r2r3“Result”Combine
MapReduce WrappersProvide better control over MapReduce codeAid in code developmentPopular map reduce wrappers include:Apache PigSQL like environment developed at YahooUsed by many organizations including Twitter, AOL, LinkedInand moreHiveDeveloped by FacebookBoth these wrappers are intended to make code development easierwithout having to deal with the complexities of MapReduce coding
SparkNext generation paradigm for big data processingDeveloped by researchers at University of California, BerkeleyUsed as an alternative to HadoopDesigned to overcome disk I/O and improve performance of earliersystemsAllows data to be cached in memory eliminating the disk overheadof earlier systemsSupports Java, Scala and PythonCan yield upto 100x faster than Hadoop MapReduce
OutlineIntroductionScalingHorizontal Scaling PlatformsPeer to PeerHadoopSparkVertical Scaling PlatformsHigh Performance Computing (HPC) clustersMulticoreGraphical Processing Unit (GPU)Field Programmable Gate Array (FPGA)Comparison of Different PlatformsBig Data Analytics and Amazon EC2 Clusters
High Performance Computing (HPC) ClustersAlso known as Blades or supercomputers with thousands of processingcoresCan have different variety of disk organization and communicationmechanismsContains well-built powerful hardware optimized for speed andthroughputFault tolerance is not critical because of top quality high-end hardwareNot as scalable as Hadoop or Spark but can handle terabytes of dataHigh initial cost of deploymentCost of scaling up is highMPI is typically the communication scheme used
Multicore CPUOne machine having dozens of processing coresNumber of cores per chip and number of operations a core canperform has increased significantlyNewer breed of motherboards allow multiple CPUs within a singlemachineParallelism achieved through multithreadingTask has to be broken into threads
Graphics Processing UnitSpecialized hardware with massively parallel architectureRecent developments in GPU hardware and programmingframeworks has given rise to GPGPU (general purpose computingon graphics processing units)Has large number of processing cores (typically around 2500 currently)Has it’s own DDR5 memory which is many times faster than typicalDDR3 system memoryNvidia CUDA is the programming frameworkwhich simplifies GPU programmingUsing CUDA, one doesn’t have to deal withlow-level hardware detailsto
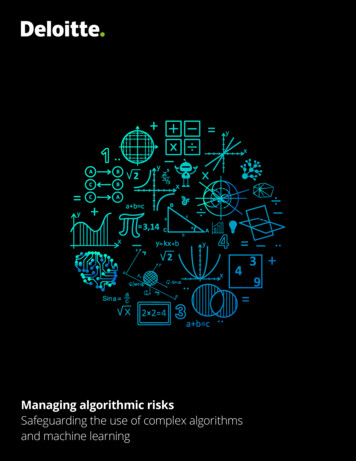
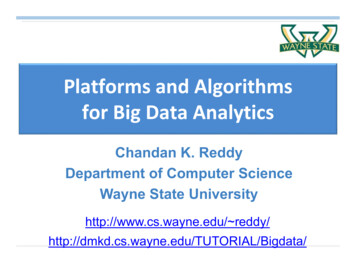
CPU vs GPU Architecture
CPU vs GPUDevelopment in CPU is rather slow as compared with GPUNumber of cores in CPU is still in double digits while a GPU canhave 2500 coresProcessing power of a current generation CPU is close to 10Gflops while GPU can have close to 1000 Gflops of computingpowerCPU primarily relies on system memory which is slower than theGPU memoryWhile GPU is an appealing option for parallel computing, thenumber of softwares and applications that take advantage of theGPU is rather limitedCPU has been around for many years and huge number ofsoftware are available which use multicore CPUs
Field Programmable Gate Arrays (FPGA)Highly specialized hardware unitsCustom built for specific applicationsCan be highly optimized for speedDue to customized hardware, development cost is much higherCoding has to be done in HDL (Hardware Description Language)with low level knowledge of hardwareGreater algorithm development costSuited for only certain set of applications
OutlineIntroductionScalingHorizontal Scaling PlatformsPeer to PeerHadoopSparkVertical Scaling PlatformsHigh Performance Computing (HPC) clustersMulticoreGraphical Processing Unit (GPU)Field Programmable Gate Array (FPGA)Comparison of Different PlatformsBig Data Analytics and Amazon EC2 Clusters
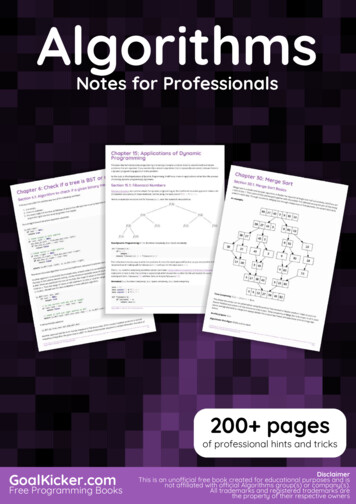
Comparison of Different PlatformsFollowing characteristics are used for comparison:System/Platform dependentScalabilityData I/O performanceFault toleranceApplication/Algorithm dependentReal-time processingData size supportSupport for iterative tasksComparison is done using the star ratings5 stars correspond to highest possible rating1 star is the lowest possible rating
Comparison of Big Data formScalabilityData eal‐TimeProcessingData SizeSupportedIterativeTask SupportPeer to Peer(TCP/IP) Virtual Clusters(MapRedce/MPI) Virtual Clusters(Spark) HPC Clusters(MPI/Mapreduce)Multicore(Multithreading) GPU(CUDA) FPGA(HDL) Dilpreet Singh and Chandan K. Reddy, "A Survey on Platforms for Big Data Analytics",Journal of Big Data, Vol.2, No.8, pp.1-20, October 2014.
ScalabilityAbility of the system to handle growing amount of work load in a capable manner or to beenlarged to accommodate that growth.It is the ability to add more hardware to improve the performance and capacity of the mScalabilityPeer to Peer(TCP/IP) Virtual Clusters(MapRedce/MPI) Virtual Clusters(Spark) HPC Clusters(MPI/Mapreduce) Multicore(Multithreading) GPU(CUDA) FPGA(HDL) Highly scalable and it is relatively easy to addmachines and extend them to any extentCan only scale up to a certain extentLimited number of GPUs and CPUs in a singlemachineOnce deployed, scaling up becomes costly
Data I/O PerformanceThe rate at which the data is transferred to/from a peripheral device. In the context of bigdata analytics, this can be viewed as the rate at which the data is read and written to thememory (or disk) or the data transfer rate between the nodes in a ormData I/OPeer to Peer(TCP/IP) Disk access and slow network communicationVirtual Clusters(MapRedce/MPI) Slower disk accessVirtual Clusters(Spark) HPC Clusters(MPI/Mapreduce) Multicore(Multithreading) GPU(CUDA) FPGA(HDL) Uses system memory; minimizes disk accessUses system memory; usually within a singlemachineUse DDR5 memory which is faster thansystem memory
Fault ToleranceThe characteristic of a system to continue operating properly in the event of a failure ofone or more tformFault TolerancePeer to Peer(TCP/IP) Virtual Clusters(MapRedce/MPI) Virtual Clusters(Spark) HPC Clusters(MPI/Mapreduce) Multicore(Multithreading) GPU(CUDA) FPGA(HDL) Have no fault tolerance mechanism and use ofcommodity hardware makes them highlysusceptible to system failuresHave in-built efficient fault tolerance mechanismAlthough these platforms do not have state-ofthe-art fault tolerance mechanisms, thesehave most reliable and well-built hardwarewhich makes hardware failure an extremelyrare event
Real‐Time ProcessingThe system’s ability to process the data and produce the results strictly within certaintime atformReal‐TimePeer to Peer(TCP/IP) Virtual Clusters(MapRedce/MPI) Virtual Clusters(Spark) HPC Clusters(MPI/Mapreduce) Multicore(Multithreading) GPU(CUDA) FPGA(HDL) Slow for real-time data processing because ofnetwork overhead and commodity hardwareSlow in terms of data I/O and do not containoptimized and powerful hardwareHave reasonable real-time processingcapabilities. They have many processingcores and high memory bandwidthWell suited for real-time processing withthousands of processing cores and very highspeed memory
Data Size SupportedThe size of the dataset that a system can process and handle atformData SizePeer to Peer(TCP/IP) Virtual Clusters(MapRedce/MPI) Virtual Clusters(Spark) HPC Clusters(MPI/Mapreduce) Multicore(Multithreading) GPU(CUDA) FPGA(HDL) Can handle Petabytes of data and can scale outto unlimited number of nodesCan handle around several Terabytes of dataNot suited for large-scale datasets. Multicorerelies on system memory which can only be upto few hundred Gigabytes. Similarly, GPU haslimited on-board memory.
Iterative Task SupportThis is the ability of a system to efficiently support iterative tasks. Since many of the dataanalysis tasks and algorithms are iterative in nature, it is an important metric to comparedifferent platforms, especially in the context of big data formIterative TasksPeer to Peer(TCP/IP) Virtual Clusters(MapRedce/MPI) Virtual Clusters(Spark) HPC Clusters(MPI/Mapreduce) Multicore(Multithreading) GPU(CUDA) FPGA(HDL) P2P has huge network communicationoverhead; MapReduce has disk I/O overheadReduces the disk I/O overheadAll these other platforms are suited for iterativeprocessing. All the iterative algorithms cannotbe easily modified for each of these platforms
OutlineIntroductionScalingHorizontal Scaling PlatformsPeer to PeerHadoopSparkVertical Scaling PlatformsGraphical Processing Unit (GPU)MulticoreHigh Performance Computing (HPC) clustersField Programmable Gate Array (FPGA)Comparison of Different PlatformsBig Data Analytics and Amazon EC2 Clusters
K‐Means and K‐NN AlgorithmsImplementations Available athttp://dmkd.cs.wayne.edu/TUTORIAL/Bigdata/
K‐MEANS CLUSTERING ALGORITHM
Basic K‐Means Algorithm
Basic K‐Means Clustering AlgorithmInput: Dataset D, Number of clusters kOutput: Data points with cluster memberships1: Initialize random k training data points as centroids2: Do3: Compute the distance between each point in D and each point in centroids4: Sort distances for each data point5: Associate data points to the nearest centroid6: Recompute the centroids7: While No changes in cluster membershipStarts by initializing the cluster centroidsEach data point is associated with the nearest centroid in the step 2In Step 3, centroids are recalculatedStep 2 and Step 3 are repeated until the centroids converge or till predefinednumber of iterations
Data Clustering: Algorithms & ApplicationsCovers recent advances in Data ClusteringSurvey Chapters from prominent researchersFeature Selection for ClusteringDocument ClusteringProbabilistic Models for ClusteringClustering Multimedia DataPartitional/Hierarchical ClusteringTime Series Data ClusteringDensity Based ClusteringClustering Biological DataGrid-based ClusteringNetwork ClusteringNMF for ClusteringUncertain Data ClusteringSpectral ClusteringVisual & Interactive ClusteringClustering High Dimensional DataSemi-Supervised ClusteringData Stream ClusteringAlternative ClusteringBig Data ClusteringCluster EnsemblesClustering Categorical DataClustering Validation
K‐Means Clustering on Different PlatformsMost popular and widely used clustering algorithmContains critical elements that can demonstrate the abilityof various platformsCharacteristics include:Iterative nature of the algorithm wherein the currentiteration results are needed before proceeding to thenext iterationCompute-intensive task of calculating the centroidsfrom a set of data pointsAggregation of the local results to obtain a globalsolution when the algorithm is parallelized
K‐Means GPU PseudocodeInput: Dataset D, Number of clusters kOutput: Data points with cluster memberships1: Initialize first k data points as centroids2: For iteration 1 to MaxIterations do3: Copy D and centroids to GPU shared memory. Split D into threads4: Kernel process: Compute distance between point in D and each point incentroids5: Send the distances to CPU6: CPU process: Sort distances for each data point7: CPU process: Associate each data point to closest centroid8: CPU process: Recompute the centroids9: end For
K‐Means on GPUStep 4:6:process:Sortdistancesforeachdata point3:1: CPU5:InitializeCopyKernelSendtheD process:anddistancesfirstcentroidsk dataComputetopointsCPUto itinDDintothreadsandeachpointin centroidsStep7: CPUprocess:Associate each data point to closest centroidStep 8: CPU process: Recompute the centroids
K‐Means Multicore CPU PseudocodeInput: Dataset D, Number of clusters kOutput: Data points with cluster memberships1: Initialize first k data points as centroids2: For iteration 1 to MaxIterations do3: Split D into multiple cores4: Compute distance between each point in D and each point in centroids5: Send distances to central core6: Sort distances for each data point7: Associate each data point in D with the nearest centroid8: Recompute the centroids9: end For
K‐Means on Multicore CPUStep 6:1: nt in D andeach pointStep7: Associatein centroidseach data point in D with the nearest centroidStep 8: Recompute the centroids
K‐Means Mapreduce PseudocodeInput: Dataset D, centroidsOutput: Data points with cluster memberships1: For iteration 1 to MaxIterations do2: Mapper: Read D and centroids from HDFS3: Mapper: Compute the distance between each point in D and each point in centroids4: Mapper Output: Key‐value pairs with key as centroid id and value as data point idand distance between them5: Shuffle and Sort: Aggregate for each key (centroid)6: Reducer: Sort distances and associate data points to the nearest centroid7: Reducer: Recompute the centroids8: Reducer Output: Write centroids to HDFS9: end ForMapper reads the data and centroid from the diskMappers assign data instances to clusters and compute new local centroids and clustersizesReducers aggregate the local centroids and write the data to the disk for the next iterationThis shows the disk I/O bottle neck for MapReduce in case of iterative tasks
K‐Means on ataStep 5:2: eadComputefor eachD s(centroid)frombetweenwithto HDFSHDFSkeyeachaspointscentroidpointtointheidD andvalueeach pointascentroiddatain centroidspoint id and distance between themnearestStep 7: Reducer: Recompute the centroids
K‐Means Spark PseudocodeInput: Dataset D, Number of clusters kOutput: Data points with cluster memberships1: Read D from HDFS as RDD2: Initialize first k data points as centroids3: For iteration 1 to MaxIterations do4: Compute distance between each point in D and each point in centroids5: For each data point group distances6: Associate data points to their closest centroid7: Recompute the centroids8: end ForK-Means implementation on Spark is similar to K-Meansimplementation on MapReduceOnly difference being instead of writing the global centroids to thedisk, they are written to the system memory insteadData points are also loaded in the system memory for faster access
K‐Means on SparkStep 4:1: ComputeRead D fromdistanceHDFSbetweenas RDD each point in D and each point inStep 2: Initialize first k data points as centroidscentroidsStep 5: For each data point group distancesStep 6: Associate data points to their closest centroidStep 7: Recompute the centroids
K‐NEAREST NEIGHBOR ALGORITHM
Basic K‐NN AlgorithmInput: Train Data D, Test Data X, Number of nearest neighbors kOutput: Predicted class labels of X1: Compute the distance between each di D and each xj X2: For each test instance sort the distances3: Take first k train data points as nearest neighbors4: Assign the most frequent class label from nearest neighbors as predictedclass label
K‐NN GPU PseudocodeInput: Train Data D, Test Data X, Number of nearest neighbors kOutput: Predicted class labels of X1: Copy D and X to the GPU shared memory. Split D into threads2: Kernel 1: Compute the distance between each di D and each xj X3: Send the distances to CPU4: Copy distances to GPU shared memory, split into threads5: Kernel 2: Sort distances for each test instance6: Send indices of k nearest neighbors to CPU7: CPU Process: Assign most frequent class label from nearest neighbors aspredicted class label
K‐NN on GPUStep 7:1: CPU2:3:4:5:6:CopyProcess:KernelSendindicestheD mdDi intothreadsDnearestandthreadseachneighborsxj Xas predicted class label
K‐NN MultiCore CPU PseudocodeInput: Train Data D, Test Data X, Number of nearest neighbors kOutput: Predicted class labels of X1: Split D into multiple cores2: Calculate the distance between each di D and each xj X3: Send distances to central core4: Split the distances into multiple cores5: For each test instance sort the distances6: Send indices of k nearest neighbors to central core7: Assign most frequent class label from nearest neighbors as predicted class
K‐NN on MultiCore CPUStep 7:1: tofinstancedistancetok tcentral D andcoreneighborseach xj Xaspredicted class label
K‐NN MapReduce PseudocodeInput: Train Data D, Test Data X, Number of nearest neighbors kOutput: Predicted class labels of X1: Mapper: Read D and X from HDFS2: Compute the distance between each di D and each xj X3: Mapper Output: Key‐value pairs with key as test instance Id and value astrain instance ID and the distance between them4: Shuffle and Sort: Aggregate for each key (test instance)5: Reducer: Sort the distances and take first k train instances as nearestneighbors6: Reducer: Take majority voting of class labels of nearest neighbors7: Reducer Output: Class labels of test instances
K‐NN on MapReduceStep 5:1: er:Output:Output:ReadSorttheSort:distancetheD Key‐valueandClassAggregatedistancesX betweenfromlabelspairsforandHDFSof straintesteachinstance)instancetrain Idandinstancesvalue asas nearesttrain instanceneighborsID and the distance between themStep 6: Reducer: Take majority voting of class labels of nearestneighbors
K‐NN Spark PseudocodeInput: Train Data D, Test Data X, Number of nearest neighbors kOutput: Predicted class labels of X1: Read X as RDDX and D from HDFS2: Broadcast D to all the worker nodes3: Calculate the distance between each point in RDDX and D as RDDdistance4: Find the indices of k smallest distances as nearest neighbours5: Assign most frequent class label from nearest neighbours as predicted classlabel6: Write predicted class labels to HDFS
K‐NN on SparkStep 2: Broadcast D to all the worker nodesStep 3: Calculate the distance between each point in RDDX and D asRDDdistanceStep 4: Find the indices of k smallest distances as nearest neighboursStep 5: Assign most frequent class label from nearest neighbours aspredicted class labelStep 6: Write predicted class labels to HDFS
Amazon Web Services
Amazon EC2Amazon Elastic Compute Cloud (Amazon EC2) is a web service thatprovides resizable compute capacity in the cloud.Designed to make web-scale computing easier for developers.Simple web service interface allows you to obtain and configure capacitywith minimal friction.Provides you with complete control of your computing resources and letsyou run on Amazon’s proven computing environment.Reduces the time required to obtain and boot new server instances tominutes, allowing you to quickly scale capacity, both up and down, as yourcomputing requirements change.Changes the economics of computing by allowing you to pay only forcapacity that you actually use.Provides developers the tools to build failure resilient applications andisolate themselves from common failure scenarios.
BenefitsElastic Web-Scale ComputingEnables you to increase or decrease capacity within minutes.You can commission thousands of server instances simultaneously.Applications can automatically scale itself up and down depending on its needs.Completely ControlledYou have root access to each instanceYou can stop your instance while retaining the data.Instances can be rebooted remotely using web service APIs.You also have access to console output of your instances.Flexible Cloud Hosting ServicesYou have the choice of multiple instance types, operating systems, and software packages.It allows you to select a configuration of memory, CPU, instance storage, and the bootpartition size that is optimal for your choice of operating system and application.ReliableThe service runs within Amazon’s proven network infrastructure and data centers.The Amazon EC2 Service Level Agreement commitment is 99.95% availability for eachAmazon EC2 Region.
BenefitsSecureAmazon EC2 works in conjunction with Amazon VPC to provide security and robust networkingfunctionalityInstances are located in a Virtual Private Cloud (VPC) with an IP range that you specify.You decide which instances are exposed to the Internet and which remain private.Security Groups and networks ACLs allow you to control inbound and outbound networkaccess.You can provision your EC2 resources as Dedicated Instances. Dedicated Instances areAmazon EC2 Instances that run on hardware dedicated to a single customer for additionalisolation.InexpensivePay only for what is used, without up-front or long-term commitmentsOn-Demand Instances let you pay for compute capacity by the hour with no long-termcommitments.Reserved Instances give you the option to make a low, one-time payment for each instanceand in turn receive a significant discount on the hourly charge for that instance.Spot Instances allow customers to bid on unused Amazon EC2 capacity and run thoseinstances for as long as their bid exceeds the current Spot Price.Easy to StartChoosing preconfigured software on Amazon Machine Images (AMIs), you can quickly deploysoftwares to EC2 via 1-Click launch or with the EC2 console.
Using EC2 ServicesInstances are priced depending upon the configurationsInstanceTypeUsageUse casesPrice rangeT2GeneralPurposeDevelopment environments, build servers, coderepositories, low-traffic web applications, early productexperiments, small databases. 0.013 - 0.520per hourM3GeneralPurposeSmall and mid-size databases, backend servers for SAP,Microsoft SharePoint 0.070 - 0.560per hourC3ComputeOptimizedHigh performance front-end fleets, web-servers, ondemand batch processing, distributed analytics, highperformance science and engineering applications, adserving, batch processing and distributed analytics. 0.105 - 1.680per hourR3MemoryOptimizedHigh performance databases, distributed memory caches, 0.175 - 2.800per hourin-memory analytics, genome assembly and analysis,larger deployments of SAP, Microsoft SharePoint, andother enterprise applications.G2GPUGame streaming, video encoding, 3D applicationstreaming, GPGPU, and other server-side graphicsworkloads. 0.650 per hourI2StorageOptimizedNoSQL databases, scale out transactional databases,data warehousing and cluster file systems. 0.853 - 6.820per hour
EC2 Best PracticesMake sure you
Big data is not just about size. Finds insights from complex, noisy, heterogeneous, streaming, longitudinal, and voluminous data. It aims to answer questions that were previously unanswered. The challenges include capture, storage, search, sharing & The four dimensions (V’s) of Big Data analysis.