Transcription
Analysis of Wheel Wear andForecasting of Wheel Life forTransit Rail Operations:A Big Data AnalysisPresented by: Kyle EbersoleUniversity of DelawareDepartment of Civil & Environmental EngineeringOctober 16, 2018
INTRODUCTION Under the UTC RailTeam, a Big Data analysis of transit vehicle wheel wear was performed Data was provided by NYCT as part of the NYCT’s Integrated Wheel/Rail Characterization andSafety project– FTA sponsored program for the implementation of advanced wheel, track, and truckmeasurement and analytics systems.– NYCT team included KLD Labs, NRC Canada, Dayton T. Brown, Plasser American,Wayside Inspection Devices, and Instrumentation Services Inc.– The University of Delaware (UD) provided an independent third-party analysis. With UTC sponsorship, UD looked at the data collected from the perspective of potential forapplication of Big Data analytics to provide an enhanced analysis.– Focus was on wheel wear data analysis– Forecasting of wheel maintenance and replacement cycles1
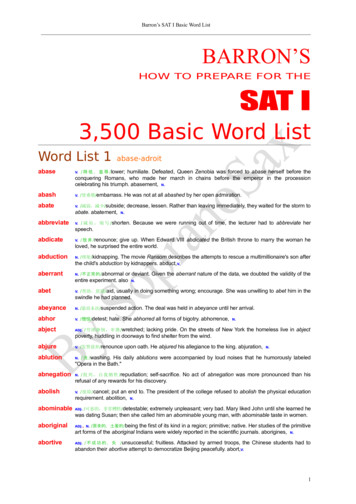
BACKGROUND Primary focus was to study the wear rate of wheels in the NYCT 7 Line fleet.Wheel profile measurements were made available from a KLD AutomaticWheelScan system.Based UD’s analysis of NYCT’s current truing standards:– NYCT is truing primarily to maintain flange thickness.– Wheel truing* occurs when the flange thickness is measured at 24.2mm.– A new or recently trued wheel will have a flange thickness of 32.1 mm.– When a wheel is trued, the rim thickness decreases . Eventually, therim thickness can no longer be decreased and the wheel has to bereplaced (new wheel is installed).* Wheel truing is a machining operation performed in the car shop to reshapethe profile of the wheel and extend its service lifeWheel Profile Measurements2
BACKGROUND The objective of this study was to:– Analyze the wear rates of the NYCT transit vehicle wheels.– Utilize this wear rate to predict wheel life.– Identify wheels that have “excessively” high rates of wheel wear. These forecasts and projections will allow for an assessment of the performanceof NYCT’s vehicle fleet from a wheel wear perspective, and perhaps examinecurrent NYCT maintenance standards to see if they can be further optimized.3
DATA SET AND PRELIMIARY ANALYSIS The NYCT 7 Line fleet consisted of nearly 500 cars and 4,000 wheels, each ofwhich was measured each time it passed the WheelScan (several times a week).– Each car was equipped with an RFID tag, so individual wheels and theirassociated wear data could be identified. Dataset contained all measurements from June 1, 2017 – April 30, 2018. Dataset consisted of over 140,000 data points.– Each data point represented one full set of wheel measurements. In order to best to understand the data that is being worked with, preliminaryanalysis included Exploratory Data Analysis (EDA)– EDA provides a preliminary assessment of the data to identify potentialrelationships within the dataset.4
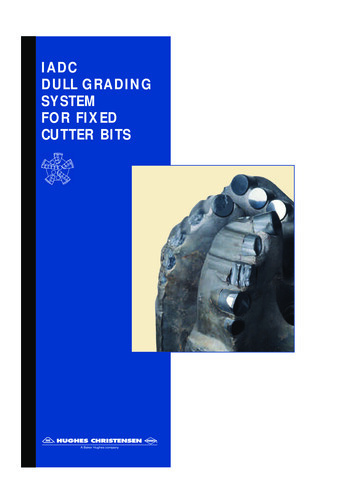
EXPLORATORY DATA ANALYSISPlot of Wheel Measurements for Car 7228, Axle 1, Left WheelHistogram of Rim Thickness5
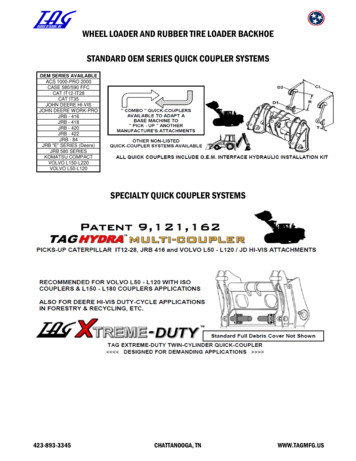
CALCULATION OF WEAR RATES Exponential regression was used.𝑦𝑦 𝐴𝐴𝑒𝑒 𝑘𝑘𝑘𝑘Where: y flange thickness (mm)A constant (mm)k wear rate (1/days)x time (days) Regression analysis model applied to each of thePlot of Flange Thickness for Car 7502, Axle 1, Right Wheel4000 wheels in the fleet.– Population of A and k values obtained6
RESULTS The following analyses were conducted in order to assess the performance ofthe NYCT’s vehicle fleet from a wheel wear perspective and examine currentNYCT maintenance standards to see if they can be further optimized:a. Forecasting Future Maintenance Eventsb. Analysis of Wheels with Known Lives (maintenance cycles)c. Examination of the Current Truing Processd. Investigation of Individual Wheels7
FORECASTING FUTURE MAINTENANCE EVENTS𝑥𝑥 𝑦𝑦ln( ��𝑡𝑡𝑡)𝐴𝐴Where:𝑘𝑘 𝑦𝑦ln( 𝑙𝑙𝑙𝑙𝑙𝑙𝑙𝑙)𝐴𝐴𝑘𝑘x time to reach the flange thickness threshold (days)A constant (mm)k wear rate (1/days)ythreshold 24.2 mmylast the last recorded flange thickness measurement (mm)Histogram of Last Recorded FlangeThickness (mm)Histogram of Last Predicted Wheel Life(days)ISSUE:Some wheels had too fewdata points andcorresponding poor R2valuesSOLUTION:Only wheels with 10 ormore data points and an R2greater than 0.50 were used8
FORECASTING FUTURE MAINTENANCE EVENTSPlot of Last Recorded Flange Thickness vs. Predicted Wheel Life9
ANALYSIS OF WHEELS WITH KNOWN LIVESWheels are being trued too early!Histogram of Wheel Life for Predicted (red) and Known (blue) Wheels10
EXAMINATION OF THE CURRENT TRUING PROCESS On average, wheels are being trued whenHistogram of All Known Last Flange Thicknesses (mm)their flange thickness is 27.9 mm– 3.7 mm wasted May be due to the fact that all four wheels ofa truck are trued whenever one wheel firstreaches the maintenance limit. Thus, theremaining three wheels would all have higherflange thicknesses. May be more cost effective to true on an axle( 2 wheel) rather than truck (4 wheel) basis Look at allowing “first” wheel to continue towear prior to truing.– Is this a safety issue?11
EXAMINATION OF THE CURRENT TRUING PROCESSComparison of Predicted Wheel Lives (mm)12
INVESTIGATION OF INDIVIDUAL WHEELSPlot of Last Recorded Flange Thickness vs. Predicted Wheel Life withPerformance Bands13
CONCLUSIONS The objective of this study was to assess NYCT’s current wheel maintenance procedures,based on analysis of the wear rates of the wheels. Based on the analyses presented, the following conclusions can be made:– Exponential regression is appropriate for calculating the wear rate of these wheels.– NYCT may be truing their wheels too early. Altering these practices may prove to beeconomically advantageous.– There is a subpopulation of wheels that exhibits very high rate of flange wear and assuch can be classified as “bad actors”. It is of practical significance to be able to identifyand understand these bad actor wheels, so that they may be more regularly inspectedand maintained.14
FUTURE WORK Based on the results of this study, there is an opportunity for furtherwork:– Incorporation of data from other measurement systems, such as angleof attack and L/V measurements.– Use of alternate regression models such as bilinear regression– Isolating and analyzing the wheels that are controlling maintenance.– Applying advanced statistical and big data techniques to better createthe wheel performance bands.15
ACKNOWLEDGEMENTSSpecial thanks to the following parties for their assistance throughout this study: University of Delaware Faculty: Dr. Allan Zarembski, Mr. Joe Palese, Dr. Nii Attoh-Okine New York City Transit Authority Federal Transit Administration United States Department of Transportation KLD Labs, NRC Canada, Dayton T. Brown, Plasser American, Wayside InspectionDevices, and Instrumentation Services Inc. UTC RailTeam16
THANK YOU!ANY QUESTIONS?17
2 BACKGROUND Primary focus was to study the wear rate of wheels in the NYCT 7 Line fleet. Wheel profile measurements were made available from a KLD Automatic WheelScan system. Based UD’s analysis of NYCT’s current truing standards: –NYCT is truing primarily to maintain flange thickness. –Wheel tru