Transcription
California Environmental Protection AgencyAir Resources BoardStaff Report: Calculating Life Cycle CarbonIntensity Values of Transportation Fuelsin CaliforniaIndustrial Strategies DivisionTransportation Fuels BranchFuels Evaluation SectionMarch 2015
This Page Left Intentionally Blank
State of CaliforniaAIR RESOURCES BOARDStaff Report: Calculating Life Cycle Carbon Intensityof Transportation Fuels in CaliforniaPrepared By:Wes Ingram, Manager, Fuels Evaluation SectionTransportation Fuels BranchReviewed By:Sam Wade, Chief, Transportation Fuels BranchIndustrial Strategies DivisionMarch 2015
This Page Left Intentionally Blank
TABLE OF CONTENTSI. INTRODUCTION . 1A. Low Carbon Fuel Standard . 1B. Fuel Carbon Intensity . 2C. California Greenhouse Gases, Regulated Emissions, and Energy Use inTransportation Model . 3D. Peer Review Documents and Materials . 4II. ASSUMPTIONS AND INPUTS . 5A. Tier 1 and Tier 2 Fuels . 9III. RESULTS . 13IV. CONCLUSION . 16V. REFERENCES . 17APPENDIX A. Notice of Intent and Request Memorandum for Peer Review. .A-1
TWU.S. EPAVOCWTTWTWArgonne National LaboratoryAir Resources BoardCalifornia Greenhouse Gases, Regulated Emissions, and EnergyUse in Transportation ModelCarbon IntensityCarbon MonoxideCarbon DioxideGreenhouse GasLife Cycle AnalysisLow Carbon Fuel StandardLife Cycle InventoryNitrous OxideNational Renewable Energy LaboratoryTank-to-WheelsUnited States Environmental Protection AgencyVolatile Organic CompoundWell-to-TankWell-to-Wheelsii
I. INTRODUCTIONStaff of the Air Resources Board (ARB or Board) prepared three reports for externalscientific peer review entitled:1. Staff Report: Calculating Life Cycle Carbon Intensity Values of TransportationFuels in California2. Staff Report: Calculating Carbon Intensity Values of Crude Oil Supplied toCalifornia Refineries3. Staff Report: Calculating Carbon Intensity Values from Indirect Land UseChange of Crop-Based BiofuelsThese reports describe staff’s methodology for calculating fuel carbon intensity (CI) withthe use of life cycle greenhouse gas (GHG) emissions models. CI is a measure of theGHG emissions per unit of energy of fuel and is measured in units of grams of carbondioxide (CO2) equivalent emissions per megajoule of fuel energy (gCO2e/MJ). Inpreparing each report referenced above, staff used the following model(s) to calculateCI values, respectively:1. California Greenhouse Gases, Regulated Emissions, and Energy Use inTransportation (CA-GREET) Model2. Oil Production Greenhouse Gas Emissions Estimator (OPGEE) Model3. Global Trade Analysis Project (GTAP-BIO) Model combined with theAgro-Ecological Zone Emissions Factor (AEZ-EF) ModelThis staff report is one of the three reports submitted for peer review. This reportprovides staff’s methodology for calculating direct life cycle CI values and use of theCA-GREET model.A.Low Carbon Fuel StandardThe determination of fuel CI is fundamental to the reporting and compliancedetermination provisions of the Low Carbon Fuel Standard (LCFS). ARB is proposingto re-adopt the LCFS regulation and to include updates and revisions to the previousregulation. The Staff Report: Initial Statement of Reasons for Proposed Rulemaking.Proposed Re-Adoption of the Low Carbon Fuel Standard1 (ISOR) is provided on theLCFS Regulation Rulemaking Documents webpage 015.htm.The Board approved the original LCFS regulation in April 2009 as a discrete early actionmeasure under the California Global Warming Solutions Act of 2006 (AB 32). TheBoard subsequently approved amendments to the LCFS in December 2011, which have1California Air Resources Board. December 2014. Staff Report: Initial Statement of Reasons. ProposedRe-Adoption of the Low Carbon Fuel Standard.1
been implemented since January 1, 2013. ARB brought a new LCFS regulation to theBoard for consideration in February 2015. The proposed LCFS regulation containsrevisions to the 2010 LCFS as well as new provisions designed to foster investments inthe production of low-carbon intensity fuels, offer additional flexibility to regulatedparties, update critical technical information, simplify and streamline programoperations, and enhance enforcement.The LCFS is designed to encourage the use of cleaner low-carbon fuels in California,encourage the production of those fuels, and, therefore, reduce greenhouse gas (GHG)emissions. The LCFS is performance-based and fuel-neutral, allowing the market todetermine how the carbon intensity of California’s transportation fuels will be reduced.B.Fuel Carbon IntensityA fuel pathway CI consists of the sum of the greenhouse gases emitted throughout theproduction and use life cycle of the fuel, expressed on a per-unit-of-fuel-energy basis. Itis denominated in units of gCO2e/MJ.Carbon intensity is calculated using life cycle analysis (LCA). LCA is an analyticalmethod for estimating the aggregate quantity of greenhouse gases emitted during a fullfuel life cycle. In general, the CI includes the direct effects of producing and using thefuel, as well as any “indirect” effects that may be associated with the fuel.The direct effects typically include feedstock generation or extraction, feedstockconversion to finished fuel or fuel blendstock, distribution, storage, delivery, and finaluse of the finished fuel by the end user. An LCFS CI expresses the combinedatmospheric heat-trapping effect of five GHGs: CO2, methane (CH4), nitrous oxide(N2O), volatile organic compound (VOC), and carbon monoxide (CO). Because thesegases are not equivalent in terms of their ability to trap atmospheric heat, they arestandardized to the heat-trapping capability of CO2. This standardization process isdescribed in more detail below.Some categories of GHG emissions are not captured by the LCA methodologydescribed in this chapter. Indirect emissions, such as those generated by indirect landuse change, are estimated separately and added to the direct CIs calculated in keepingwith the approach described herein.The goal of the direct fuel LCAs performed under the LCFS is to identify and quantify allmaterial and energy flows in a fuel’s life cycle, to calculate the GHG emissionsassociated with those flows, and to sum those emissions subtotals into a singlecumulative well-to-wheels CI value. The analytical framework used to conduct LCFSLCAs are described in a set of ISO standards falling in the 14000 series.22International Organization for Standardization (ISO). Environmental Management, Life CycleAssessment Series. Standards 10440, 14044, 14045, 14046, 14047, 14048, 14049, 14071, 14072, and14073.2
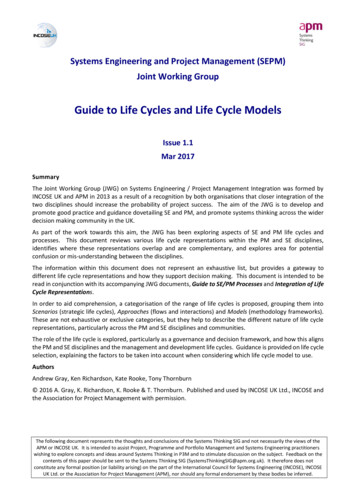
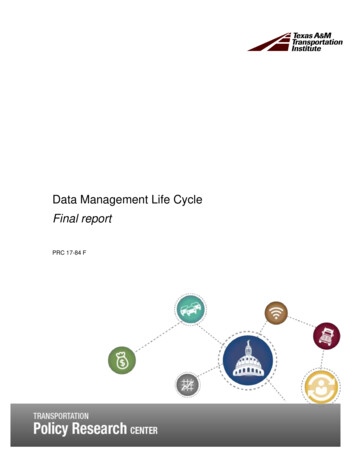
C.California Greenhouse Gases, Regulated Emissions, and Energy Usein Transportation ModelLCFS fuel pathway CIs are calculated using version 2.0 of the CA-GREET model.3As depicted in Figure 1, the direct GHG emissions from a fuel pathway are calculated inCA-GREET 2.0 as the sum of the GHG emissions from the following sequence ofprocesses: Feedstock production (e.g., production of crude for gasoline and diesel, ordigester biogas for biomethane) Feedstock transport, storage, and distribution Fuel production (e.g. gasoline refining, renewable diesel production) Production of co-products Finished fuel transport, storage, and distribution, and Fuel use in a vehicle.Figure 1: Generalized Fuel Life Cycle Analysis SchematicFeedstockProduction T&DFuelProduction DT&Co-productsFuel CarbonIntensity IndirectEffects Total DirectEffects Biofuel Use in aVehicleThe LCA phases shown in Figure 1 are typically aggregated into two main stages. Thefirst includes the series of steps that culminate in the dispensing of the finished fuel intoa vehicle’s fuel tank, battery, or other storage device. The second stage includes the3Systems Assessment Section, Center for Transportation Research, Argonne National Laboratory andCalifornia Air Resources Board Staff, 2014. California-Modified Greenhouse Gases, RegulatedEmissions, and Energy Use in Transportation Model (CA-GREET) version 2.0.3
conversion of the stored fuel energy into motive power. 4 A final LCFS well-to-wheels CIis expressed in terms of emissions per unit of fuel energy.D.Peer Review Documents and MaterialsThe peer review process was initiated on November 19, 2014, by submittal of a Noticeof Intent to the manager of the Scientific Peer Review Program. On January 21, 2015,ARB submitted a Request Memorandum for peer review. The memorandum includes asummary of the nature and scope of the requested review, descriptions of the scientificconclusions to be addressed, and list of recommended areas of expertise. The Noticeof Intent and Request Memorandum for peer review are provided in Appendix A.This staff report provides staff’s methodology for calculating direct life cycle CIs and theoverall context of the peer review. For a more detailed description of staff’s approachand information on the CA-GREET model, please refer to Chapter II, Section D;Chapter III, Section L; and Appendix C of the ISOR. As previously stated, the completeISOR and its appendices are provided on the LCFS Regulation RulemakingDocuments webpage at 5.htm.Direct links to the ISOR and Appendix C are also provided below: Staff Report: Initial Statement of Reasonso Chapter II, Section D – Pages II-9 – II-11o Chapter III, Section L – Pages III-23 – III-42 Appendix C: Comparison of CA-GREET 1.8B, GREET1 2013, andCA-GREET 2.0The CA-GREET 2.0 models and supporting documentation are provided on theCA-GREET 2.0 Model and Documentation webpage et.htm.4These two stages are often referred to as Well-to-Tank and Tank-to-Wheels. The Well-to-Tank (WTT)analysis includes all steps from recovery or production of the feedstock, to the blending and transport ofthe finished fuel to the retail service station for distribution to the vehicle tank. The Tank-to-Wheels (TTW)analysis includes the use of the fuel in an automobile. The WTT and TTW are combined to create acomplete Well-To-Wheels (WTW) analysis of a transportation fuel.4
II. ASSUMPTIONS AND INPUTSThe basis of all fuel pathway CIs under the LCFS is the life cycle inventory (LCI) datacontained in the CA-GREET 2.0 spreadsheet. LCI data quantifies the relevant energy,material, and waste flows into and out of the fuel production system. Emission factorsand process efficiencies are also used to calculate CIs. Examples of the LCI,emissions, and efficiency data found in CA-GREET 2.0 follow: Agricultural feedstock production:o Argonne National Laboratory (ANL) describes the material and energy flowsused in the six cellulosic pathways included in its GREET1 2013 model5 in a75-page document entitled “Material And Energy Flows In The Production OfCellulosic Feedstocks For Biofuels For The GREETtm Model.”6 Thisdocument draws on multiple peer-reviewed journal articles, data from the U.S.Department of Agriculture, The U.S. Department of Energy, the NationalRenewable Energy Laboratory, The U.S. Environmental Protection Agency,and other sources.o ANL provided background details on its updated LCA of sorghum ethanol in a2013 paper entitled “Life-cycle energy use and greenhouse gas emissions ofproduction of bioethanol from sorghum in the United States.”7 This paperdraws on information from a wide variety of sources, including the U.S.Department of Agriculture, the United Nations Food and AgricultureOrganization, The U.S. Environmental Protection Agency, and other peerreviewed literature.o The USDA’s Economic Research Service reported the results of a 1996survey of sorghum producers.8 This report contained information on fertilizer,farm chemical, and on-farm fuel use. Fuel Productiono The National Renewable Energy Laboratory (NREL) reported on itssimulation of the process of converting corn stover to ethanol through5Systems Assessment Section, Center for Transportation Research, Argonne National Laboratory, 2013.Greenhouse Gases, Regulated Emissions, and Energy Use in Transportation Model (GREET 1 2013).6Wang, Z. et. al. October 2013. Argonne National Laboratory. Energy Systems Division. Material andEnergy Flows in the Production of Cellulosic Feedstocks for Biofuels for the GREET Model.ANL/ESD-13/9.7Cai, H. et. al. 2013. Life-cycle energy use and greenhouse gas emissions of production of bioethanolfrom sorghum in the United States. Biotechnology for Biofuels 6:141.8U.S. Department of Agriculture, Economic Research Service. February, 1997. Farm BusinessEconomic Indicator Updates: Costs of Production, FBEI 97-1, February, 1997.5
dilute-acid pretreatment, enzymatic saccharification, and co-fermentation.9NREL’s simulation was conducted using the Aspen Plus process modelingsoftware.o The U. S. Environmental Protection Agency (U.S. EPA) published the resultsof simulations of the energy needed to produce ethanol from sorghum as partof a formal rulemaking under 40 CFR Part 80.10 These simulations werecarried out by the U.S. Department of Agriculture, and drew on priorsimulations of the corn ethanol production process. All simulations werecarried out using Aspen process modeling software.o The energy requirements of producing ethanol from sugar cane were drawnin part from an article by Seabra et al. entitled “Life cycle assessment ofBrazilian sugarcane products: GHG emissions and energy use.”11 Feedstock and Fuel TransportANL describes the updates it has made to the transportation LCI data in theGREET model in a 2013 paper.12 Revisions to the energy intensity andemissions associated with locomotives, pipelines, heavy-duty trucks,ocean-going vessels, and barges are presented. The updates are based oninformation from the U.S. Department of Transportation, the U.S. EnergyInformation Administration, The U.S. EPA, Journal articles, and other sources. Emission Factorso The U.S. EPA’s Clearinghouse for Inventories and Emission Factors (AirCHIEF) CD ROM.13 The Air CHIEF CD contains emission factors andsoftware tools designed to assist with the estimation of emissions from a widevariety of stationary and point sources. It contains Volume I of the Agency’sCompilation of Air Pollutant Emission Factors (AP-42), and the latest NationalEmission Inventory documentation for criteria and hazardous air pollutants.o ANL’s “Updated Emission Factors of Air Pollutants from Vehicle Operations inGREETTM Using MOVES.”14 This report documents ANL’s approach to9National Renewable Energy Laboratory and Harris Group. May 2011. Process Design and Economicsfor Biochemical Conversion of Lignocellulosic Biomass to Ethanol. Technical Report NREL/TP5100-47764.10U. S. Environmental Protection Agency. December 17, 2012. Supplemental Determination forRenewable Fuels Produced Under the Final RFS2 Program From Grain Sorghum. 40 CFR Part 80.11Seabra, JEA et. al. 2011. Life cycle assessment of Brazilian sugarcane products: GHG emissions andenergy use. Biofuels, Bioproducts, and Biorefing 5(5):519-532.12Dunn, J.B. et. al. October 7, 2013. Update to Transportation Parameters in GREETTM.13U.S. Environmental Protection Agency, Emission Factor and Inventory Group. 2005. Clearinghousefor Inventories and Emission Factors (Air CHIEF), Version 12.0 (on CD-ROM). EPA/454/C-05/001-CD.14Cai, H. et. al. Energy Assessment Section, Energy Systems Division, Argonne National Laboratory.September 2013.6
updating gasoline and diesel vehicle emission factors to account for changesin engine technology and fuel specifications; deterioration of emission controldevices with vehicle age; implementation of emission control inspection andmaintenance programs; and the adoption of advanced emission controltechnologies, such as second-generation onboard diagnostics (OBD II),selective catalytic reduction, diesel particulate filters, and diesel oxidationcatalysts. To best capture the effects of these factors, ANL used theU.S. EPA’s latest mobile-source emission factor model, the Motor VehicleEmission Simulator (MOVES). Previously, vehicular emission factors wereestimated using the U.S. Environmental Protection Agency’s MOBILE6.2 andthe California Air Resources Board’s EMFAC models.o The 2010 baseline tailpipe emission factors for CARBOB, CaRFG, and ULSDin the model are from the following sources. CO2 emissions for these fuelswere calculated based on the carbon content, assuming complete combustionto CO2, and corrected for carbon emitted as CH4. CH4 and N2O tailpipe emission factors for gasoline-powered light- andheavy-duty vehicles were derived from ARB’s GHG Emission Inventory.15 CH4 and N2O tailpipe emission factors for light- and heavy-duty dieselvehicles are also from ARB’s GHG Emission Inventory.16o Tailpipe emission factors for CNG-powered light- and heavy-duty trucks arefrom the U.S. Environmental Protection Agency’s Emission Inventory.17o Tailpipe emission factors for LNG-powered heavy duty LNG trucks are fromU.S. Environmental Protection Agency Emission Inventory.18 The guidelines issued by the Intergovernmental Panel on Climate Change(IPCC) on performing national greenhouse gas inventories.19 These guidelinesprovide detailed instructions on the preparation of national GHG inventories, aswell as GHG emission factors that can be used in the preparation of thoseinventories. The CA-GREET 2.0 model utilizes many of these factors (e.g., N2Oemissions from agriculture).15California Air Resources Board. May 2014. California’s 2000-2012 Greenhouse Gas EmissionsInventory Technical Support Document.16California Air Resources Board. May 2014. California’s 2000-2012 Greenhouse Gas EmissionsInventory Technical Support Document.17U.S. Environmental Protection Agency. 2014b. Emission Factors for Greenhouse Gas ocuments/emission-factors.pdf.18U.S. Environmental Protection Agency. 2014b. Emission Factors for Greenhouse Gas ocuments/emission-factors.pdf.19Eggleston, S. et. al. 2006. 2006 IPCC Gidelines for National Greenhouse Gas Inventories.Intergovernmental Panel on Climate Change.7
Emissions from the generation of grid electricity are calculated using regionalelectrical generation energy mixes (e.g., natural gas, coal, wind, etc.) from theU.S. EPA’s Emissions and Generation Resource Integrated Database (eGRID).20The CA GREET uses energy mixes from the 26 eGRID subregions.In order to calculate a single aggregate carbon intensity value for all greenhouse gasemissions occurring throughout the WTW life cycle, the atmospheric heat trappingpotential of all greenhouse gases must be expressed in standardized additive units.Under the LCFS, all greenhouse gas species other than CO2 are converted to CO2equivalent (CO2e) values. These conversions are accomplished using global warmingpotential (GWP) indices developed by the Intergovernmental Panel on Climate Change(IPCC).21 CH4 and N2O are converted to a CO2-equivalent basis using IPCC GWPvalues for inclusion in the total pathway carbon intensity. The IPCC GWP indicesfunction as multipliers: CH4 emissions, for example, are multiplied by 25. The 2007IPCC GHG CO2e values for the GHG emissions included in LCFS fuel pathways are1 for CO2, 25 for CH4, and 298 for N2O.CA GREET 2.0 assumes that VOC and CO are converted to CO2 in the atmosphere.It therefore, includes these pollutants in the total CO2 value using ratios of theappropriate molecular weights. The ratio of the molecular weight of carbon to themolecular weight of CO2 is 12/44 0.273. The CO2e values of VOCs and CO are,therefore, 0.85/0.273 3.12, and 0.43/0.273 1.57, respectively.CA-GREET 2.0 is a modified version of GREET1 2013.22 Michael Wang and his teamat ANL developed GREET1 2013. The software platform for both models is MicrosoftExcel. The process of converting ANL’s model to a California-specific version consistedprimarily of adding the necessary California-specific LCI data and emission factors. Acomprehensive list of revisions is maintained on the CA-GREET 2.0 Model andDocumentation website at .htm.Among those revisions are the following: Crude oil recovery efficiency was modified to reflect the values specific to theaverage crude used in California, including crude that is both produced in, andimported into, the State; Tailpipe CH4 and N2O emission factors were adapted for California vehicleswhere available, in light of the fact that California has stricter vehicle emissionsstandards than were assumed in developing GREET1 2013;20U.S. Environmental Protection Agency, 2014a. Emissions and Generation Resource IntegratedDatabase (eGRID); Ninth Edition, Version 1.0: 2010 data.21Solomon, S. et. al. “Climate Change 2007: The Physical Science Basis,” Technical Summary,Contribution of Working Group I to the Fourth Assessment Report of the Intergovernmental Panel onClimate Change. In: Cambridge University Press, Cambridge, UK, and New York, USA, 2007.22Systems Assessment Section, Center for Transportation Research, Argonne National Laboratory,2013. Greenhouse Gases, Regulated Emissions, and Energy Use in Transportation Model (GREET 12013).8
The U.S. EPA’s eGRID23 was the source of the grid electricity generation energymixes used in CA-GREET 2.0. An electrical energy generation mix is the mix ofenergy sources (e.g., natural gas, coal, hydroelectric dams, etc.) used togenerate the electricity provided to a regional electrical grid.A. Tier 1 and Tier 2 FuelsProposed section 95488 provides for the establishment of fuel pathways for twocategories of transportation fuels. The first—“Tier 1”—includes conventionallyproduced, first-generation fuels, and the second—“Tier 2”—includes fuels producedusing emerging technologies and/or innovative production methods such as low-CIsources of process energy. Under the Tier 1 process, applicants calculate theirpathway CIs using the custom CI calculator found in the “T1 Calculator” tab ofCA-GREET 2.0. That calculator computes pathway CIs using only the base set of inputparameters that determine a Tier 1 pathway CI. Those parameters are discussedbelow.In general, Tier 1 fuels are produced using mature production technologies and havebeen in use under the LCFS for at least three years. Tier 2 fuels have been in fullcommercial production for a relatively short period of time, and are relatively new to theLCFS.Tier 1 fuels include, but are not limited to: Starch- and sugar-based ethanol, Biodiesel produced from conventional feedstocks (including but not limited toplant oils, tallow and related animal wastes, and used cooking oil), Renewable diesel produced from conventional feedstocks (including but notlimited to plant oils, tallow and related animal wastes, and used cooking oil), Natural gas, and Biomethane from landfill gas.Tier 2 fuels include, but are not limited to: Cellulosic alcohols; Biomethane from sources other than landfill gas; Hydrogen; Electricity, whether from dedicated, low CI energy sources, or (as discussedbelow) from the public grid;23U.S. Environmental Protection Agency, 2014a. Emissions and Generation Resource IntegratedDatabase (eGRID); Ninth Edition, Version 1.0: 2010 data.9
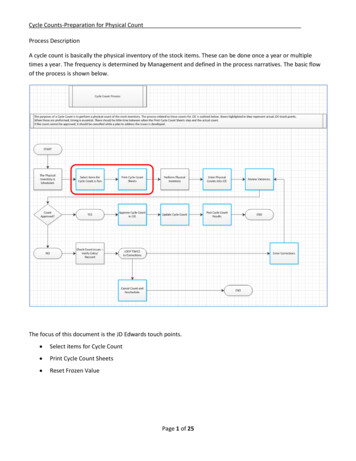
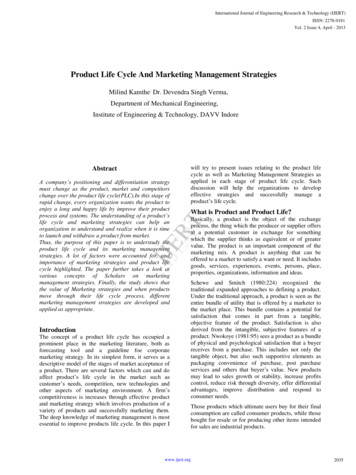
Drop-in fuels (renewable hydrocarbons, except for renewable diesel24); Tier 1 fuels produced using one or more innovative production methods.The innovative production methods that could move a Tier 1 fuel into the Tier 2 categoryinclude, but are not limited to: Use of one or more low-CI process energy sources. Innovative, low-CI energysources include, but are not limited to, the following:o Low-CI biomass, such as organic agricultural or municipal wastes;o Renewable electricity from a dedicated (non-grid) form of generation, such aswind turbines and photovoltaic arrays; Use of unconventional feedstocks such as algal oil; Carbon capture and sequestration; and Production process innovations that improve production efficiency such thatGHGs emitted per mega joule of fuel energy produced is significantly reduced.For a low-CI process energy source to qualify as an innovative method (and move a fuelpathway into the second Tier), energy from that source must be directly consumed inthe production process. No indirect accounting mechanisms, such as the use ofrenewable energy certificates, can be used to reduce an energy source’s CI.Staff developed separate application processes for Tier 1 and Tier 2 to expedite theprocessing of Tier 1 pathway applications. Figure 2 summarizes the Tier 1 and Tier 2application processes in the form of a flow diagram. Having processed numerousapplications for first-generation pathways during the initial five years of LCFSimplementation, staff is very familiar with this category of fuels. The Tier 1 processbuilds upon that familiarity by providing applicants with a more direct route to pathwaycertification. In addition to providing applicants with a simplified and accelerated routeto pathway certification, the Tier 1 process provides staff with more time to focus on thechallenges of evaluating Tier 2 applications. Under the Tier 1 process, applicantscalculate their pathway CIs using the custom CI calculator found in the “T1 Calculator”tab of CA-GREET 2.0. That calculator computes pathway CIs using only the base setof input parameters that determine a Tier 1 pathway CI. That base set includes, but isnot limited to:25 Electrical energy generation mixes for the feedstock and fuel production phases.An electrical energy generation mix is the mix of energy sources (e.g., naturalgas, coal, hydroelectric dams, etc.) used to generate the electricity provided to aregional electrical grid.24Renewable diesel is an established fuel that has been in production since before the implementation ofthe LCFS began.25Feedstock phase inputs except those associated with agriculture may be input into the Tier 1calculator. Pending the development of an LCFS agricultural auditing and certification program,agricultural inputs are invariant.10
Crude oil region. Domestic crudes receive the U.S. average CI. Foreign crudesreceive region-specific CIs. Feedstock and fuel production thermal energy sources (natural gas, coal,biomethane, etc.). Feedstock and fuel production chemical use Fuel production energy use. Fuel yield. Feedstock and fuel transport modes and distances. Co-product yields.Tier 2 applicants use CA-GREET 2.0 in much the same way that they use the currentLCFS direct CI model, CA-GREET 1.8b.26 Tier 2 applicants seeking a pathway undereither Method 2A or 2B have access to all applicable worksheets and input parametersin the CA- GREET 2.0 spreadsheet. With the exception of upstream agricultural inputsand grid electricity energy mixes, applicants must provide producer-specific inputs for allunit operations. Aside from agricultural inputs and grid electricity mixes, the defaultvalues available in CA-GREET 2.0 may not be used without Executive Officer approval.Producer-specific Input parameter choices must be adequately documented. In order tocertify a Method 2 pathway, the Executive Officer must be able to verify all CA-GREET2.0 inputs, and to replicate the pathway CI calculated by the applicant.26Systems Assessment Section, Center for Transportation Research, Argonne National Laboratory andCalifornia Air Resources Board Staff, December 2009. California-Modified Greenhouse Gases, RegulatedEmissions, and Energy Use in Transportation Model (CA-GREET) version 1.8b.11
Figure 2. Tier 1 and Tier 2 Fuel Pathway Flow DiagramLCFSTransportation Fuel PathwayCI DeterminationTier 2Tier 1CA-GREET 2.0Tier 1 Calculator used toCalculate CIs forConventional FuelsFirst Generation Fuels:Starch/sugar-basedethanolBio/renewable dieselFossil/renewable NGBiomethane fromlandfill gasTier 1orTier 2Next Generation Fuels:Cellulosic alcoholBiodiesel from algaeEthanol from straw/stoverBiomethane from otherthan landfill gas; HydrogenElectricity/low CI sourcesMethod 1Available toTier 2 onlyTier 2Lookup TablePathway CI ValueMethod 2ProducerSpecific PathwayMethod 2ABase application oncertified pathwaysubject to substantialityrequirementsMethod 2BNo reference pathwayexists; substantialityrequirements don’tapplyCA-GREET 2.0Tier 2 Model used toCalculate CIs for NextGeneration Fuels12Pathway CI Value
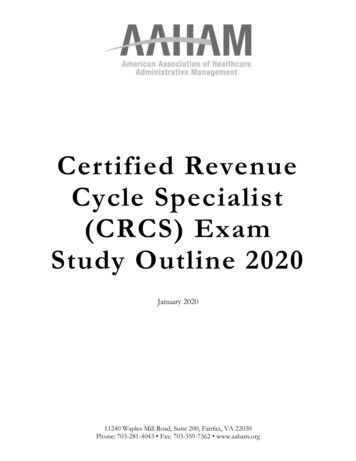
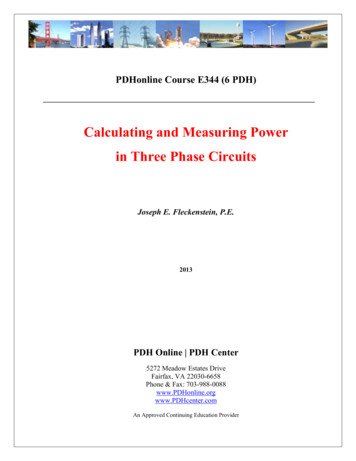
III. RESULTSUsing the CA-GREET model, CIs are calculated on a full life cycle basis. This meansthat the CI value assigned to each fuel reflects the GHG emissions associated with thefuel’s production, transport, storage, and use. As previously stated, the CA-GREETmodel accounts for direct effects only.Tables 1 and 2 from the proposed LCFS regulation provide direct life cycle CIs for asubset of regulated fuels. Table 1 includes California reformulated blendstock foroxygenate blending (CARBOB) and selected fuels that substitute for it, while Table 2includes ultra-low sulfur diesel and selected fuels that substitute for it.13
Table 1. Carbon Intensity Lookup Table for Gasoline andFuels that Substitute for Gasoline1Carbon Intensity Values(gCO2e/MJ)FuelCARBOBCompressedNatural GasElectricityHydrogen
material and energy flows in a fuel’s life cycle, to calculate the GHG emissions associated with those flows, and to sum those emissions subtotals into a single cumulative well-to-wheels CI value. The analytical framework used to conduct LCFS LCAs are describe