Transcription
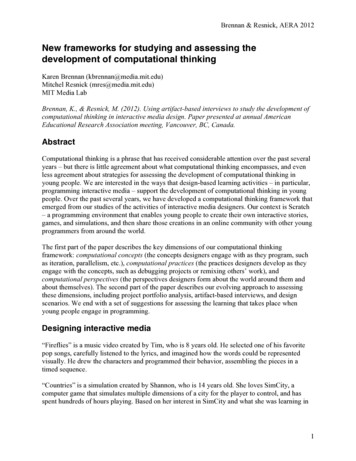
Scanalog: Interactive Design and Debugging of AnalogCircuits with Programmable HardwareEvan StrasnickStanford UniversityStanford, USAestrasni@stanford.eduManeesh AgrawalaStanford UniversityStanford, USAmaneesh@cs.stanford.eduGraphical UserInterfaceScanalog HardwareVoltage:(A) Raw signal from an analog sensorSean FollmerStanford UniversityStanford, USAsfollmer@stanford.eduVoltage:External Sensor(B) Conditioning the signal with Scanalog(C) The signal after conditioningFigure 1. Scanalog integrates reconfigurable analog hardware, programmable data capture and replay, and a high-level software interface to supportthe design and debugging phases of analog circuit work. Here, raw signals from an IR photoelectric sensor are conditioned using gain and comparatormodules to produce a clean digital output, enabling proximity sensing in interactive devices.ABSTRACTAuthor KeywordsAnalog circuit design is a complex, error-prone task in whichthe processes of gathering observations, formulating reasonable hypotheses, and manually adjusting the circuit raise significant barriers to an iterative workflow. We present Scanalog,a tool built on programmable analog hardware that enablesusers to rapidly explore different circuit designs using directmanipulation, and receive immediate feedback on the resultingbehaviors without manual assembly, calculation, or probing.Users can interactively tune modular signal transformations onhardware with real inputs, while observing real-time changesat all points in the circuit. They can create custom unit testsand assertions to detect potential issues. We describe threeinteractive applications demonstrating the expressive potentialof Scanalog. In an informal evaluation, users successfullyconditioned analog sensors and described Scanalog as bothenjoyable and easy to use.Scanalog; Scanalogue; design tools; debugging; analogcircuits; electronics; prototyping; FPAA; Field ProgrammableAnalog Array; programmable analog hardwareACM Classification KeywordsH.5.m. Information Interfaces and Presentation (e.g. HCI):MiscellaneousPermission to make digital or hard copies of all or part of this work for personal orclassroom use is granted without fee provided that copies are not made or distributedfor profit or commercial advantage and that copies bear this notice and the full citationon the first page. Copyrights for components of this work owned by others than ACMmust be honored. Abstracting with credit is permitted. To copy otherwise, or republish,to post on servers or to redistribute to lists, requires prior specific permission and/or afee. Request permissions from permissions@acm.org.UIST 2017, October 22–25, 2017, Quebec City, QC, Canada 2017 ACM. ISBN 978-1-4503-4981-9/17/10. . . 15.00DOI: NAnalog electronics are widely used to sense and act on signalsfrom the real world. For example, a light-seeking robot mightemploy analog circuits to condition signals from an photocellto sense brightness, interface those signals with digital logicusing an analog-to-digital converter, and then drive outputssuch as motors. Analog and mixed-signal stages occur inmost end-user devices, and are particularly advantageous ininteractive devices to process continuous signals with speed,precision, and low power.However, designing analog circuits is difficult for a number ofreasons. Among these are:1. Physical construction of circuits is slow and error-prone.Wiring mistakes and poor connections introduce hard-todetect bugs even in correct designs. [7].2. Real circuits often do not match simulations, e.g. due tonoise, faulty hardware, and limitations of real components.3. Changes to an analog system often propagate to affectother components, making it difficult to isolate bugs ordetect the failures of previously functional subunits. Without the ability to automatically monitor parts of the circuitwith assertions or unit tests, the user must take backtrackrepeatedly to find sources of error.
4. The inability to readily observe the internal state of thecircuit results in a slow, complex, and error-prone debugging process in which the designer manually probes withan oscilloscope to gather observations.These issues hinder the ability of designers to iteratively designand debug circuits, as each step in the iterative cycle (observing the behavior, diagnosing bugs, redesigning the circuit, andimplementing the new design) is slow and laborious [19].One technology that can address some of these difficulties isthe Field-Programmable Analog Array (FPAA). The FPAAis a programmable analog hardware platform. Much like anFPGA (Field Programmable Gate Array) enables the programming of digital logic, FPAAs utilize programmable resourcesto connect discrete analog components into a variety of circuits. An FPAA is typically accompanied by a software design tool, which lets users specify a circuit design, flash thedesign onto the board, then test the board in their physicalapplication, iterating as necessary. FPAAs address two of theaforementioned difficulties of analog circuit design: (1) Userscan rapidly make modifications to a circuit without the need tomechanically assembly components, accelerating the iterativeprocess and reducing mis-wiring errors. (2) Users can designthe circuit in tandem with real inputs, eliminating errors inmoving from simulation to application.Despite these advantages, FPAAs remain unhelpful in assisting the user to better observe and debug the behavior of theircircuit. To support an iterative workflow, we desire not onlythat the user can readily make changes using direct manipulation, but also that they can readily observe the effects ofthose changes with immediate feedback. We present Scanalog(“Scan” “Analogue”, Figure 1), an interactive, high-leveldesign tool which interfaces with an FPAA to support theprocesses of designing, building with, and understanding analog electronics. Scanalog combines rapidly programmablehardware, integrated sensing of internal signals, and arbitrarywaveform generation to address the difficulties of analog design in the following ways: Provides the user with direct manipulation of the hardwarein real-time while observing its response to real input. Thistightened feedback loop allows for rapid iteration and enables the user to "think by doing." Facilitates understanding of internal state by displayingsignals from all points in the working circuit in real-time.These visualizations provide immediate feedback of thebehavior of the entire circuit as the user makes changes. Enables the use of built-in and user-defined assertions toautomatically detect issues during design. This eliminatesthe need to manually search for the source of an error whennew modifications to the circuit impact previously functional elements. Enables the user to record real inputs and subsequently replay them through the hardware to perform unit testing. Thisaids the user in verifying the correctness of their hardwarewithout simulation or the need to repeatedly and manuallyprovide inputs.RELATED WORKCircuit Design ToolsScanalog draws from a number of tools used by experts in thedesign and prototyping of circuits. Graphical circuit designtools such as EAGLE [5], Altium Designer [2], or Fritzing [17]assist the user in adding components to and wiring a circuitschematic. Users can then lay out designs for fabricationto create functional hardware. Circuit design tools typicallyalso include simulators, such as SPICE [20], which help theuser to predict the response of their system to a variety ofconditions. Like Scanalog, many of these simulators andgraphical circuit design tools enable interactive adjustmentof circuit parameters. However, they do not operate on livesignals, and do not configure hardware that can be tested inthe context of the application.An interface designed by Victor [23] also visualizes simulatedsignals in real time throughout an interactive virtual circuit,inspiring the design of our system. Scanalog implements theseinteractions on real hardware and signals.LabVIEW [16] is a data acquisition tool that can automatethe processes of observing input signals and processing themusing a dataflow programming interface. In addition, it canbe used to program the behavior of Digital Signal Processors(DSPs). Like FPAAs, DSPs can be programmed to interface with and manipulate continuous signals in various ways.However, DSPs rely on quantizing an analog signal and manipulating it using digital logic, yielding limitations in termsof resolution, frequency range, power, etc. as compared to analog components. While LabVIEW and other data acquisitiontools can display real-time signals from the circuit similarly toScanalog, they must be manually configured with a specificprobe for each site.Finally, design tools for FPAAs such as AnadigmDesigner [4]and Cypress PSoC Creator [10] interface directly with programmable analog hardware. Their graphical user interfacesenable the user to lay out a design consisting of high-level modules, connect them together, and set their parameters. Whenfinished with the design, the user can then flash the circuit ontothe FPAA. These circuits are typically static once flashed, withthe exception of a small set of exposed parameters (e.g. gain)which the user can control by developing a custom applicationalongside their circuit. For example, using AnadigmDesigner,a user can design a circuit topology, set values for each configurable parameter, flash the FPAA, and probe the output toverify their design. Then, when the circuit requires an adjustment, the user must return to the software design, set newvalues, reprogram, and probe once more. Scanalog insteadprovides direct manipulation of the FPAA by immediatelyreflecting changes within the interface onto the hardware, andvisualizes within the interface the real-time signals passingthrough the hardware.Debugging and Prototyping in Physical Computing TasksPrior work has explored a number of techniques for moreinteractive development and debugging in electronic devicedesign. The Toastboard [12] and the Visible Breadboard [21]provide live debugging assistance while prototyping circuits
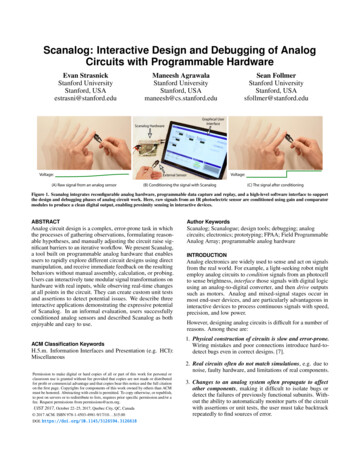
ABCDEFGHIFigure 2. Scanalog’s graphical user interface. A: Live visualizations for each module. B: Module instantiated in the workspace. C: Assertion instantiatedin the workspace. D: Tunable parameters of a module. E: Add Circuit Elements palette. F: Assertion/test palette. G: Visualization for manual probemode. H: Optional command line. I: Oscilloscope settings.on a breadboard. However, because these systems do notleverage programmable hardware, they still require users tophysically construct circuits at a manual pace. Moreoever, astools designed to debug digital applications, they are largelyunable to interpret continuous signals, making them unsuitablefor use in analog circuit design.Researchers have also developed systems that visualize theinternal behavior of a circuit. For example, LightUp, Projectron Mapping, and Flow of Electrons use augmented reality todisplay information about a circuit in-situ ([1], [8], [9]). Gamified systems like TagTiles aim to help users gain a familiaritywith electronics and their principles through play [22]. Whilepedagogically valuable, these interfaces visualize a limitedset of behaviors and do not serve as general-purpose analogcircuit design tools.Other tools have focused on helping users to more efficientlyprototype circuits. CircuitStack [25] provides breadboard-likeprototyping on top of software-designed PCB layers, combining the error-resilience of printed circuits with the flexibilityof a breadboard. Similarly Exemplar [13] and PICL [15]leverage "Programming by Demonstration" to rapidly configure microprocessors to give desired outputs in response tosensor data. Finally, toolkits like Phidgets [14], Calder [18],littleBits [6], and .NET Gadgeteer [24] consist of modularcomponents intended to jump-start the creation of interactivedevices. These tools can reduce the time needed to designand prototype functional hardware, but lack customizabilitybeyond their pre-defined functionality.WALKTHROUGH OF THE SCANALOG SYSTEMTo illustrate the features of Scanalog, consider the followingexample task taken from an introductory lab assignment givento University students (Figure 3):A student, Sam, is tasked with building an EKG, a device whichcan visualize electrical activity in the heart. He learns thatEKGs work by picking up and amplifying the difference inelectrical potential across the body. Knowing this, he connectstwo electrodes to inputs of the FPAA board, attaching the otherends to his chest (Figure 3.A).Users begin designing with Scanalog by connecting its hardware to their PC and power source, and opening the interface.They can then connect to the FPAA board the input and outputconnections for their application. All changes to the hardware are thereafter made with Scanalog’s dataflow softwareinterface (Figure 2) or a built-in command line (Figure 2.H).Real-Time Visualization of All Circuit NodesAs Sam connects the electrodes, a visualization of the signalimmediately appears on the screen next to the input modules(Figure 3.B).
A: Placing electrodesB: Commencing visualization on the connected electrodesC: Connecting a subtractionmodule to the signal chainD: Interactively adding and tuning gain/filtering stagesE: Results from a global debugging testF: A completed EKG circuit, with assertions to monitor for issuesFigure 3. An example workflow demonstrating the features of Scanalog in the development of an EKG.Scanalog’s principal mode of assistance is the real-time visualization of live signals from all modules in the circuit. Inour example, Scanalog automatically probes signals from theelectrodes from the moment they are connected, renderingthem as waveforms alongside the corresponding input in thegraphical user interface (Figure 2.A). The user can enable ordisable live visualization on the output of each modular stagewithin the circuit. Users can also switch from autoscan modeinto manual probe mode, allowing them to capture the outputof any particular module in the circuit with a higher resolutionand refresh rate. As the user advances their design and tunesparameters, they can watch in real-time how the behavior ofthe entire circuit changes.Immediately Programmed High-Level ModulesNext, Sam knows that the EKG must take the difference between the two signals, so he selects the Subtraction modulefrom the Add Circuit Elements palette (Figure 2.E) and addsit to the circuit. Scanalog immediately reconfigures the FPAAwith resources that subtract the two inputs (Figure 3.C).Scanalog provides users with high-level modules encapsulating common subcircuits. Available modules were selected byobserving the components used in analog circuits constructedin introductory and intermediate engineering classes at Stanford University, and include gain, summation, subtraction,high-pass filtering, low-pass filtering, and comparator operations. Changes to the topology or parameters of the workingcircuit are immediately reflected in Scanalog’s underlying
hardware, so that users can try various options and observetheir effects on the signal in real time.Tuning Module/Subcircuit ParametersThough the electrodes are connected, the result of the subtraction shows no visible signal. Sam hypothesizes that the amplitude of the signal is too low to see, so he adds a Gain moduleto the design. Unsure of the exact amount of amplification, hescrubs the gain parameter of the module while observing theoutput. As the gain increases, he observes a signal. However,the signal is mostly noise, and so he correspondingly modifiesthe design by adding and tuning a low-pass and a high-passfilter. After filtering, the signal once more appears to requireamplification, so Sam continues adding and tuning gain stagesin an iterative fashion as the EKG signal appears increasinglywell conditioned (Figure 3.D)For each module, Scanalog provides interactive controls fortheir configurable parameters (Figure 2.D). Because changesare reflected instantly on the hardware and in the live visualizations, users can simply scrub parameters until the idealbehavior is achieved, rather than repeatedly guessing or calculating values. This direct parameter manipulation helpsthe user to build a holistic understanding of the circuit andfacilitates iteration.Debugging With Customizable TestsAs Sam interactively tunes parameters, he notices that certain parameter combinations result in the signal appearingdistorted or "clipped." Unsure of the issue, he runs a passof built-in global debugging tests over the circuit. Scanalogreports that the problematic module is exceeding the operatingvoltage of the board, and that gain should be reduced at thatstage. (Figure 3.E).Scanalog stores data captured for visualization to additionallyprovide automated debugging features. Scanalog is capableof scanning the current circuit for likely causes of issues,as defined by a customizable list of global debugging tests(Figure 2.F). Users can write their own tests in JavaScriptusing a built-in interface within the application.Signal AssertionsThough he resolves the voltage clipping issue, Sam is worriedthat continuing to tune the parameters of the circuit will causethe same problem elsewhere. To alert himself in this case,he adds assertions to his workspace, hooking them up to theoutput of the later gain stages. When later tuning causes theoutput of this module to reach the operating voltage of theboard, the test visually alerts him to the issue.Scanalog provides the ability to add software-like assertionsthat check when the signal violates properties that should remain invariant (Figure 4). The checks are performed in realtime, and assertions update visually to indicate a violation.As changes to an analog component often affect behaviorsin other parts of the circuit, assertions are particularly usefulin detecting and preventing regressions introduced by modifications to the circuit. Scanalog contains a built-in set ofassertions for basic issues (e.g. no signal on the output), andFigure 4. Adding in assertions to monitor invariants while designing.Here, the system detects if the monitored output exceeds the operatingvoltage of the hardware, resulting in clipping of the signal.the user can easily define custom assertions using an editorwithin the application.Recording, Replaying, and Unit Testing SignalsAs Sam seeks to finalize the design, he repeatedly comparesseveral combinations of parameters to determine which allowshim to tune the final filtering stage most effectively. Ratherthan repeatedly switching back and forth the settings on themany modules earlier in the design, Sam records for eachcombination of parameters the output of the gain stage justbefore the final filter. Then, he uses Scanalog’s playback functionality to generate each signal at the input of the board ondemand. This allows Sam to find the optimal set of parametersand finish the design.Scanalog allows users to record signals from the input or anymodule within the circuit, and subsequently play them backinto the input of the FPAA on command. This feature servestwo main functions: As a debugging tool, this allows the userto reliably produce a problematic signal, much like they canmanually simulate a corner case while debugging software.Moreover, it enables the use of unit tests. For example, a userdesigning an interactive system that classifies various gesturescan record an example of each gesture, and quickly verifythat the system recognizes all gestures correctly after eachmodification to the design. When run, unit tests iterate throughthe collection of recorded signals, verify each assertion foreach signal, and report any test failure.At the end of this example, the FPAA is configured as a working EKG, and the student can directly embed it in his application. Alternatively, Scanalog can translate the circuit into astandard representation with discrete components and exportit to a PCB design tool (such as Fritzing) to facilitate fabri-
(A) Designing a circuit using Scanalog(B) Exporting and editing the circuit in Fritzing(C) Fabricating a PCBFPAAFigure 5. Exporting a circuit from Scanalog (top) into Fritzing (bottom left), and then fabricating the designed circuit with standard components on a milled pcb (bottom e 6. Scanalog’s hardware components.cation (Figure 5). The output of the EKG from this exampleapplication is visualized in Figure 3.F.IMPLEMENTATIONIn addition to its graphical user interface, Scanalog has threeprimary components: an FPAA, a programmable USB oscilloscope, and an arbitrary waveform generator (Figure 6). Figure7 shows the communications between these components in afunctional diagram.Dynamic Configuration of the FPAAThe FPAA is the core hardware that serves as the user’s analogcircuit. We use the Anadigm AN231E04 [3] due to its ability to flash new configurations very rapidly. The AN231E04provides four configurable analog blocks, each containingeight capacitors, two operational amplifiers, and a comparator. Using switched-capacitor techniques and programmableinterconnects, it can connect these resources to approximate1a range of common analog subcircuits with variable resistive/capacitive elements. The AN231E04 operates on 3.3Vdifferential analog signals up to 1 MHz in frequency.of the GUI using a graph structure. Each module in the GUIcorresponds to a known subcircuit implementing the givenfunctionality, and for any change in the interface, Scanalogsolves the governing equations of the subcircuit to choose component values yielding the desired parameters of the module.A resource allocation stage then reassigns fixed componentsof the FPAA for each subcircuit and stores in a graph the connections which must be made between components. Finally,bytes are flashed over serial to the appropriate configurationRAM of the FPAA to reset the board with these connections(i.e. switch box paths) and components values (i.e. switchedcapacitor frequencies). Because Anadigm does not release thememory map describing which memory locations and bytevalues control which aspects of the circuit, implementationof this final programming stage required reverse engineeringof the mapping through repeated test circuit generation andcomparison.CaptureScanalog is capable of programming the same high-level modules as the AnadigmDesigner software, but can continuouslyupdate the circuit topology and parameters of the FPAA inreal time as the user adjusts their design. After the user makesa modification to the circuit, the hardware reflects the corresponding change within a few milliseconds.InputOutputFieldProgrammableAnalog ArrayPlaybackWe summarize the continuous programming of the FPAA asfollows: Scanalog internally represents the dataflow model1 We say “approximate” because the switched-capacitor implementation of the AN231E04 involves a certain frequency-dependent loss ofprecision over fixed tsArbitraryWaveformGeneratorHardwareCapture rInterfaceUserInputPlayback CommandsSoftwareFigure 7. Functional diagram of Scanalog and the communications between its components.
Data Capture and VisualizationScanalog uses two BitScope Micro BS05 USB ProgrammableOscilloscopes [11] - one to capture and record signals, andanother to generate signals for playback. When samplinga high-frequency signal, the oscilloscope must capture datafaster than it can stream over USB. Thus, Scanalog captures"traces" (fixed-duration captures from a given signal) andupdates visualizations within the interface between successivetraces. The BS05 is capable of 20 MS/s analog capture andcan store up to 12288 samples for a given trace. Scanalogallows the user to adjust the sampling rate and sample sizeof the oscilloscope to yield an appropriate window size fortheir signal (Figure 2.I). As a generator, the BS05 can outputarbitrary waveforms composed of up to 1024 interpolatedpoints with voltages ranging from 0 to 3.3 V.To implement this real-time scanning functionality, the dedicated oscilloscope connects to an arbitrary output pin onthe FPAA. Under the hood, while the user designs, Scanalograpidly configures connections to this output pin from eachmodule in the current circuit, triggering a capture for eachmodule and updating the corresponding visualization beforerepeating. This process is invisible to the user, and runs in thebackground as they design.Currently, a single atomic capture (reprogram a new connection to the oscilloscope, perform capture, read data and updatevisualizations) takes roughly 300 ms of overhead plus theduration of the specified capture. The equates to a 3 Hzrefresh rate between successive captures on a single module.Notably, because we choose to use a single oscilloscope andtime-multiplex over all circuit nodes, the refresh rate on eachmodule decreases linearly with the number of modules enabledfor active visualization.At any time, however, the user can choose to switch fromautoscanning into a manual probing mode and use the oscilloscope as a higher-refresh capture device for any module ofinterest (Figure 2.G). Because in this mode the system doesnot automatically reconfigure to capture new targets, the capture overhead takes 150 ms, equating to a refresh rate of 6 Hzfor most signals. This is useful when fine tuning parameterswhere high-fidelity monitoring of the output is important. Bydefault, the system updates all visualizations as soon as theyare available. However, the user can also pause this view andmanually record a signal from any module output.PlaybackWith traces recorded, Scanalog can program the waveformgenerator to "replay" the signal back to the FPAA. This requires downsampling the signal to fit within the 1024 pointbuffer of the generator, then scaling and offsetting the voltagesvalues to fit within the generator’s positive output range. Acustom amplification circuit soldered onto the FPAA invertsthe scaling and offsetting on the generated signal to output theoriginally captured signal to an customizable input pin.Tests and AssertionsScanalog also uses data from captured signals to run its globaldebugging tests, assertions, and unit tests. Each capture isrepresented as an array of voltage values, and each module/* Returns true iff the signal has voltages below ground */function hasNegativeVoltages(data, m){for (var i 0; i data.length; i ){if (data [i] 0){return true;}return false;Figure 8. A basic user-written test which alerts when a signal has negative voltages. Test functions are called with a module object (‘m’) containing the module parameters, and an array of voltage values (‘data’)representing the latest trace for that module.stores the most recent trace for use with tests. Global debugging tests scan the most recent data for each module, whereasassertion tests run on every data update for its connected module. Finally, Scanalog implements unit tests by replayingrecorded signals through a circuit configured with assertionsand reporting the results of those tests.To enable user-defined tests, Scanalog stores all tests as stringrepresented function objects which can be edited in text withinthe application. To add a new test, the user provides a namefor the test, adds an explanation to report on test failure, andthen edits an skeleton code of an example test to implementedout the desired check. Tests can access the array of voltagescaptured in the most recent trace, as well as parameters of themodule on which it runs. A basic example of a user-definedtest is shown in Figure 8.EXAMPLE RESULTSWe created three interactive systems to demonstrate Scanalog’spotential to assist with a range of analog design tasks. The first,described in the Walkthrough section (Figure 3), is a 2-leadEKG monitor capable of visualizing the electrical activity inan individual’s heart.The second application (Figure 9) is an interactive audio mixercapable of filtering, crossfading, and volume-adjusting tracksin real-time. The user first connects the signal lines from anaudio source (e.g. the 3.5 mm headphone jack of an MP3player) to the input of the FPAA, and then connects a speakerto the output. Because the audio signal is an analog waveform, Scanalog can manipulate the sound directly withoutsampling. We implement crossfading by connecting multiplesound sources to a summing stage, which can add their signalstogether with adjustable coefficients. The combined output ofthe summing stage passes first through a low-pass and thena high-pass filter. At each stage, the user can adjust the gain(volume) of the signal and the frequency ranges which passthrough.The third application (Figure 1) shows the conditioning of ananalog sensor to output a digital signal. We use a QRB1134 IRphotoelectric sensor, which detects proximity and reflectanceof objects. The sensor has an LED which emits infrared light,coupled with a photoresistive element tuned to the same wavelength. As objects come into proximity and reflect light backinto the receiver, the resistance of the sensor changes. Ourapplication configures the sensor for proximity sensing (to
765UsersE4321B0123(not at all)ACD45(very much)76CAUsers54321D01(not difficult)2345(very difficult)Figure 10. Likert responses to the questions, “Did you like the system?”(top), and “How hard was it to complete the task?” (bottom).Figure 9. Real-time audio crossfading by summing analog signals. Top:The setup used, including a speaker (A), two audio sources (C and D),and the Scanalog hardware (B) and software (E). Bottom: The audiocircuit, consisting of summing and filtering stages.detect user input), as well as to sense changes in material withdiffering reflectances (as a sensing device for robots). Thecircuit consists of a preliminary gain s
the design and debugging phases of analog circuit work. Here, raw signals from an IR photoelectric sensor are conditioned using gain and comparator modules to produce a clean digital output, enabling proximity sensing in interactive devices. ABSTRACT Analog circui