Transcription
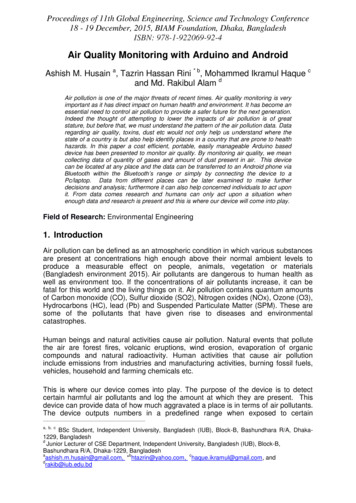
Proceedings of 11th Global Engineering, Science and Technology Conference18 - 19 December, 2015, BIAM Foundation, Dhaka, BangladeshISBN: 978-1-922069-92-4Air Quality Monitoring with Arduino and AndroidAshish M. Husain a, Tazrin Hassan Rini * b, Mohammed Ikramul Haque cand Md. Rakibul Alam dAir pollution is one of the major threats of recent times. Air quality monitoring is veryimportant as it has direct impact on human health and environment. It has become anessential need to control air pollution to provide a safer future for the next generation.Indeed the thought of attempting to lower the impacts of air pollution is of greatstature, but before that, we must understand the pattern of the air pollution data. Dataregarding air quality, toxins, dust etc would not only help us understand where thestate of a country is but also help identify places in a country that are prone to healthhazards. In this paper a cost efficient, portable, easily manageable Arduino baseddevice has been presented to monitor air quality. By monitoring air quality, we meancollecting data of quantity of gases and amount of dust present in air. This devicecan be located at any place and the data can be transferred to an Android phone viaBluetooth within the Bluetooth’s range or simply by connecting the device to aPc/laptop. Data from different places can be later examined to make furtherdecisions and analysis; furthermore it can also help concerned individuals to act uponit. From data comes research and humans can only act upon a situation whenenough data and research is present and this is where our device will come into play.Field of Research: Environmental Engineering1. IntroductionAir pollution can be defined as an atmospheric condition in which various substancesare present at concentrations high enough above their normal ambient levels toproduce a measurable effect on people, animals, vegetation or materials(Bangladesh environment 2015). Air pollutants are dangerous to human health aswell as environment too. If the concentrations of air pollutants increase, it can befatal for this world and the living things on it. Air pollution contains quantum amountsof Carbon monoxide (CO), Sulfur dioxide (SO2), Nitrogen oxides (NOx), Ozone (O3),Hydrocarbons (HC), lead (Pb) and Suspended Particulate Matter (SPM). These aresome of the pollutants that have given rise to diseases and environmentalcatastrophes.Human beings and natural activities cause air pollution. Natural events that pollutethe air are forest fires, volcanic eruptions, wind erosion, evaporation of organiccompounds and natural radioactivity. Human activities that cause air pollutioninclude emissions from industries and manufacturing activities, burning fossil fuels,vehicles, household and farming chemicals etc.This is where our device comes into play. The purpose of the device is to detectcertain harmful air pollutants and log the amount at which they are present. Thisdevice can provide data of how much aggravated a place is in terms of air pollutants.The device outputs numbers in a predefined range when exposed to -----------------------------------a, b, cBSc Student, Independent University, Bangladesh (IUB), Block-B, Bashundhara R/A, Dhaka1229, BangladeshdJunior Lecturer of CSE Department, Independent University, Bangladesh (IUB), Block-B,Bashundhara R/A, Dhaka-1229, Bangladeshabcashish.m.husain@gmail.com, * htazrin@yahoo.com, haque.ikramul@gmail.com, anddrakib@iub.edu.bd
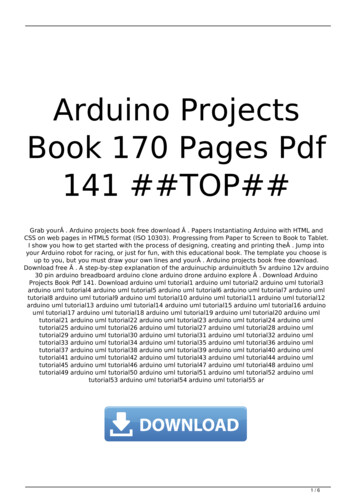
Proceedings of 11th Global Engineering, Science and Technology Conference18 - 19 December, 2015, BIAM Foundation, Dhaka, BangladeshISBN: 978-1-922069-92-4pollutants which will be discussed further. It can be used to monitor industrial airpollution, furthermore It can also be used in hospitals and sophisticated placeswhere air pollution should be as less as possible. Examples include hospitals,Children‟s Nursery, baby carriages, schools etc. The data provided from the devicecan be used to distinguish between polluted and less polluted areas.The hardware of the device consists of three sensors which include Sharp‟s opticaldust sensor GP2Y1010AU0F, gas sensors MQ-9, MQ-135, HC-05 Bluetooth moduleand an Arduino Mega board. The device measures the pollutants in the air andgenerates real time data, which can either be seen in a computer or an Androiddevice using the Bluetooth module.The overview of the whole system is shown below in Figure 1,Figure 1: Overview of the Proposed System2. Literature ReviewAir Pollution has been one of the major issues of the world. Regarding this issuemany research work has been conducted. “Design and Implementation of IndoorEnvironmental Quality Monitoring System Based on ZigBee” (Liu et al., 2015)presents a wireless monitoring system which monitors environmental parameters liketemperature and humidity. In another work called “Arduair: Air Quality Monitoring”(Chaudhry 2013) shows a low-cost and portable device which can be placedanywhere and the data can be plotted graphically in real time.2
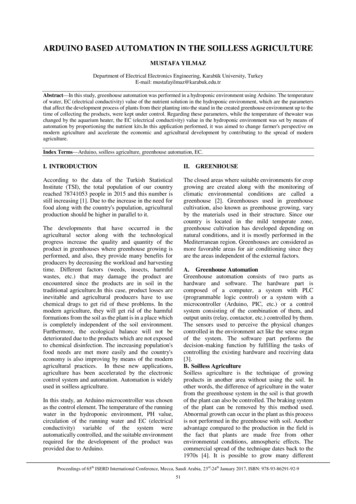
Proceedings of 11th Global Engineering, Science and Technology Conference18 - 19 December, 2015, BIAM Foundation, Dhaka, BangladeshISBN: 978-1-922069-92-4In a journal known as “Monitoring Of Green House Gases Using Wireless SensorNetworks with Arduino Board” (Vadlamudi and Bhrinda, 2015), they monitored thegreenhouse gas leakage such as CO2, NO2, humidity and temperature fromindustries and the data collected by the co-ordinator is updated into the webpageavailable on web server. A similar journal called “On-line Monitoring of Green Housegases Storage and Leakage Using Wireless Sensor Network” (Reddy and Natarajan,2015) also showed an on-line green house gases monitoring system based onwireless sensor network is implemented using X-bee Digi modules and open sourcehardware platform Arduino.A research paper known as “Wireless Measurement Node for Dust SensorIntegration” (Khadem et al., 2012) proposes the combination of two technologies byintegration of an optical interferometer dust sensor with a conventional sensornetworking platform through a data acquisition module.3. MethodologyIn total three sensors were used to monitor the air quality and they are MQ-9, MQ135 and optical dust sensor GP2Y1010AU0F.The sensors are connected to ArduinoMega 2560 board and when the Arduino is powered on, the sensors start togenerate data continuously in real time on the computer screen. The data can alsobe transferred to an Android phone using Bluetooth communication with the device.The user would simply have to connect to our device using their Android phone viaBluetooth and by using our Android application data transfer would become possible.The data mainly consists of air pollutant intensity values. Higher values indicatehigher air pollutants and vice versa. The block diagram of the whole system is shownbelow in Figure 2.Figure 2: Block Diagram of the Proposed System3
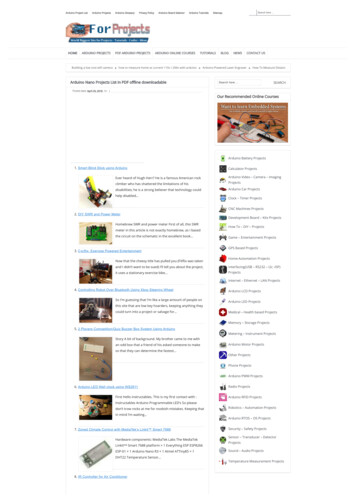
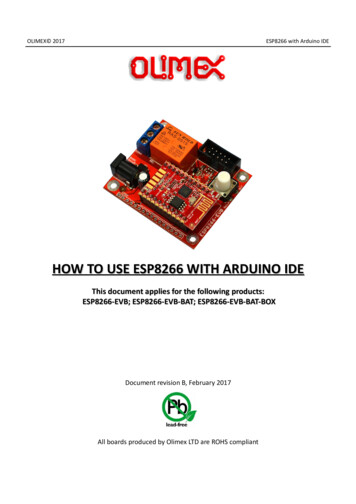
Proceedings of 11th Global Engineering, Science and Technology Conference18 - 19 December, 2015, BIAM Foundation, Dhaka, BangladeshISBN: 978-1-922069-92-44. Discussion4.1Hardware Components Used in the Proposed System4.1.1 Arduino Mega 2560 Microcontroller:Arduino is the perfect microcontroller due to its high performance and specialfeatures. The ATmega2560 AVR (Arduino 2015) comes with an entire set of programand system development tools including macro assemblers, C compilers, in-circuitemulators, program debugger /simulators and evaluation kits. It has 54 digitalinput/output pins (of which 15 can be utilized as PWM outputs), 16 analog inputs,4 UARTs (hardware serial ports), a 16 MHz crystal oscillator, a USB connection, apower jack, an ICSP header, and a reset button. The ATmega2560 was chosen forthe proposed system design due to its low cost with full efficient and excellentinterfacing capability with air quality sensors such as MQ-9, MQ-135 andGP2Y1010AU0F Sharp Optical Dust Sensor. The picture of Arduino Mega 2560 isshown in Figure 3.Figure 3: Arduino Mega 2560 Front & Back Side4.1.2 MQ-9 Gas Sensor:MQ-9 gas sensor (Seeedstudio 2015) has high sensitivity to Carbon Monoxide (CO).The sensor high sensitivity to CO and ignitable gases; it has low cost and is suitablefor different applications such as Industrial/Portable gas detection. The delicatematerial utilized as a part of MQ-9 gas sensor is tin dioxide (SnO2), which has lowerconductivity in a clean air medium. At the point when the target CO is detected, thesensor's conductivity rises and increments proportionately as the degree of CO gasincreases. The MQ-9 gas sensor was chosen for high performance detectionrange(i.e.)10-1000ppm for (CO),100-10000ppm for ignitable gas which has got itsquick reaction time and is a low controlled powered device ( 5V) [3]. This sensor hasdiverse resistance esteem in distinctive concentration. The picture of MQ-9 GasSensor is shown in Figure 4.Figure 4: MQ-9 Gas Sensor Front & Back Side4
Proceedings of 11th Global Engineering, Science and Technology Conference18 - 19 December, 2015, BIAM Foundation, Dhaka, BangladeshISBN: 978-1-922069-92-44.1.3 MQ-135 Gas Sensor:MQ-135 gas sensor (Waveshare 2015) has high sensitivity to detect different typesof gases. They are used in air quality control equipment‟s for buildings/offices, aresuitable for detecting of NH3, NOx, alcohol, Benzene, smoke, CO2 ,etc. The delicatematerial used in MQ-135 gas sensor is tin dioxide (SnO2), which has lowerconductivity in a clean air medium. At the point when the target gas is detected, thesensor‟s conductivity rises and increments proportionately as the extent of gasincrease. The MQ-135 gas sensor was chosen for high performance detection range(i.e.) 10ppm-300ppm NH310ppm-1000ppm Benzene, 10ppm-300ppm Alcohol whichhas got its fast response time and is a low powered device ( 5V) [4]. This sensorhas different resistance value in different concentration. The picture of MQ-135 GasSensor is shown in Figure 5.Figure 5: MQ-135 Gas Sensor Front & Back Side4.1.4 GP2Y1010AU0F Sharp Optical Dust Sensor:GP2Y1010AU0F Sharp Optical Dust sensor which is a minimal, ease optical dustsensor, comprising of an infra-red emanating diode and a phototransistor, wasutilized as air quality sensor as a part of the system. It identifies airborne particlesutilizing scattered light and is equipped for recognizing fine particles. It is normallyutilized as a part of air purifiers and air screens. The sensor has very low currentconsumption (20mA max, 11mA typical) and can be powered with up to 7VDC. Theoutput of the sensor is an analog voltage proportional to the measured dust density,with a sensitivity of 0.5V/0.1mg/m3 (Sparkfun 2015). The sensor was chosenbecause of its compact size, envisioned for integration in air purifiers or airconditioning units which is also suitable for our design. The picture ofGP2Y1010AU0F Sharp Optical Dust Sensor is shown in Figure 6.Figure 6: GP2Y1010AU0F Sharp Optical Dust Sensor5
Proceedings of 11th Global Engineering, Science and Technology Conference18 - 19 December, 2015, BIAM Foundation, Dhaka, BangladeshISBN: 978-1-922069-92-44.1.5 Bluetooth (HC-06):Bluetooth serial module is used for converting serial port to Bluetooth. It uses theUART protocol to make it easy to send and receive data wirelessly. This module is aslave only device which means that it can connect to most phones and computerswith Bluetooth but it cannot connect to other slave only devices such as keyboardsand other HC-06 modules. The input voltage range is 3.3V to 6V. HC-06 Bluetoothmodule was adopted for wireless communication with a range of up to 30 feet.Bluetooth has been perceived as a viable mode for short range data communicationdue to the fact that it has moderately low power utilization and ease compared withWi-Fi or GSM information/data transmission (Piguino-Wiki 2015). The picture ofBluetooth HC-06 is shown in Figure 7.Figure 7: Bluetooth (HC-06)4.2Prototype of the Proposed SystemWhen the Arduino is powered on by 5volt battery or a USB power supply, the entiresystem will become functional. Each sensor of the device produces their individualreading. Each sensor has been calibrated according to our needs and the users canchange calibration at anytime in order to receive output values according to theirspecific requirements. The hardware design of the proposed system is shown inFigure 8.Figure 8: Prototype of the Proposed SystemThe MQ-9 gas sensor when subjected to the carbon monoxide produces output inthe form of voltages that can be calibrated according to real world scenarios. It has avariable resistor on its body which can be used to calibrate the output voltage of thedevice. According to our scenario higher readings in the range (1-1000) tend toindicate higher levels of carbon monoxide.6
Proceedings of 11th Global Engineering, Science and Technology Conference18 - 19 December, 2015, BIAM Foundation, Dhaka, BangladeshISBN: 978-1-922069-92-4The MQ-135 gas sensor when subjected to NH3, NOx, alcohol, Benzene, smoke,CO2 produces output in the form of voltage. We have scaled it to our requirementswhere the readings are between 0 to 5, where values closer to 0 indicates better airquality and higher values indicates worse air quality.GP2Y1010AU0F Sharp Dust sensor has a similar functionality as it also producesvoltage values when subjected to dust in air. It also produces values among therange (1-1000) where the values closer to 1000 indicate a more dusty condition.The general purpose of the Bluetooth module, known as the HC-06 is to transferdata from the device to the Android phone or any Bluetooth terminal device. Thismakes it convenient to transfer data between two different Bluetooth enableddevices.4.3Android Application of the proposed systemIn order to make data collection process more convenient, we opted to choose theAndroid mobile platform because of its popularity and productiveness. In order tocollect the data from the device to phone an Android application was built using theAndroid SDK (Developer.Android 2015). The application will run on phones with aminimum requirement of the operating system Ice Cream Sandwich. The Applicationfunctions by making the user pair, the phone with the physical air quality measuringdevice via Bluetooth. After successfully establishing connection, the user isprompted to load the data to their phone. This process retrieves the data from the airmeasuring device to the Android phone using the Bluetooth. The data later can besaved on to the physical memory/SD Card of the phone.4.4ResultsThe air analyzer device requires 5volt input voltage to function. The voltage sourcecan be a USB powered brick or a battery pack that can deliver the functioningvoltage. The device is plugged with MQ-135, MQ-9, Optical Dust sensor and aBluetooth module. All the individual components function distinctively and producetheir own outputs. The entire device works as a perfect data logging unit that cankeep log of the level of dust, carbon mono-oxide and NH3,NOx, alcohol, Benzene,smoke, CO2 in an environment. Once the device is powered on, the sensors will beturned on and will start generating data which will be sent to two mediums, the comport and the Bluetooth module. Sending it to two different mediums is done so thatthe end user can witness data either in their Android phone or the computer that theyare working on. The output seen from computer screen and Android phone areshown below in Figure 9 & 10.7
Proceedings of 11th Global Engineering, Science and Technology Conference18 - 19 December, 2015, BIAM Foundation, Dhaka, BangladeshISBN: 978-1-922069-92-4Figure 9: Output Seen on Computer ScreenFigure 10: Output Seen on Android ApplicationThe device can be placed anywhere and data can be taken from anywhere within theBluetooth‟s range. We opted to provide further convenience to the users of thedevice by developing the Android application which will receive the data from thedevice when connected. Figure 9 shows data being sent to the serial monitor of acomputer having an Arduino development environment.This device is affordable and easy to use. There may be many air monitoring devicesavailable in the market but they may be quite expensive. The proposed device ischeaper and more user friendly. The cost of this device has been listed below inTable 1.8
Proceedings of 11th Global Engineering, Science and Technology Conference18 - 19 December, 2015, BIAM Foundation, Dhaka, BangladeshISBN: 978-1-922069-92-4Table 1: Price list of the components used in the proposed systemItemNo.1.2.3.4.5.DeviceQuantityCost ( )Arduino Mega 256016.20MQ-9 Gas SensorMQ-135 Gas SensorGP2Y1010AU0F SharpOptical Dust SensorBluetooth (HC-06)1112.101.944.0912.95Total : 17.28 USD5. Comparison between the existing systems and the proposedsystemThere are some existing systems which monitor the Air Pollution, but the proposedsystem has many advantages over them.It can be seen from Table 2 that the existing system might be much moresophisticated from the proposed system but in terms of price and monitoring airpollutants, the proposed system excels but at a less cost.Our proposed device is modular. If any of the sensors malfunctions, they can beeasily replaced without having to replace the entire device.Table 2: Comparison between the existing systems and the proposed systemDevice NameAir Pollutants measuredby the devicePriceIndoor Air Quality Meter CO2, Temperature &Relative HumidityCO2, Temperature &Relative Humidity 129.00Mini CO2 MonitorCO2 109.00PYLPCMM05 - PYLEPCMM05 CarbonMonoxide MeterCarbon Monoxide (CO) 227.24The proposed systemCarbon Monoxide (CO),NH3, NOx, alcohol,Benzene, smoke, CO2,Dust 17.289
Proceedings of 11th Global Engineering, Science and Technology Conference18 - 19 December, 2015, BIAM Foundation, Dhaka, BangladeshISBN: 978-1-922069-92-46. ConclusionThe proposed device can be used to monitor air quality in many aspects. It can beused in industry, hospital, streets and many other places for daily monitoring. It canbe very useful for the parents as well; as they can ensure safety of their children byusing the device to monitor air pollutants. It‟s a compact device to monitor air qualityfrom any place. This device can be used for further research on air pollution due toits ability to transfer data logs. This will make the people more aware of the airpollution around them. Analysis of the big-data from the device will bear fruit toenhancement of the world. Decisions regarding safety can be taken once enoughdata is present to support the cause. This is where the device will shine.References:Arduino 2015, Products, Arduino Board Mega 2560, viewed 28 July, 2015, 0 Bangladeshenvironment 2015, Pollution‟s, Air Pollution, Air Pollution in Dhaka City,viewed 28 July, 2015, y Chaudhry V. (2013), „Arduair: Air Quality Monitoring‟, International Journal ofEnvironmental Engineering and Management, Volume 4, Number 6, pp.639646Developer.Android 2015, Develop, Tools, viewed 27 October, 2015, https://developer.android.com/sdk/index.html Kalic, G., Bojic, I. and Kusek, M. (2012) „Energy consumption in android phoneswhen using wireless communication technologies‟, MIPRO, 2012 Proceedingsof the 35th International Convention, pp. 754–759.Khadem M. I., Stamatescu G., Sgarciu V. (2012), „Wireless Measurement Node forDust Sensor Integration‟, SENSORCOMM 2012: The Sixth InternationalConference on Sensor Technologies and Applications, pp.159-164.Liu, X.M., Wang F.F., Zeng Z.B. (2015), „Design and Implementation of IndoorEnvironmental Quality Monitoring System Based on ZigBee‟, InternationalConference on Computer Information Systems and Industrial Applications(CISIA 2015), pp. 297- 300.Piguino-Wiki 2015, SPP Bluetooth Modules, viewed 28http://wiki.pinguino.cc/index.php/SPP Bluetooth Modules July,2015, Reddy M. A., Natarajan V. (2015), „On-line Monitoring of Green House gasesStorage and Leakage Using Wireless Sensor Network‟, International Research10
Proceedings of 11th Global Engineering, Science and Technology Conference18 - 19 December, 2015, BIAM Foundation, Dhaka, BangladeshISBN: 978-1-922069-92-4Journal of Engineering and Technology (IRJET), Volume: 02, Issue: 01, pp.158161.Seeedstudio 2015, Wiki, Grove - Gas Sensor, viewed 28 July, 2015, http://www.seeedstudio.com/wiki/Grove - Gas Sensor Sparkfun 2015, Products, Optical Dust Sensor-GP2Y1010AU0F, viewed 28 July,2015, https://www.sparkfun.com/products/9689 Vadlamudi M. K., Brindha G. S. (2015), „Monitoring Of Green House Gases UsingWireless Sensor Networks with Arduino Board‟, International Journal ofScience, Engineering and Technology Research (IJSETR), Volume 4, Issue 4,pp. 741-745.Waveshare 2015, Wiki, MQ-135 Gas Sensor, viewedhttp://www.waveshare.com/wiki/MQ-135 Gas Sensor 28July,2015, 11
Air Quality Monitoring with Arduino and Android Ashish M. Husain a, Tazrin Hassan Rini * b, Mohammed Ikramul Haque c and Md. Rakibul Alam d Air pollution is one of the major threats of recent times. Air quality monitoring is very important as it has direct impact on human health and environment. It has become an essential need to control air pollution to provide a safer future for the next .